本文為機器翻譯
展示原文
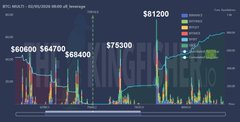
巧合嗎?我不這麼認為。
✅ 68.4K
✅ 64.7K
✅ 60.6K

IT Tech
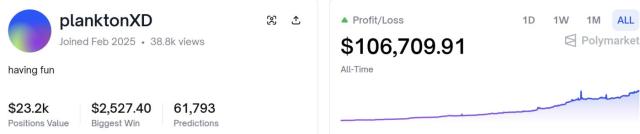
@IT_Tech_PL
02-05
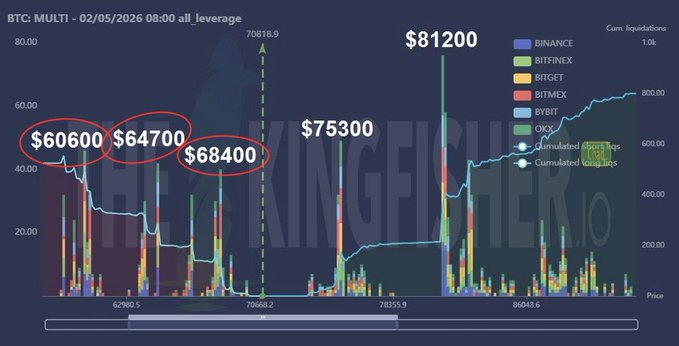
$BTC is trading like a liquidity hunt.
On the all-leverage liquidation map, the biggest pools sit below price:
• 81.2K
• 75.3K
• 68.4K
• 64.7K
• 60.6K
📊 Lose support and downside is the easier move. That’s where the stacked long leverage gets forced out.
✨ Takeaway:
流動性地圖很有用,但它們是磁鐵——而不是命運。
確實如此。它們就像路線圖一樣。
來自推特
免責聲明:以上內容僅為作者觀點,不代表Followin的任何立場,不構成與Followin相關的任何投資建議。
喜歡
收藏
評論
分享