Author: Digital Asset Research Source: substack Translation: Shan Ouba, Jinse Finance
The first half of this year has been a roller coaster ride for investors, with markets experiencing sharp gains and relatively low volatility. Most investors have been perplexed by the market because it is so disconnected from what they experience in the real economy.
As we head toward the middle of the year, the stock market has been buoyed by optimism among traders after a sharp rally in the first half of the year. However, this month that optimism has been accompanied by caution as technical indicators and time periods suggest that turbulence may lie ahead.
Meanwhile, the cryptocurrency market has faced a number of challenges, but now appears to be a great buying opportunity, especially for Ethereum and other Altcoin. As the first half of the year comes to an end, it is crucial to understand the signals and patterns that may affect the coming months.
Now let's look at the starting point of the S&P 500.

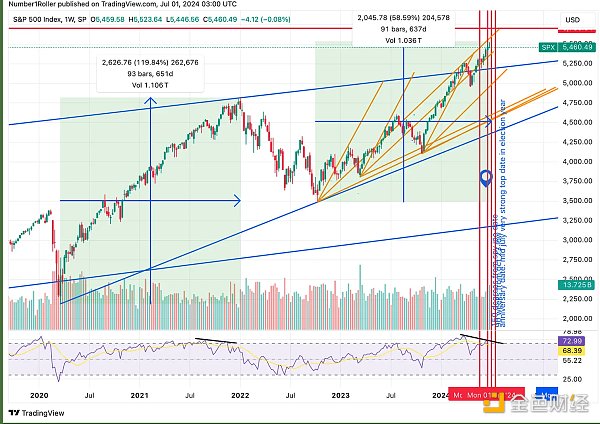
I think stocks may be entering the danger zone for this rally. Zooming out from here to the weekly chart, we can see the balance of time starting to play out. It was 93 weeks from the pandemic crash to the peak. We are now entering week 91 of this move. Additionally, a bearish divergence has formed on the RSI as you can see in the two black lines below. Price is making new highs, while the RSI is not. There is still room to move higher over the next week or two, but be aware that we may see a correction to the August window that I have been highlighting since the beginning of the year.
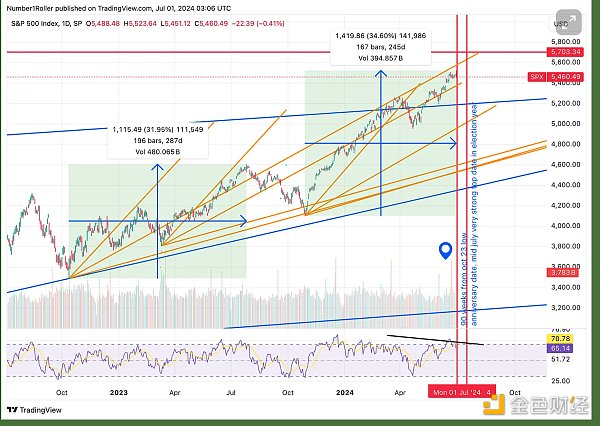
If we zoom in on the daily data, we also see warning signs.

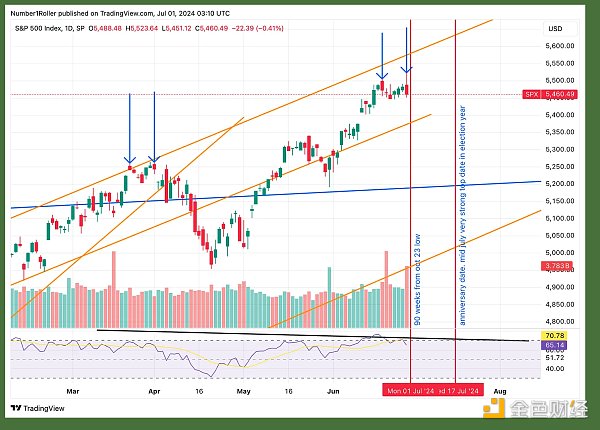
First, we see two nearly symmetrical moves from the bear market low. Another 200 pip move would not surprise me as that would make this move 150% of the previous move and create a much larger divergence. Also, looking closer, we can see a set of signal candles forming a Double Top. Finally, you can see that the 17th of this month is marked as an anniversary, which is a very strong top date in an election year.

Therefore, given the macro timing factors that align with price action and current positioning, I believe we may see a more significant correction in the second half of the month.
The last date I want to tell you about is June 7th, which is a natural date and it coincides with the end of this week.

According to Gann's rule, "The advance or decline usually peaks on this date." I would say we have been in a big advance so far. Also note June 22nd and how SPY put in its first signal candle on the 20th.
Turning our attention to encryption, we have the exact opposite setup.
Again, the Gann Natural Date applies, but unlike the stock market, the cryptocurrency market has been falling as it enters this natural date.

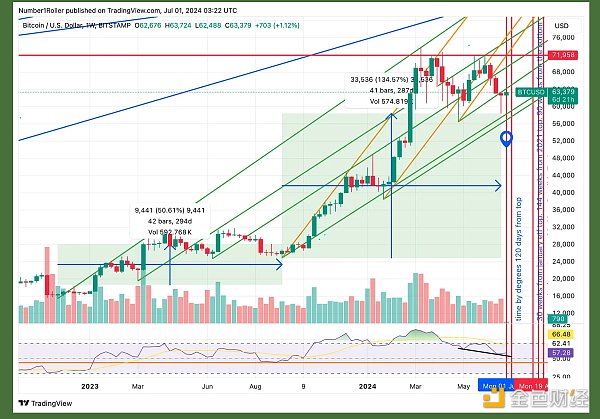
BTC has an almost identical setup to SPY, but in the opposite direction. It took 42 weeks from macro low to macro low, which was the first phase of the cycle. Now we are 42 weeks from that major low, and it looks like another major low, and higher than the May low. We are also seeing a bullish divergence on the RSI. The RSI is making lower lows, and the price is making higher lows.
This is a clear accumulation range for BTC above the previous ATH level and looks like the best setup of the year. It took a few weeks longer than expected, but BTC reached oversold levels not seen since the lows of 42 weeks ago, and before that we hadn’t seen levels like this since the FTX crash. I don’t know about you, but in my opinion this is a major opportunity and we may not see it again in this cycle.

With the upcoming ETF announcement, ETH is on a more solid footing. Starting with the weekly chart, you can see that the green close gives us the signal bottom and holds the 50% level in the purple box. On the daily chart, again focus on the 7th through the 9th. The 7th is the natural date and the 9th will be at a 120 degree angle to the March top.
In the last image, you can see that the ETH/BTC chart is trying to break out of the major weekly downtrend and start to recover the lost ground against BTC.
All in all, this is nothing new. Stocks surge, crypto gets hammered, then the tide turns. This has happened in previous cycles, and it looks like this is the trend for July. However, I still want to remind everyone that this is true not only for stocks, but also for crypto. We are still in a large consolidation range before the market can confidently break above 72k (BTC) and 4k (ETH). The second half of this month through mid-August will be something to watch. On the surface, the July 7th window will be a key turning point. From a macro perspective, this is a great buying opportunity, especially for the suppressed Altcoin.


