

Coin Metrics’ State of the Network: Issue 272

Get the best data-driven crypto insights and analysis every week:
Futures Falter, Funding Flips
By: Matías Andrade
Key Takeaways:
The Ethereum blockchain maintained consistent transaction activity during the crash, with USDC transaction activity increasing over the period to almost 30K txs/hour.
However, due to all this activity gas fees spiked over 5 ETH per block, but the network remained functional, allowing trades at higher costs.
The $4.1 billion decrease in Ethereum futures open interest provided insights into market sentiment and future price movement, particularly to traders or assets such as USDe that depend on the profitability of the ETH carry trade.
Introduction
The recent crash in the cryptocurrency market has brought renewed attention to the stability and resilience of the crypto ecosystem. In this week’s State of the Network, we evaluate the performance of various elements within the crypto space during and after the crash, comparing them to traditional financial markets. We'll focus on two key areas: the robustness of decentralized systems and the stability of synthetic financial products within the crypto ecosystem.
The Perils of Permissioned Finance
During the recent market crash, a stark contrast emerged between the permissionless systems of cryptocurrencies, taking as an example Ethereum, and traditional financial markets. The Ethereum blockchain operates on a 24/7 basis, enabling uninterrupted trading and transactions, unlike traditional markets with limited trading hours. However, while sufficiently-motivated traders are able to interact freely it comes at the cost of paying for gas; similarly, or analogous to slippage in traditional markets.
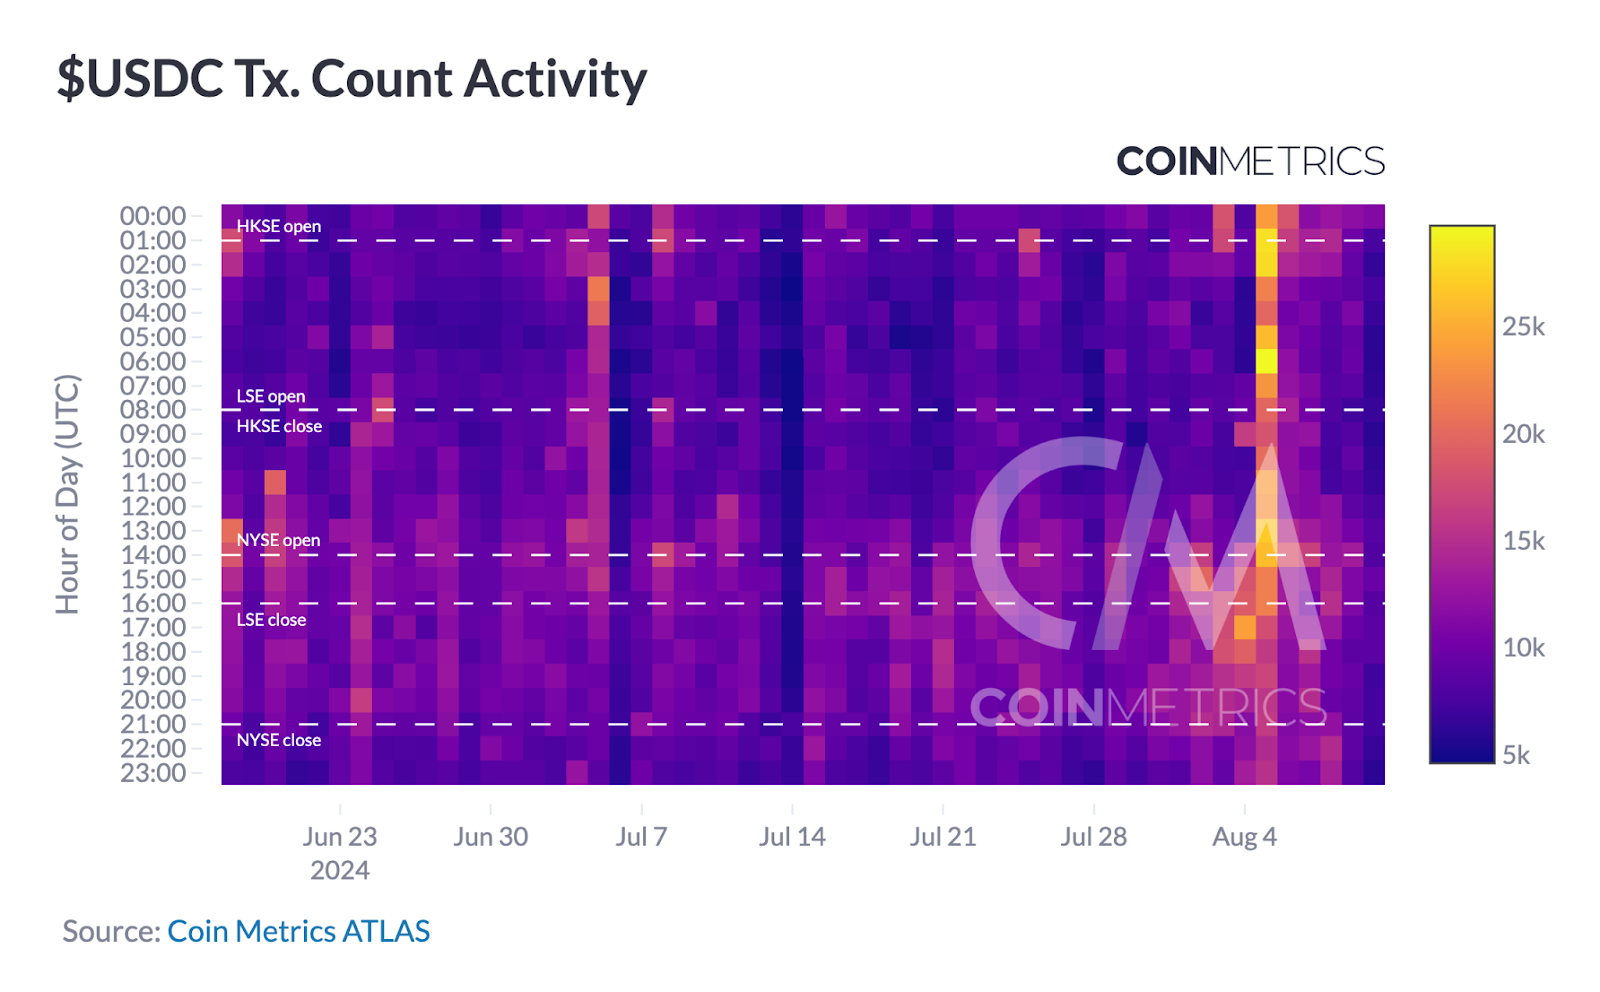
Source: Coin Metrics Stablecoin Dashboard
As we can see exemplified in the chart above by USDC’s transaction activity, the Ethereum network maintained consistent activity throughout the crash, without skipping a beat. Users could continue trading, albeit with higher fees due to increased network congestion. This accessibility stands in sharp contrast to many traditional financial brokers, who reported downtime and maintenance issues during the same period.
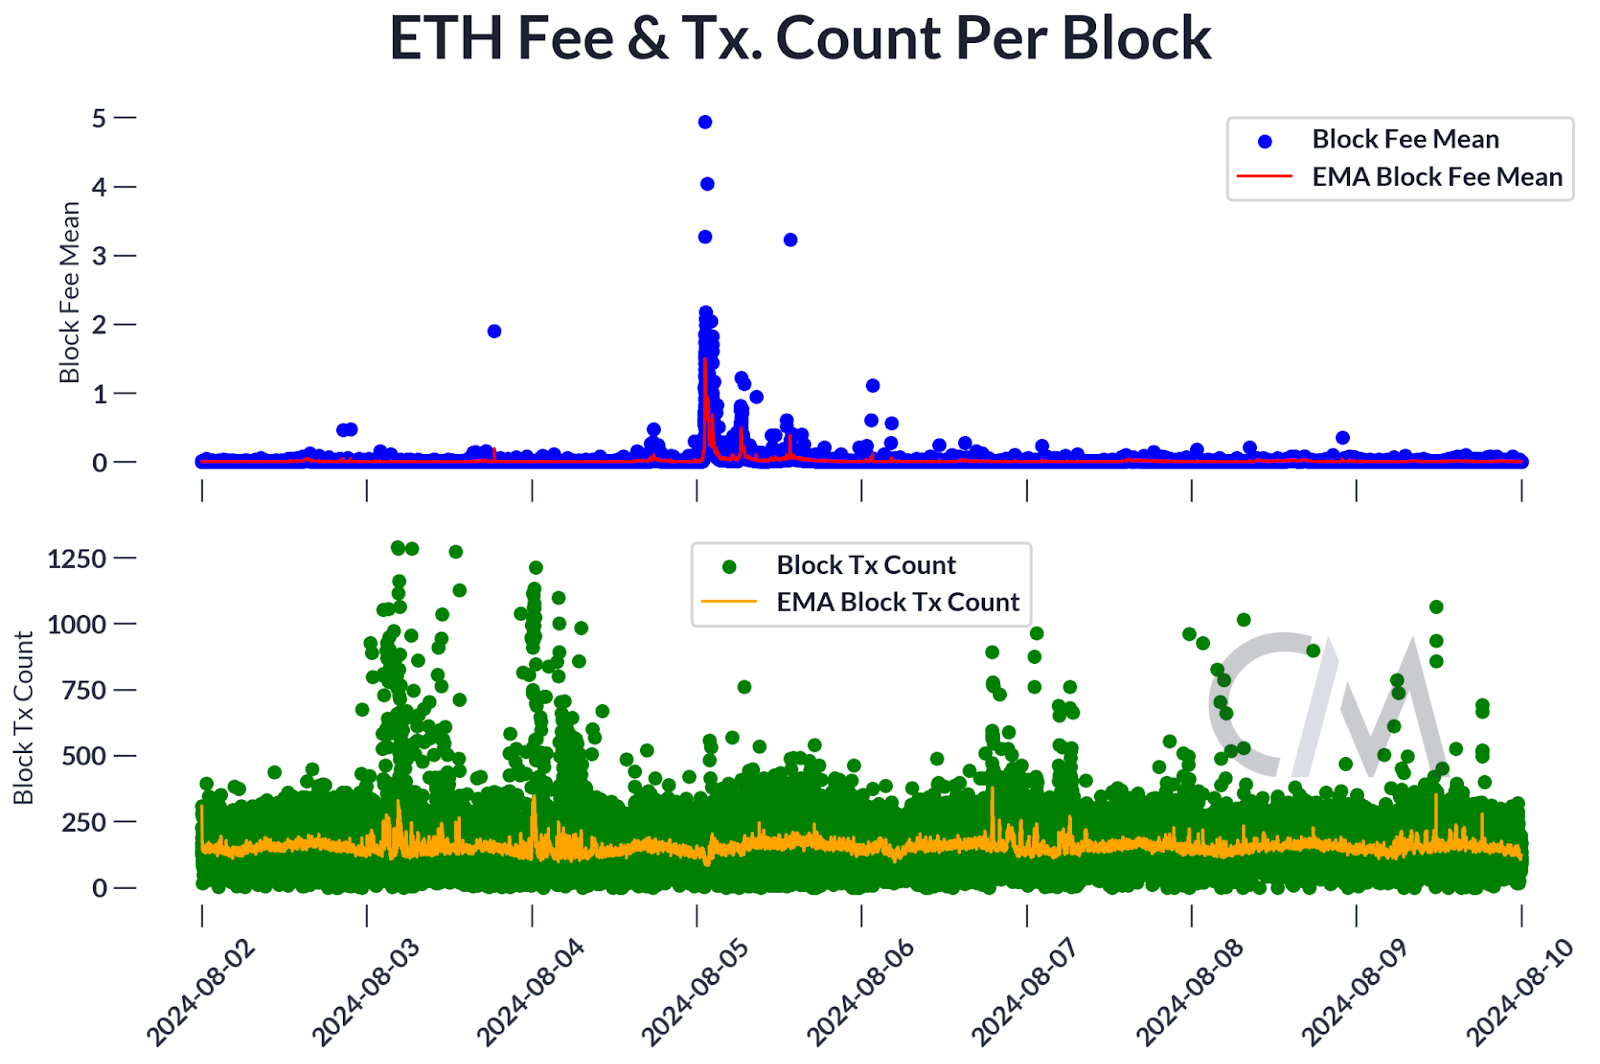
Source: Coin Metrics Network Data Pro
The crash period saw a significant spike in Ethereum gas fees, as shown in the chart above, with fees paid for a single block rising over 5 ETH. While this increase in transaction costs was substantial, it's important to note that this increase in fees was temporary and, most importantly, the network remained functional, allowing users to execute trades if they were willing to pay the higher fees.
On-Chain Yield Primitives
As different crypto financial products have matured, market participants have developed new and innovative ways to generate yield for on-chain investors. Unlike traditional stablecoins that may rely on off-chain collateral or centralized mechanisms to maintain their peg, Ethena's USDe is primarily backed by on-chain assets and protocols (albeit while still interacting with CEXs).
USDe is a synthetic stablecoin product created by Ethena on the Ethereum blockchain. Unlike traditional stablecoins that are backed by fiat currency reserves, USDe relies on a different approach to maintain its peg to the US dollar. USDe relies on staking ETH and shorting perpetual futures to generate yield on a dollar-neutral portfolio, thus creating a “synthetic dollar bond” that tracks the dollar while providing yield that is at least partially native to the Ethereum blockchain. We can see in the chart below the price activity of USDe over the last few days of August, noting that the market respected the peg to within 0.3% of its par value of $1.
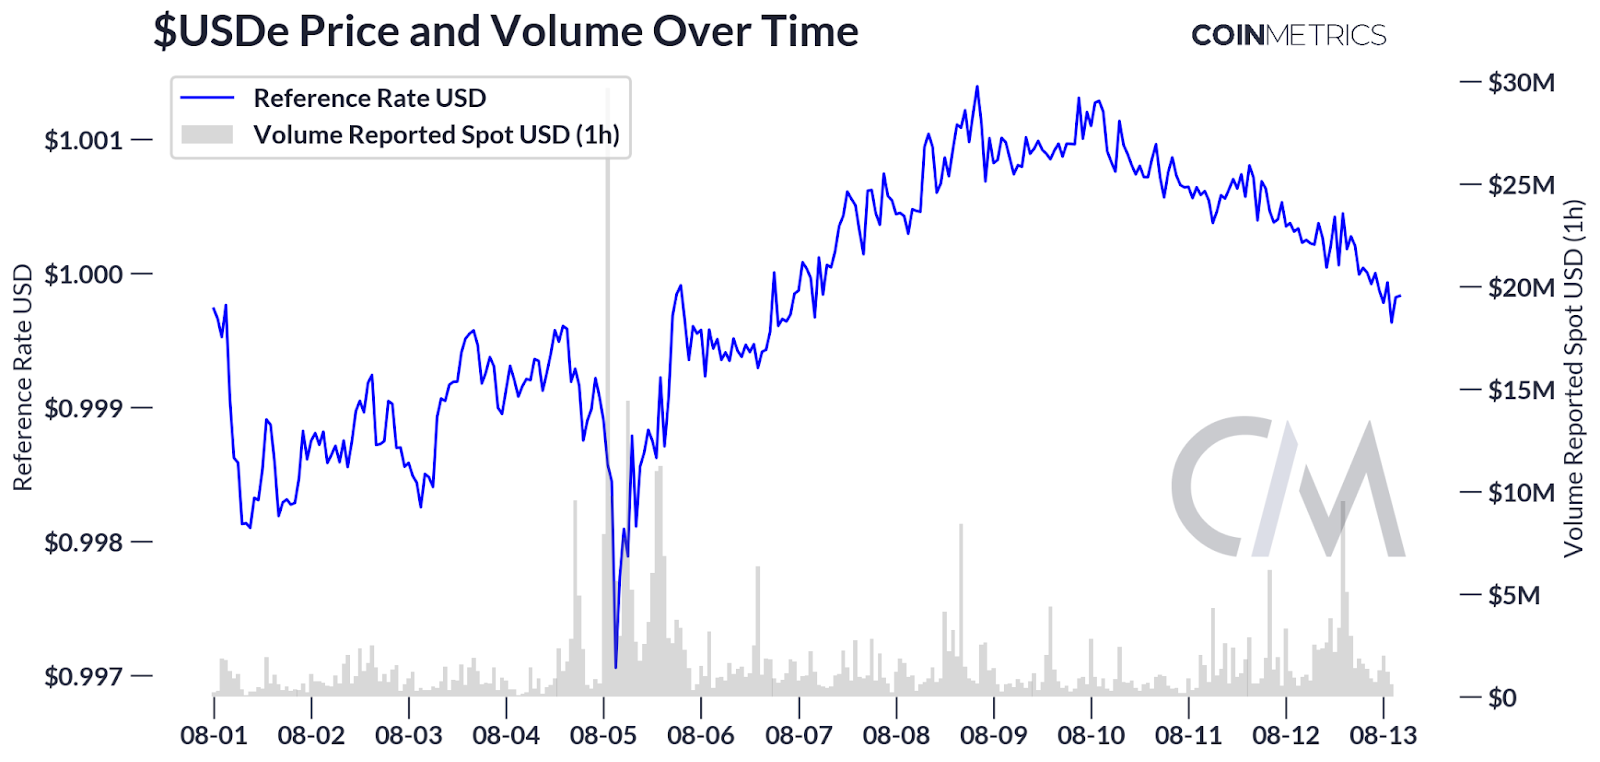
Source: Coin Metrics Market Data
One of the primary concerns regarding the USDe is its reliance on centralized control and the potential vulnerabilities this introduces, particularly the requirement of persistent positive funding rates which are essential to the sustainability of their dollar peg. However, over the weekend’s market correction, annualized funding rates went negative across most ETH futures markets, although by August 13th most markets with few exceptions had negative funding rates.
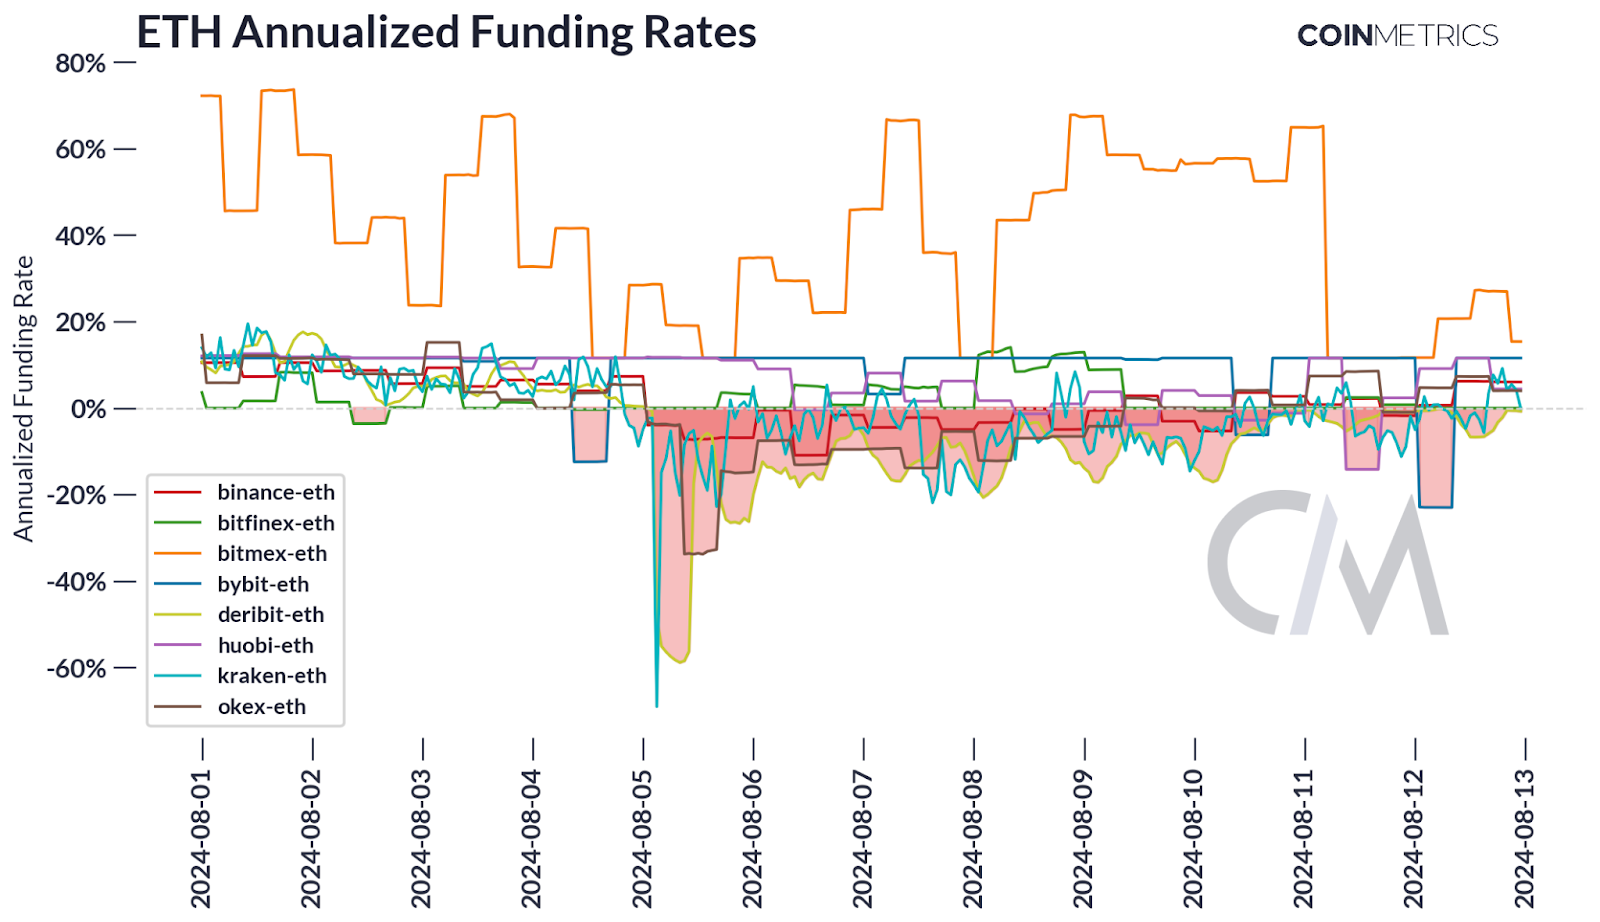
Source: Coin Metrics Market Data
As seen in the chart below, market participants reduced their long exposure to ETH during the crash or were liquidated. The forced liquidations of these leveraged long positions contributed to the further decline in the open interest, as the outstanding futures contracts were closed out en masse. This self-reinforcing cycle of price drops, margin calls, and liquidations can exacerbate the sell-off in the market. Savvy investors can take advantage of closely monitoring market liquidations to characterize the market and understand the underlying dynamics driving the price movements in digital assets and adjust their trading strategies accordingly.
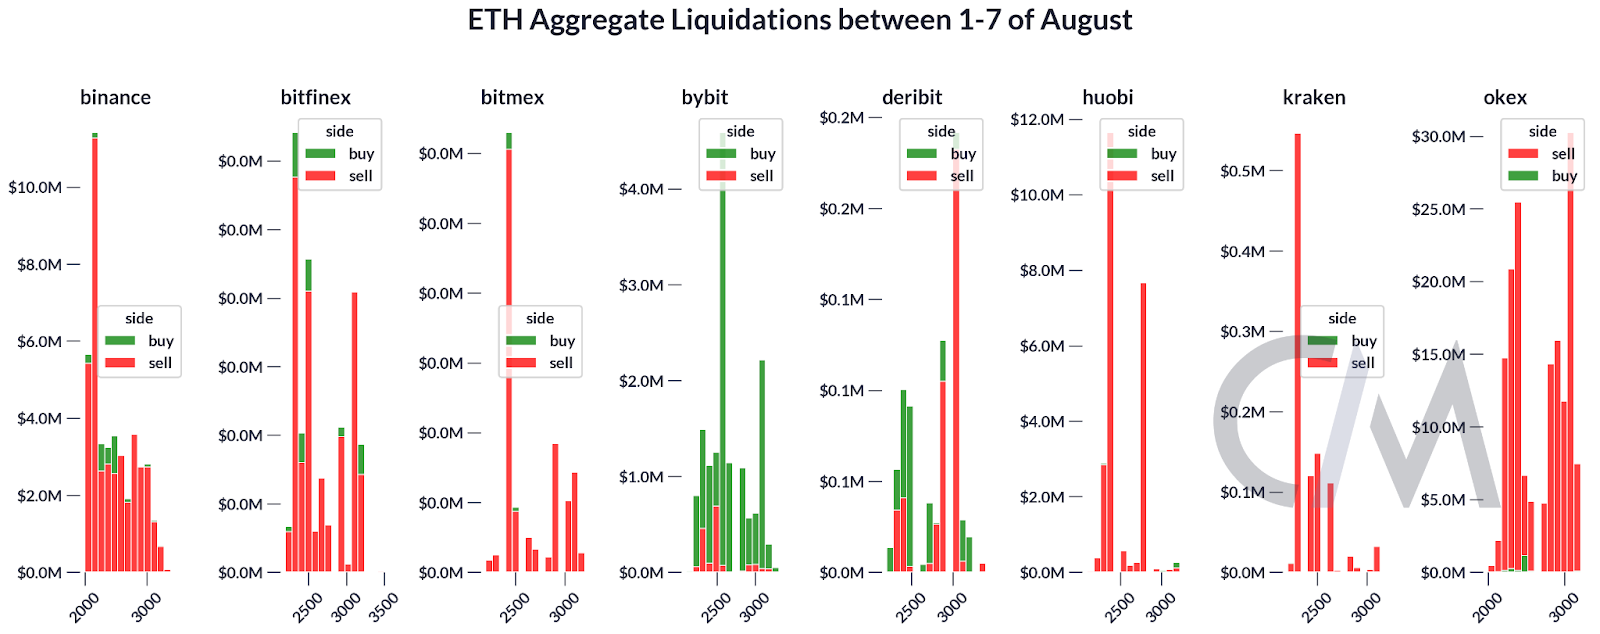
Source: Coin Metrics’ Market Data
This decrease in open interest often accompanies or follows periods of significant price volatility or sell-offs in the underlying asset, as traders become more risk-averse and unwind their leveraged positions. The reduction in open interest can provide insights into the overall market sentiment and the potential for future price movements. In the chart below, we can see that the decrease in open interest, measured by the gray dotted line, was approximately $4.1 billion.
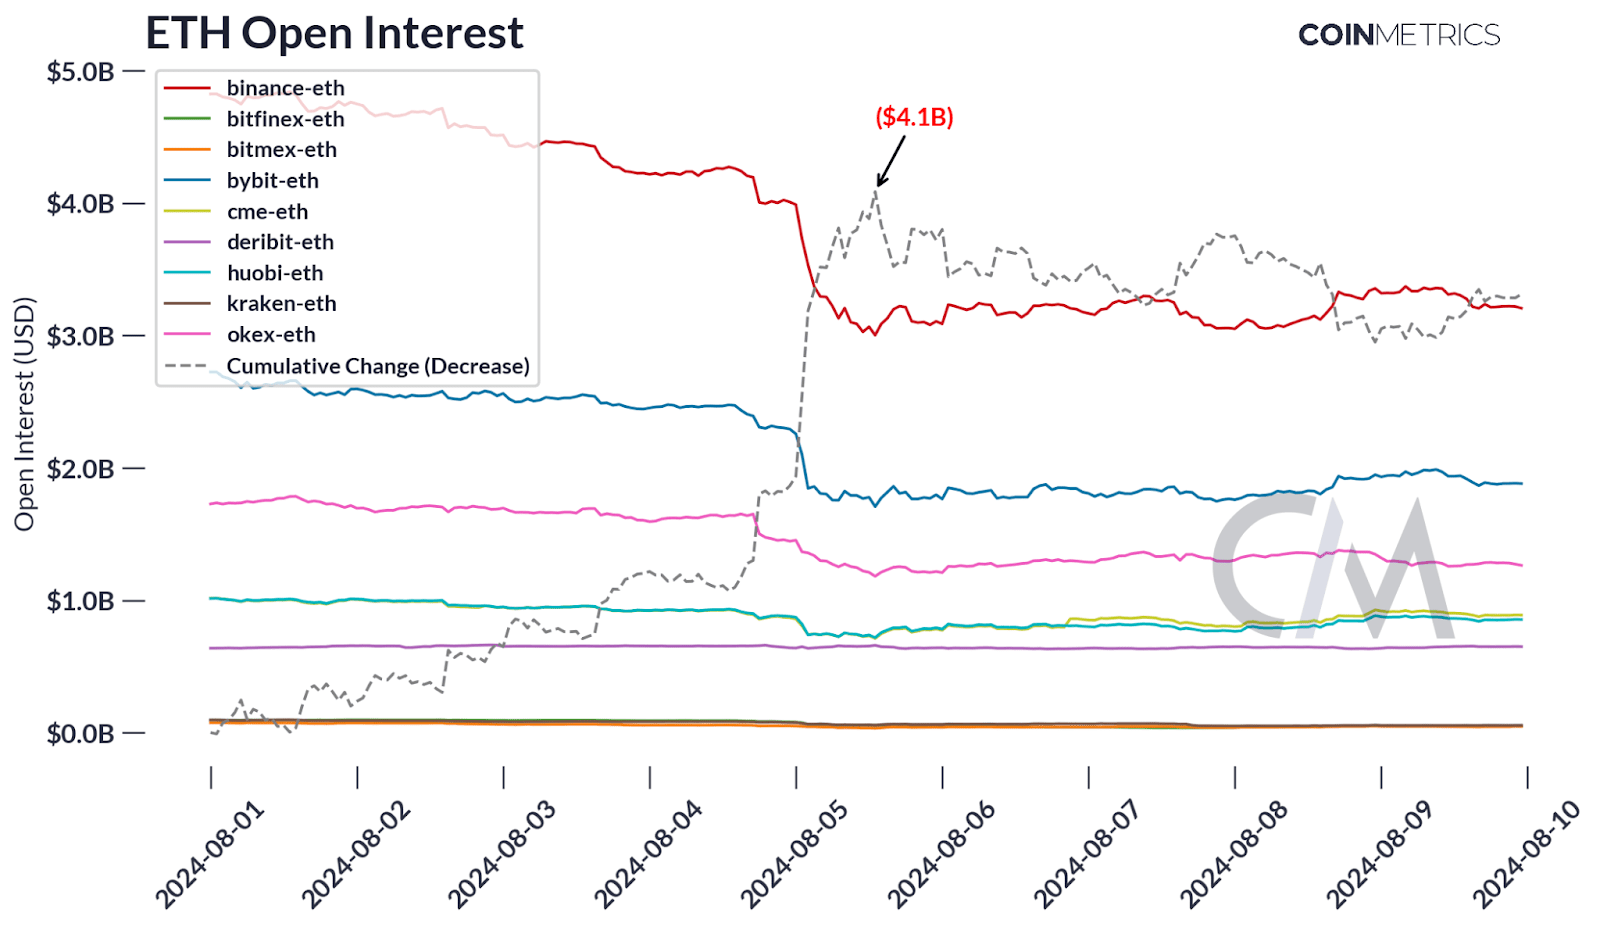
Source: Coin Metrics’ Market Data
By analyzing the changes in open interest alongside the price action of ETH, one can gain a better understanding of the dynamics and sentiment in the Ethereum futures markets, which can inform trading strategies and risk management decisions.
Conclusion
The recent crypto market crash has provided valuable insights into the strengths and weaknesses of the crypto ecosystem. While permissionless systems demonstrated remarkable resilience in terms of accessibility and functionality, they also faced challenges such as high transaction costs under stress. Synthetic products like USDE showed impressive stability, highlighting the potential of well-designed DeFi instruments while highlighting the importance of keeping track of the underlying portfolio’s performance when considering stability in the future. By harnessing the inherent yields available within the blockchain ecosystem, these innovative financial products offer a compelling alternative to traditional yield-generating instruments.
Network Data Insights
Summary Highlights
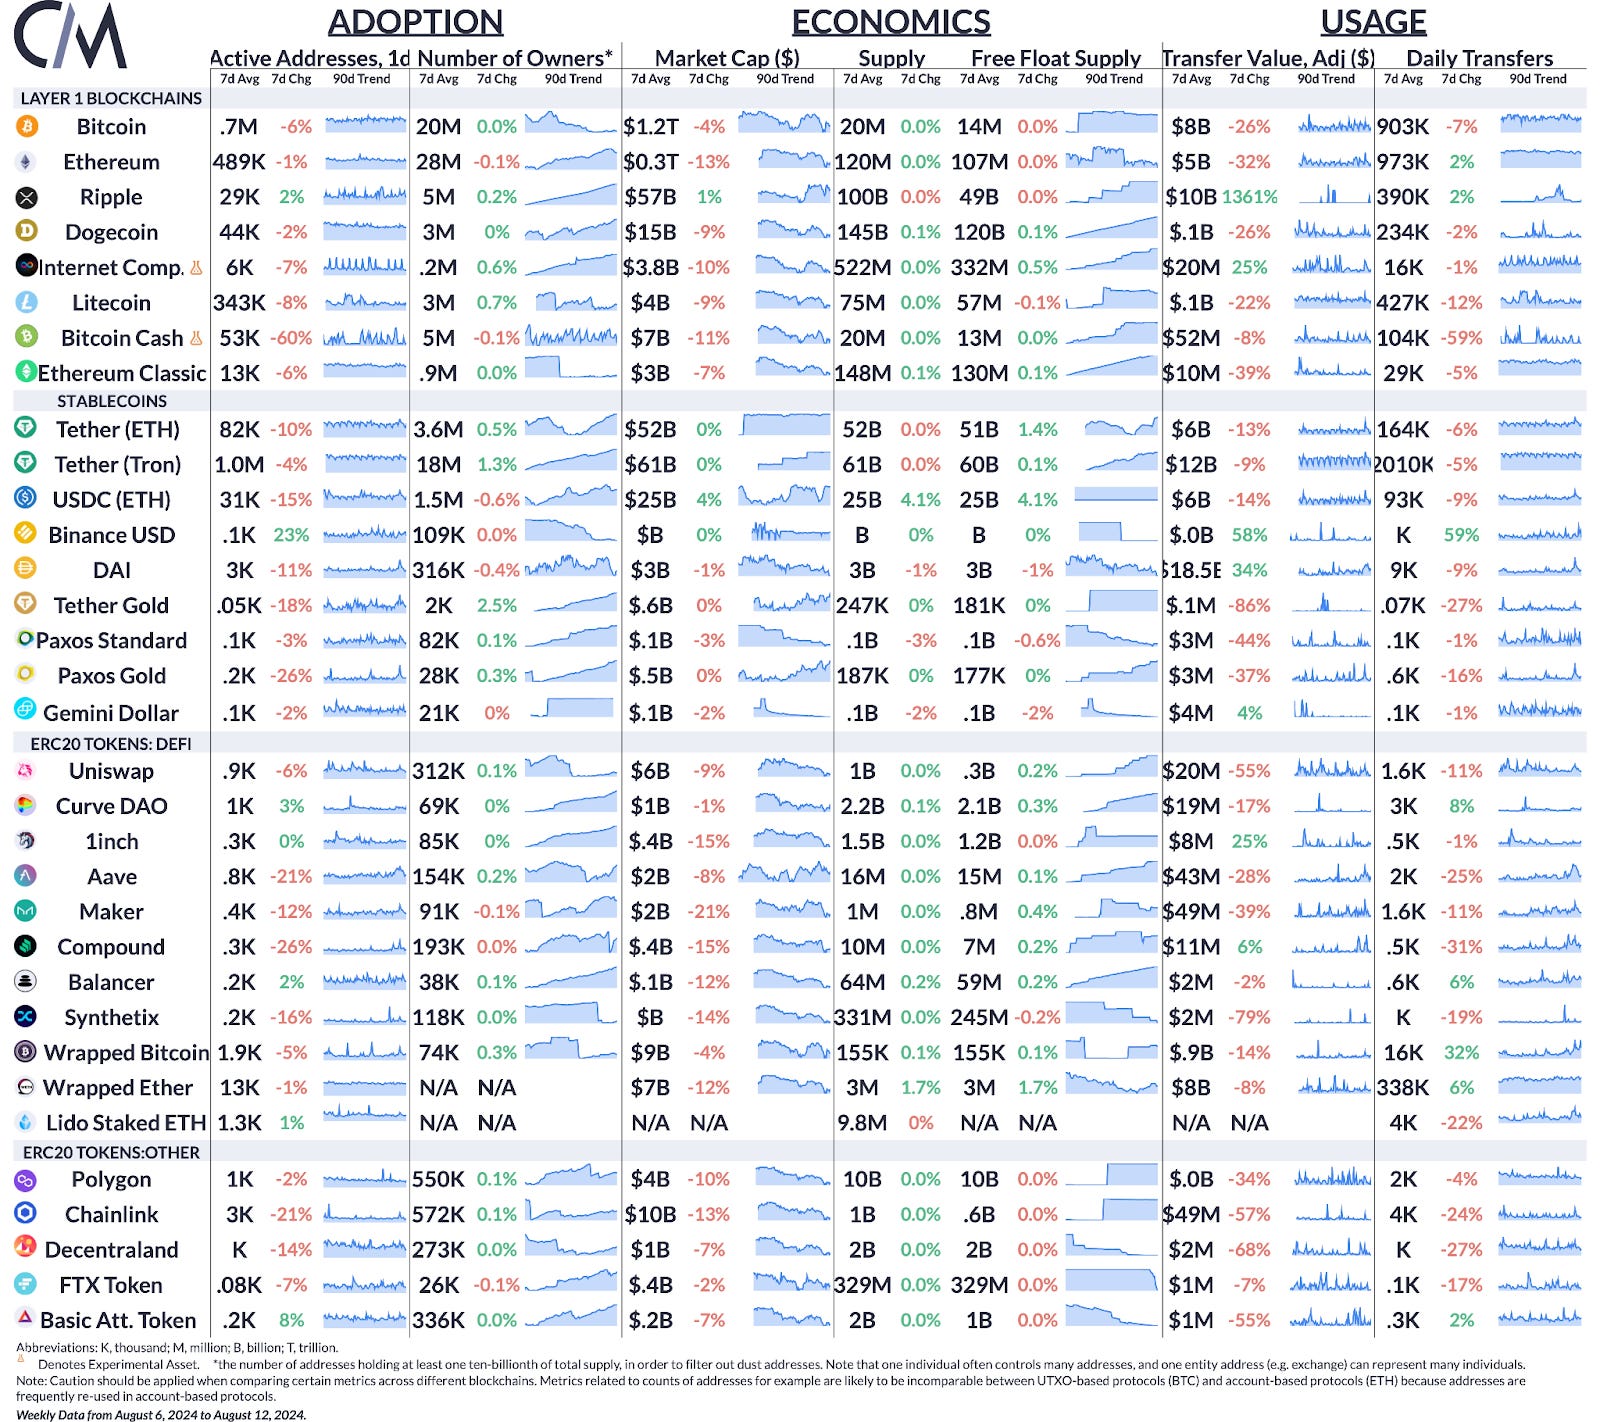
Source: Coin Metrics Network Data Pro
Following a busy weekend trading activity has slowed down, particularly across stablecoins that displayed significant spikes in active addresses and transfer values.
Coin Metrics Updates
This quarter’s updates from the Coin Metrics team:
Follow Coin Metrics’ State of the Market newsletter which contextualizes the week’s crypto market movements with concise commentary, rich visuals, and timely data.
Subscribe and Past Issues
As always, if you have any feedback or requests please let us know here.
Coin Metrics’ State of the Network, is an unbiased, weekly view of the crypto market informed by our own network (on-chain) and market data.
If you'd like to get State of the Network in your inbox, please subscribe here. You can see previous issues of State of the Network here.
© 2024 Coin Metrics Inc. All rights reserved. Redistribution is not permitted without consent. This newsletter does not constitute investment advice and is for informational purposes only and you should not make an investment decision on the basis of this information. The newsletter is provided “as is” and Coin Metrics will not be liable for any loss or damage resulting from information obtained from the newsletter.


