

Large holders of Bitcoin (BTC) have been gradually reducing their holdings since the cryptocurrency hit new highs in March. While this may seem like a bearish signal, there is no need to worry.
These key stakeholders are strategically waiting while the leading coin experiences continued volatility.
Patience of Big Bitcoin Holders
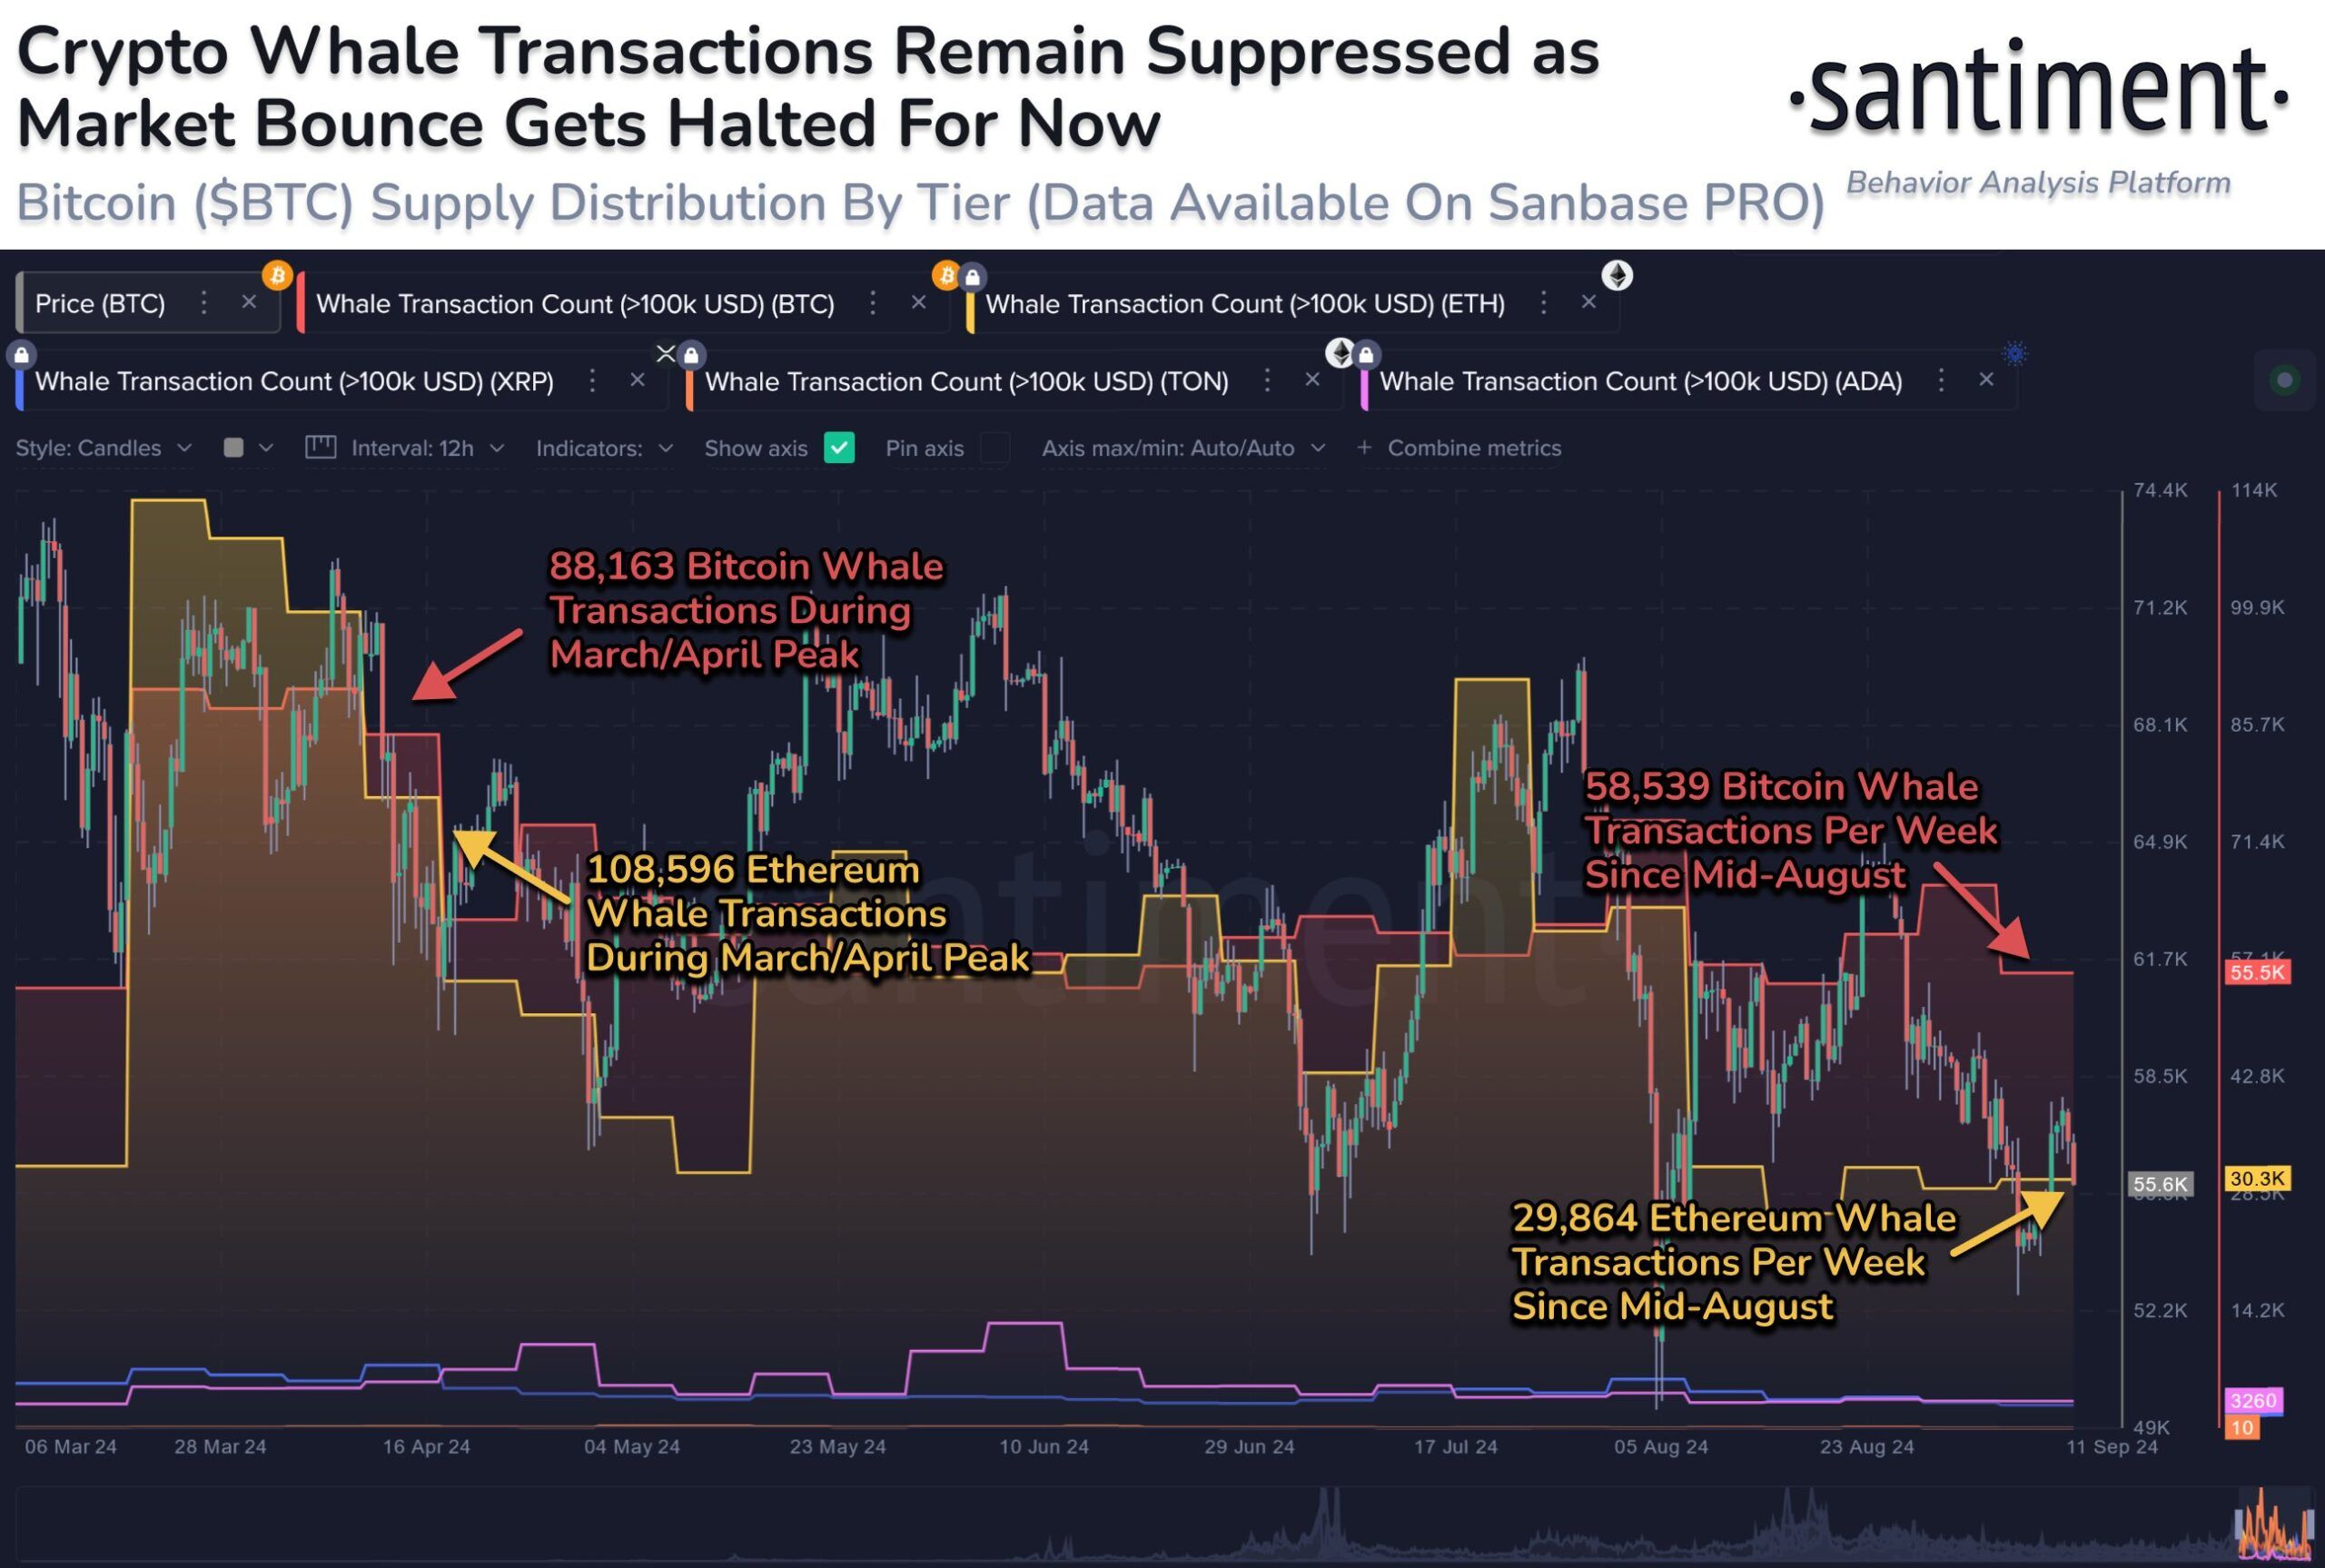
In a September 11 post on X, blockchain analytics platform Santiment noted that there has been a “noticeable decline” in cryptocurrency whale transactions since mid-August. The on-chain data provider noted that BTC whale transactions worth $100,000 or more have fallen 33.6% on a weekly basis since the coin hit a new all-time high in March.
For context, when Bitcoin hit its new all-time high in March, there were 88,163 weekly transactions above $100,000. As the price fell, whales reduced their trading activity. By mid-August, this had dropped to 58,539 weekly Bitcoin whale transactions.
Read more: 5 Platforms to Buy Bitcoin Mining Stocks After the 2024 Halving
While this may seem like a bearish signal to many, data providers point out that this isn’t necessarily the case. Bitcoin whales can be active in both bull and bear markets.
“This suggests that key stakeholders are biding their time, waiting for the next move in times of either extreme greed or extreme fear,” Santiment wrote.
At the time of writing, the overall sentiment in the cryptocurrency market is highlighted as “fearful.” This sentiment is highlighted by the Crypto Fear & Greed Index , and remains so as BTC continues to experience volatility . Some analysts argue that this will be temporary.
“Bitcoin CPI traders are having fun again today. Both sides have been hunted multiple times. Quite a bit of volatility, but we’ve gotten used to it over the past few weeks,” wrote renowned analyst Daan Crypto.
BTC Price Prediction: Price Can Move Both Ways
BeinCrypto’s Bitcoin daily chart analysis is consistent with Daan Crypto Trades’ view on volatility. The gap between Bitcoin’s upper and lower Bollinger Bands has been gradually widening over the past week.
The upper band shows the upper range of price action, while the lower band follows the lower range. A wider gap between these bands indicates increased volatility.
Additionally, Bitcoin’s Bollinger Bands, which help assess market volatility and find breakout opportunities, have also increased in recent days. Higher bands further confirm higher volatility.
Read more: Where to Trade Bitcoin Futures: A Comprehensive Guide
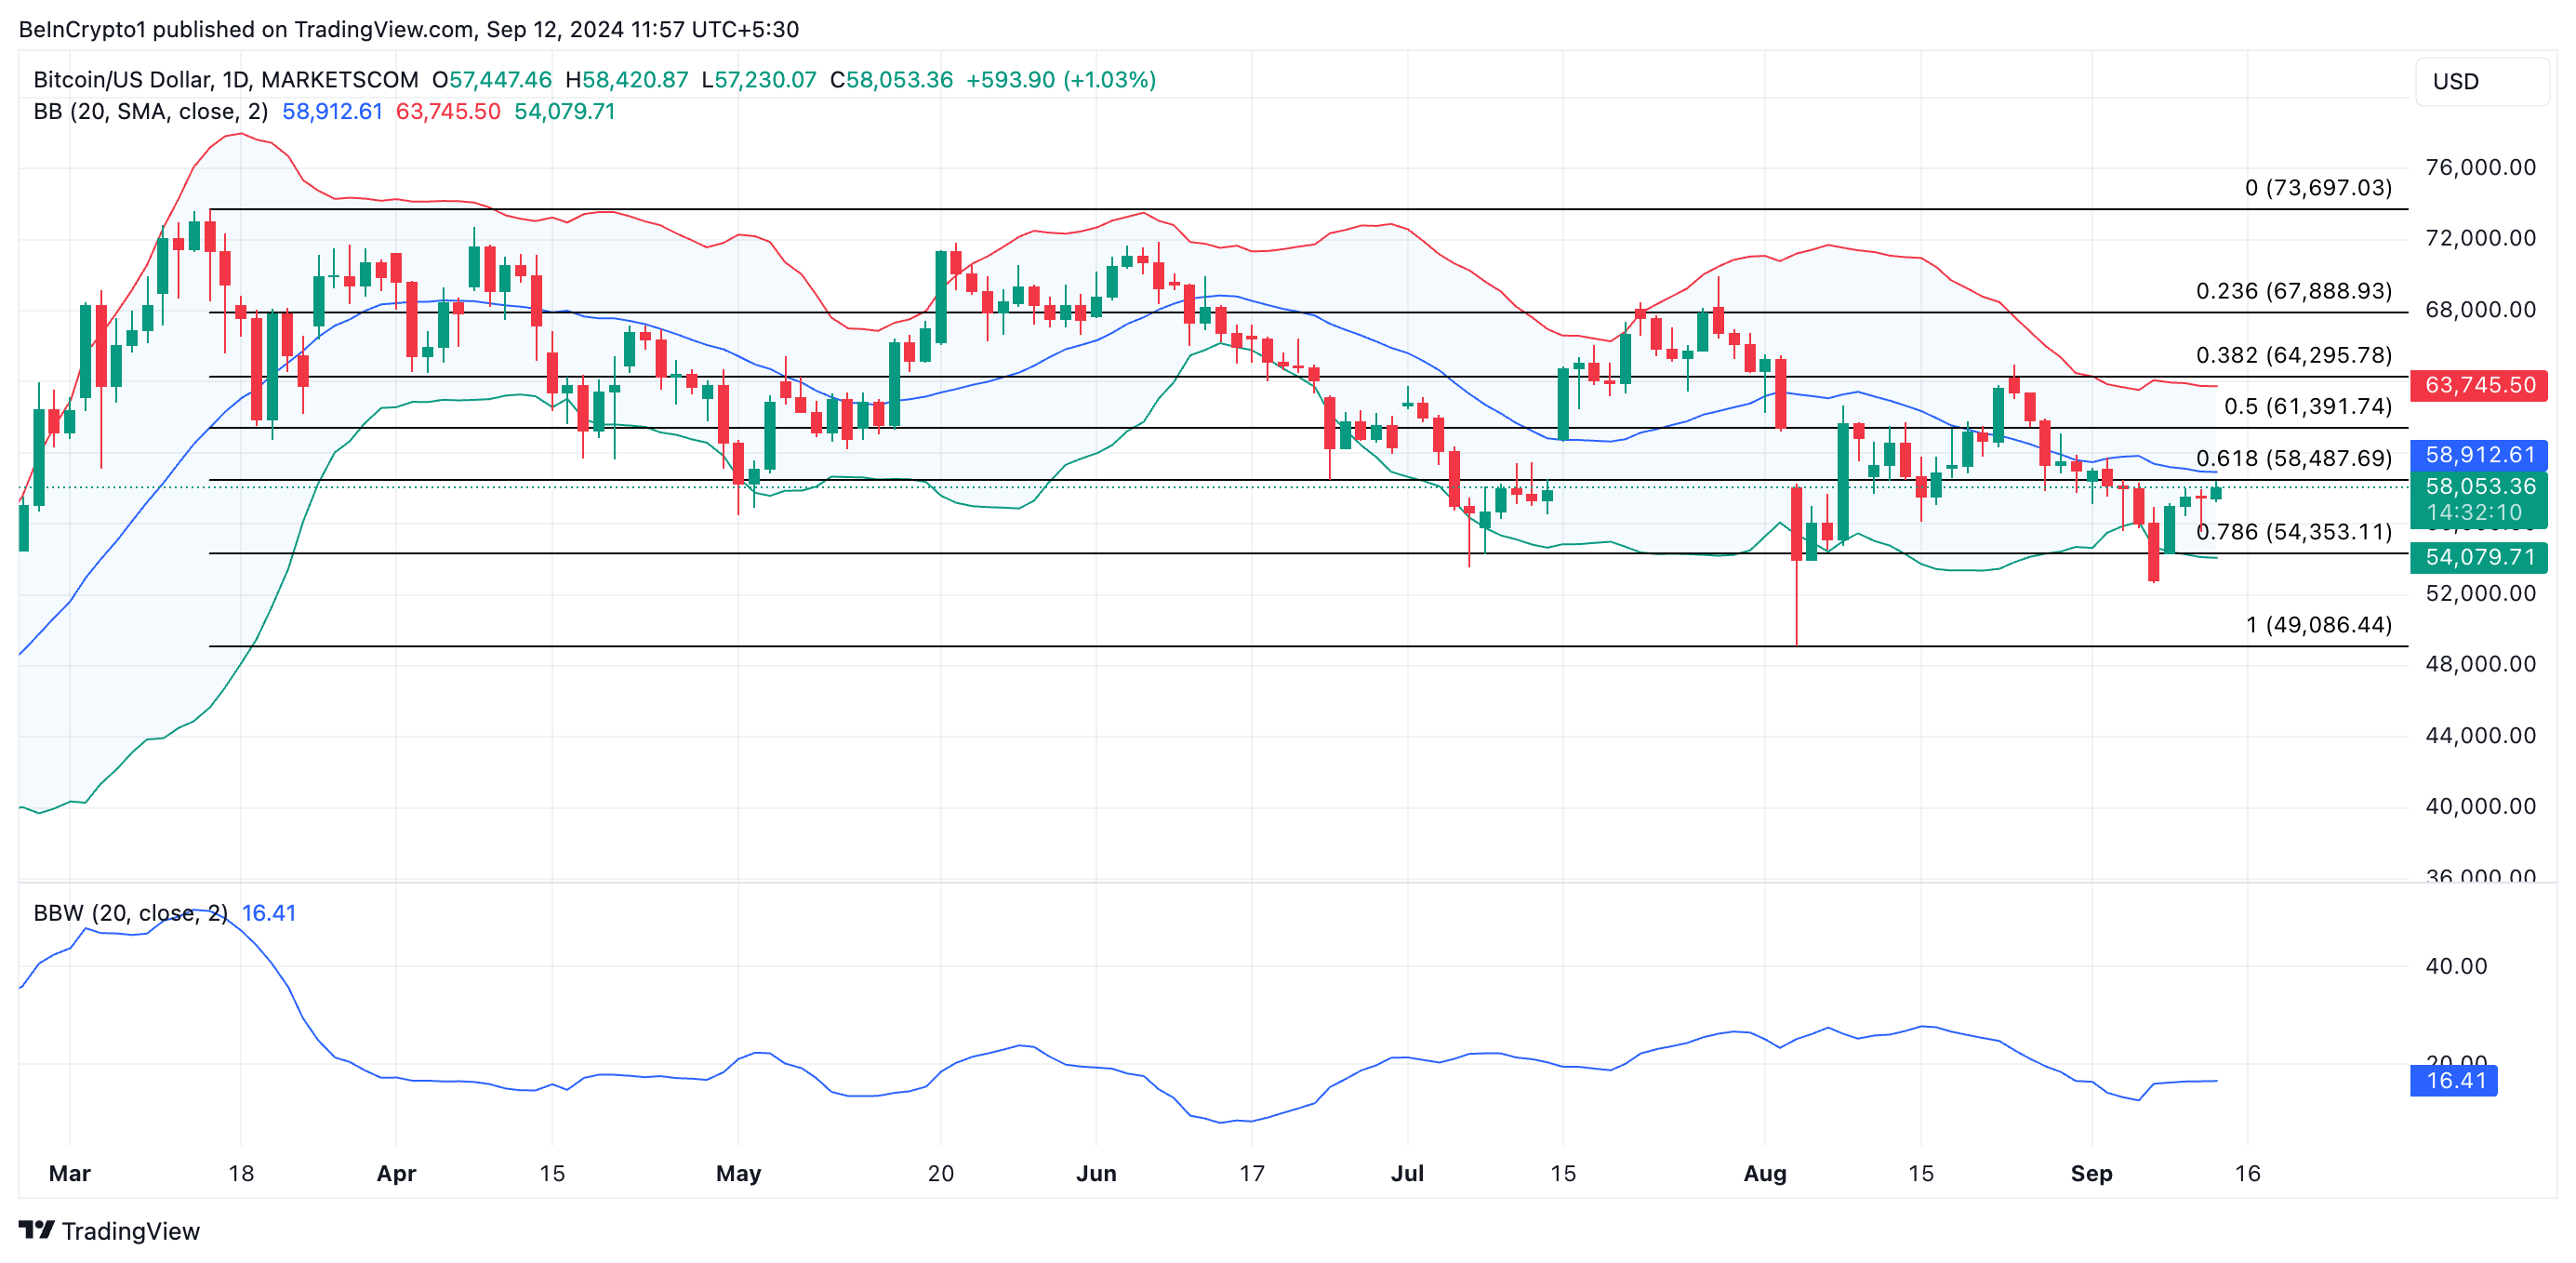
This suggests that Bitcoin’s price could move significantly in both directions . If the price rises, it could break the $61,391 resistance level and target $64,295.
Conversely, if the price declines, Bitcoin could drop below $54,353 and revisit its August 5 low of $49,086.


