Bitcoin velocity measures the speed at which coins circulate in the market. Calculated by Chia the estimated volume over the last year — or the total number of Token transferred — by the current Bitcoin supply, velocity is an important indicator of the level of economic activity on the Bitcoin network. A high velocity indicates that coins are moving more frequently, indicating high transaction activity. Conversely, a low velocity reflects that coins may be being held for a long time, indicating a holding mentality.
Bitcoin's velocity increased significantly in September, after a long period of decline since mid-March. To understand the significance of this increase, it is necessary to XEM both the short-term increase and the long-term downward trend in velocity.
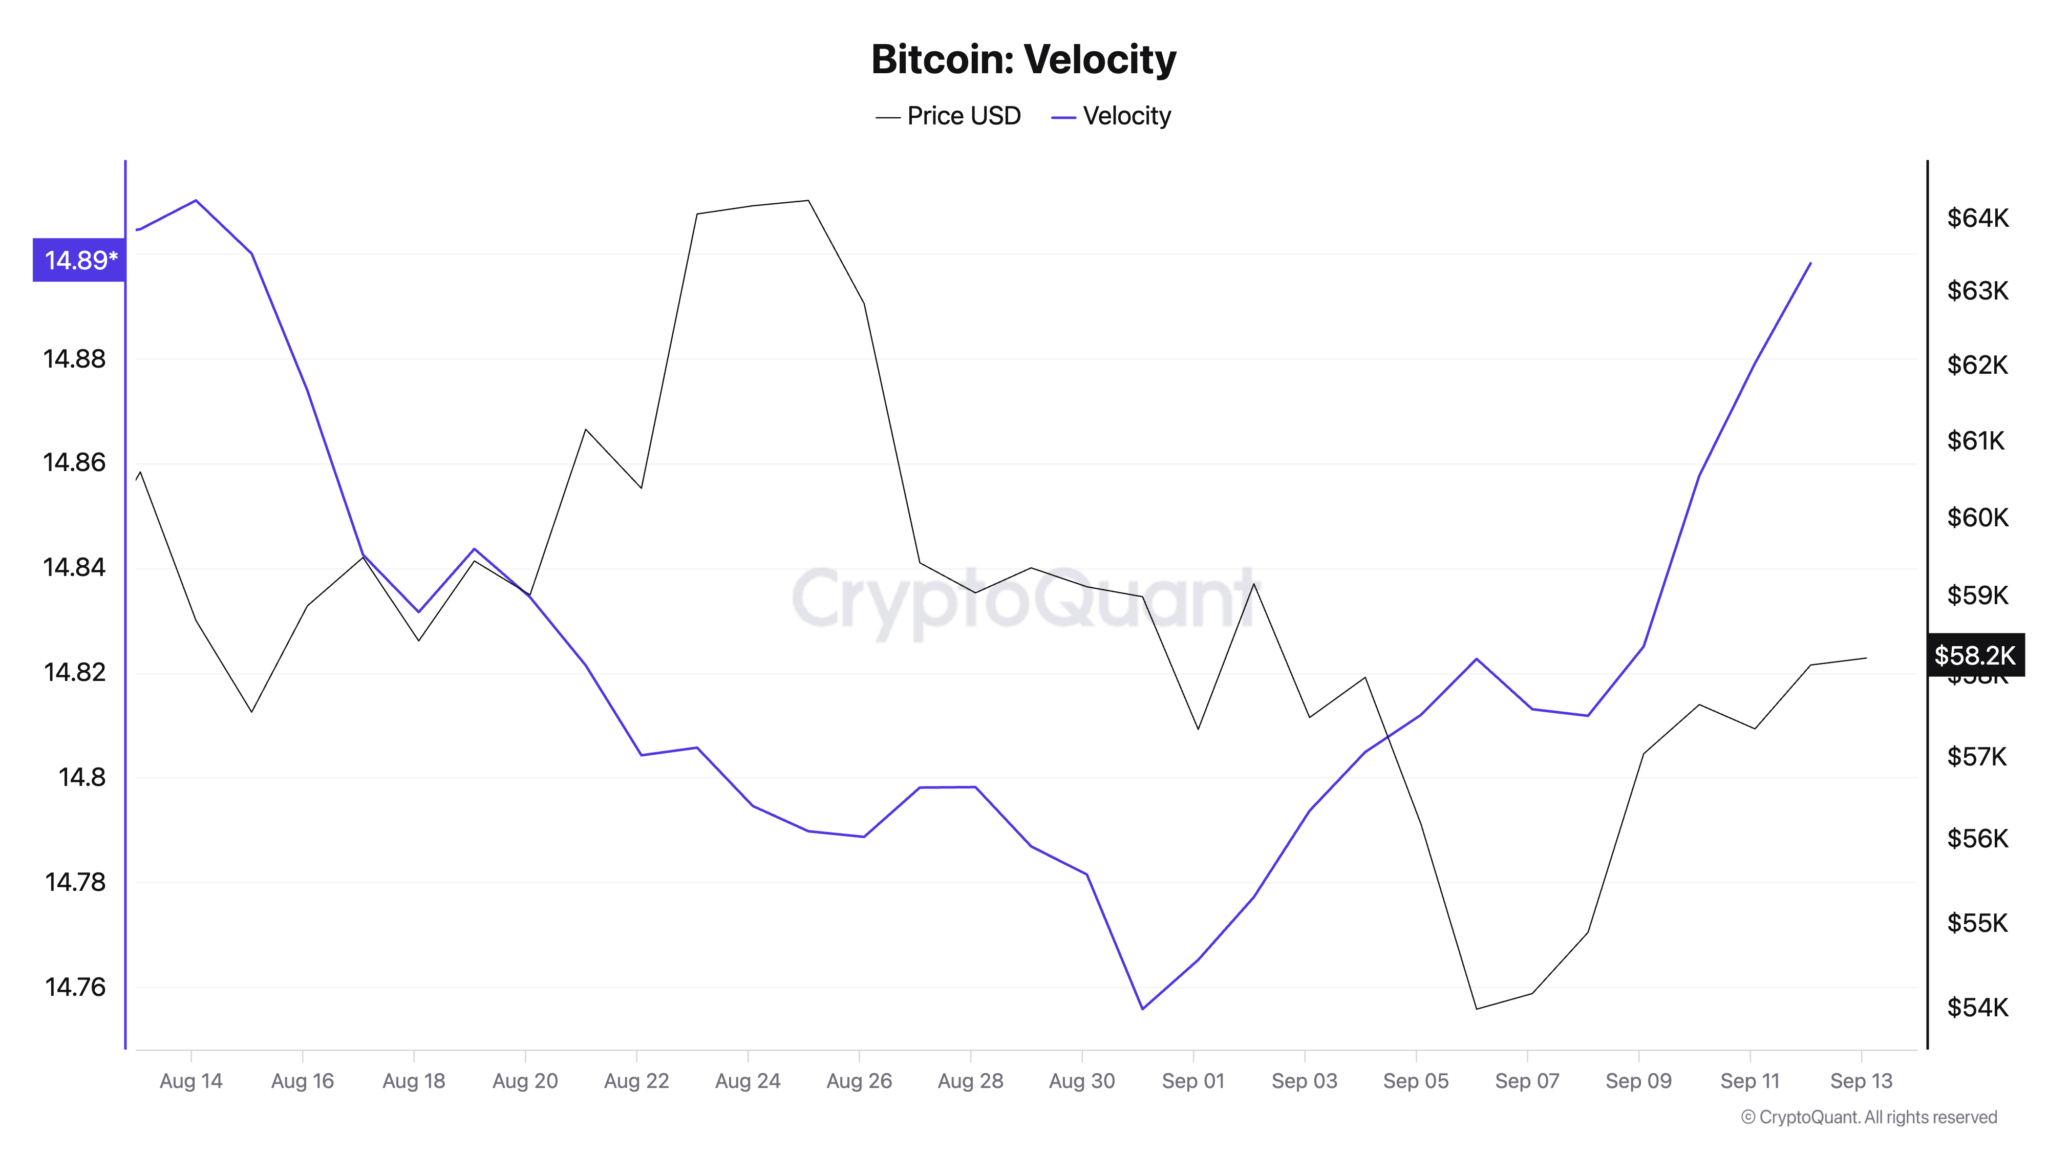
Chart showing Bitcoin's velocity from August 13 to September 13, 2024. Source: CryptoQuant.
Bitcoin’s velocity began to increase in late August 2024, after months of continuous decline. While the increase was not large in absolute terms, it was the first notable increase in months. This could indicate that the market is preparing for more active participation after a period of consolidation.
This increase can be driven by external developments and expectations of further price movements. When prices move significantly, trading activity typically increases as investors look for opportunities to take profits or cut losses, increasing the volume and velocity of trading.
However, this short-term increase is in stark contrast to the overall downward trend. Bitcoin’s velocity has been steadily declining since its peak during the 2013 bull market. Despite some spikes in 2017 and 2021, which were associated with historic price increases, velocity has since fallen back rapidly. This sustained downward trend reflects a significant shift in how Bitcoin is used in the market.
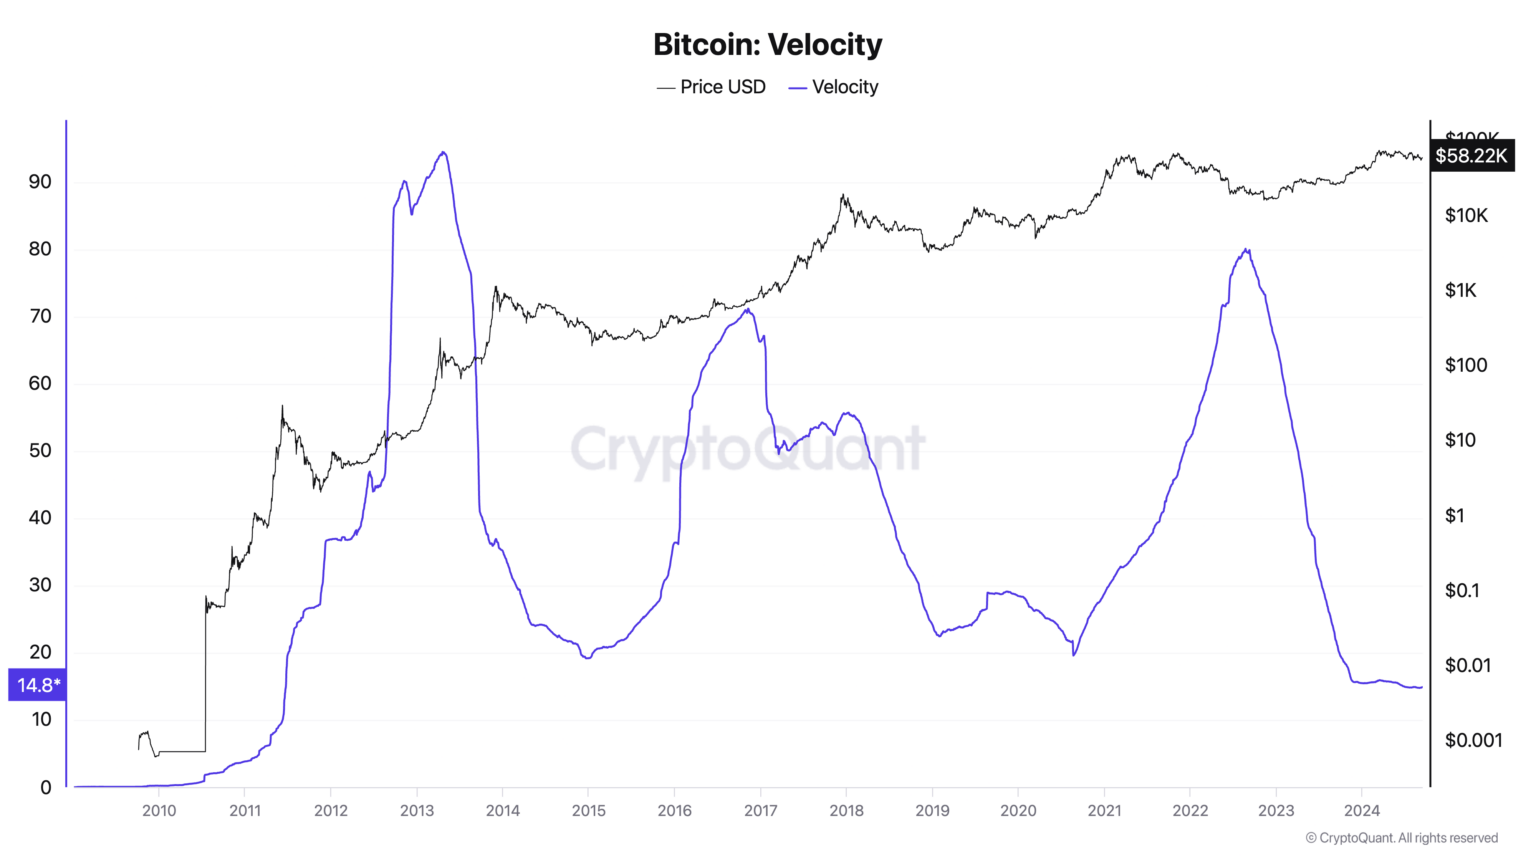
Chart showing Bitcoin velocity from 2009 to 2024. Source: CryptoQuant.
Over time, Bitcoin has become increasingly XEM as a store of value rather than a medium of exchange. Long-term holders often accumulate Bitcoin in anticipation of future increases in value, reducing the need for frequent transactions. As institutional adoption increases, the trend toward long-term accumulation increases.
Large institutions typically make large trades but less frequently, contributing to a slowdown in overall velocity. This will become more evident in 2024 with increased demand from spot Bitcoin ETFs .
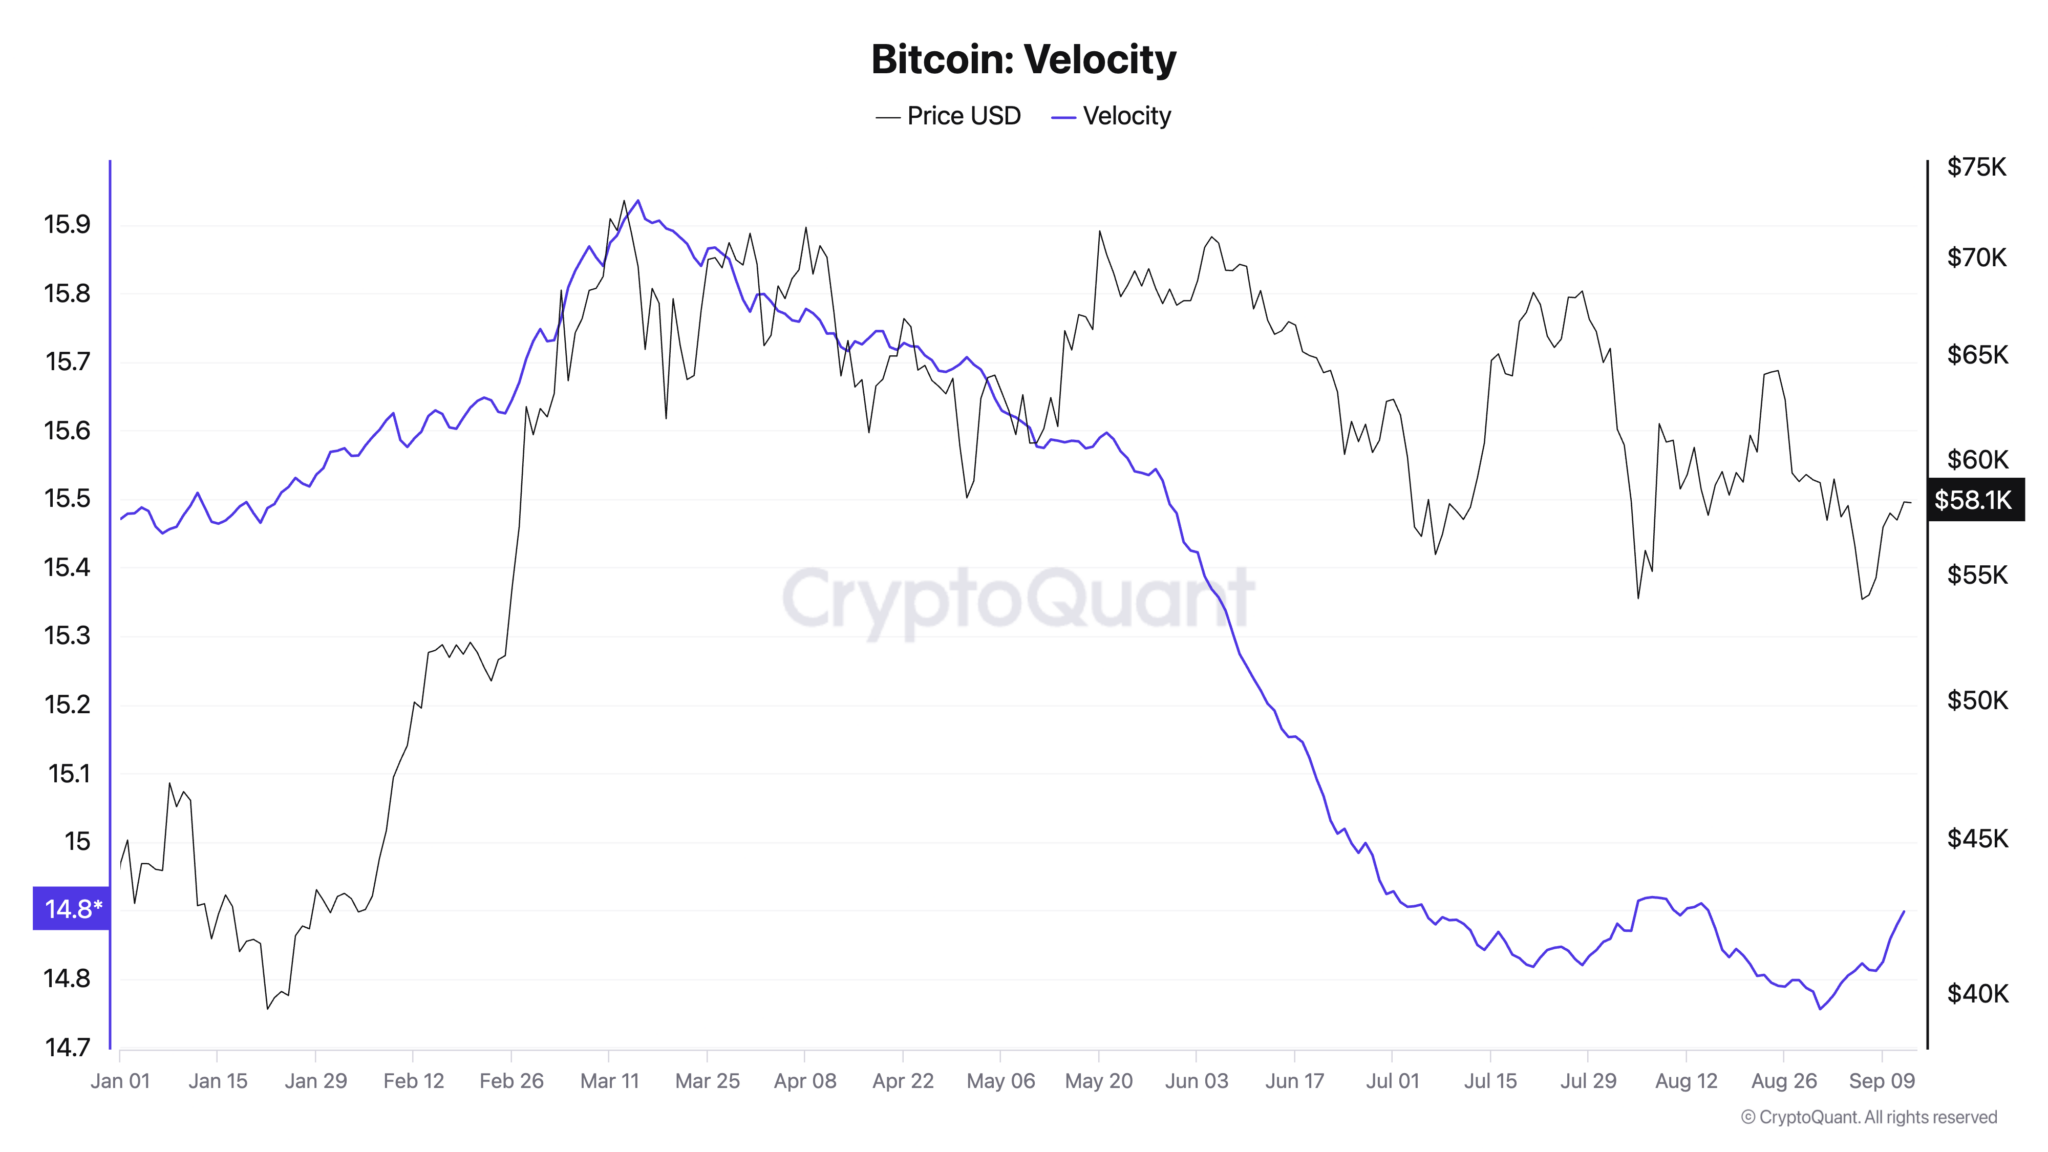
Chart showing Bitcoin velocity from January 1 to September 13, 2024. Source: CryptoQuant.
While the acceleration since early September is notable in the short term, it is not large enough to reverse the overall downward trend in 2024. The market is still dominated by long-term investors and institutional participation, which contributes to the overall decline in velocity.
Unless the recent surge is accompanied by a sustained rally and broader market activity, it is unlikely to lead to a lasting reversal of the downtrend.
Join Telegram: https://t.me/tapchibitcoinvn
Follow Twitter (X): https://twitter.com/tapchibtc_io
Follow Tiktok: https://www.tiktok.com/@tapchibitcoin
Itadori
According to Cryptoslate