

Get the best data-driven crypto insights and analysis every week:
The Crypto Universe Through the Lens of datonomy™
By: Tanay Ved & Matías Andrade
Key Takeaways:
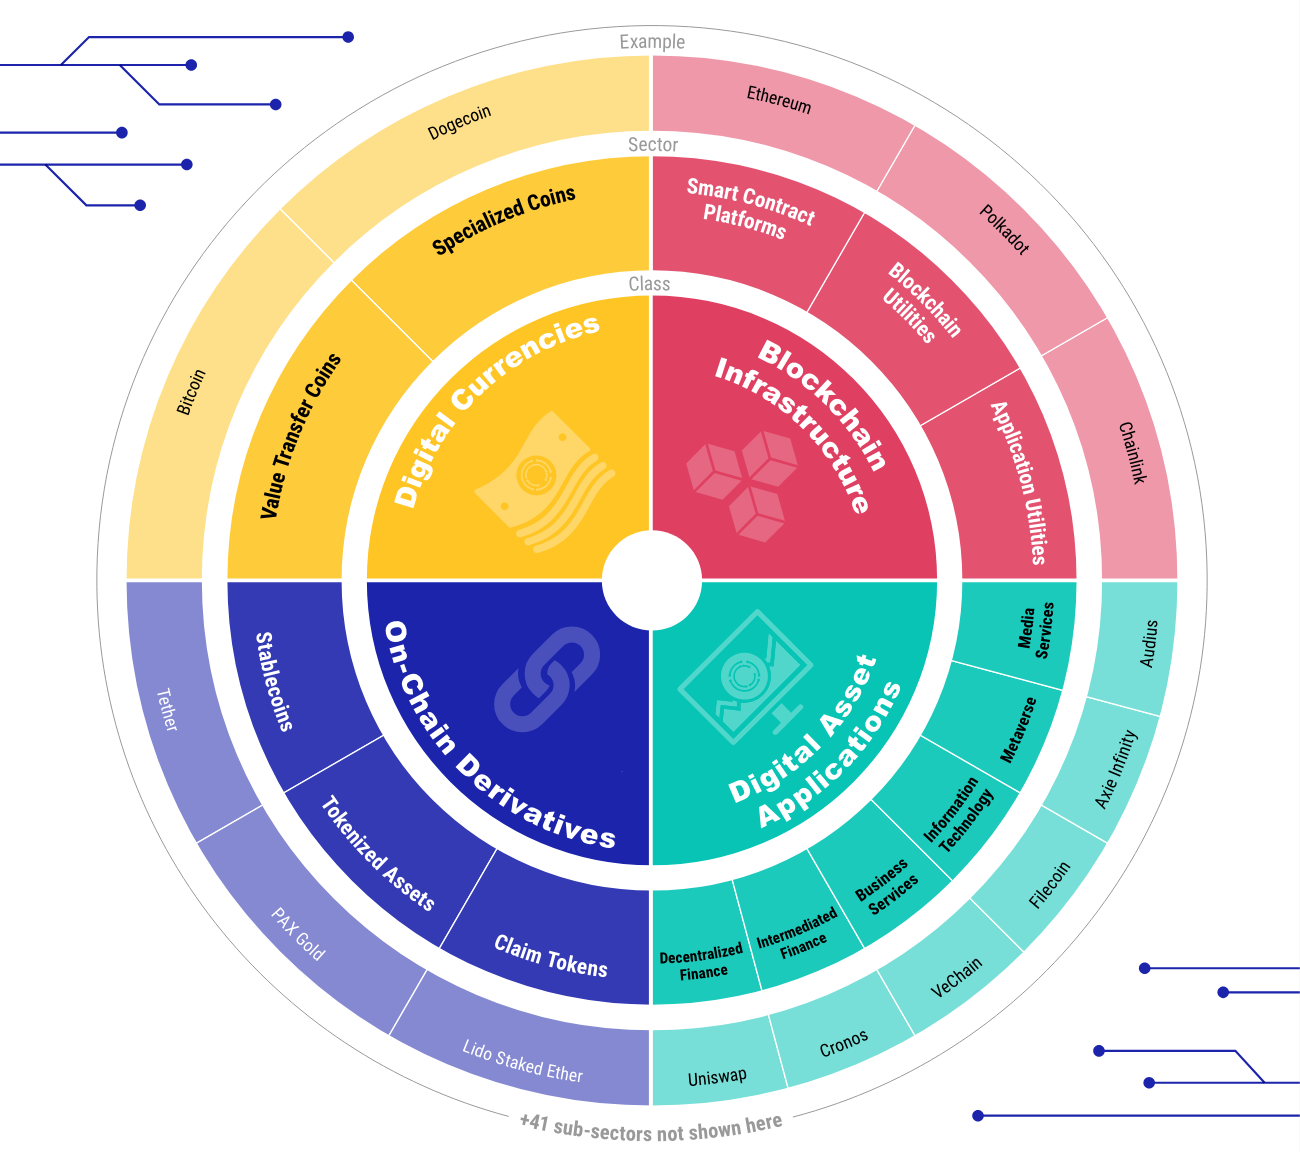
The crypto universe has expanded from a single asset in 2009 to a vast ecosystem of 4 asset classes, 14 sectors and 41 subsectors as covered by datonomy™.
The aggregate market capitalization of assets in the datonomy™ universe stands at $2T today, 2x higher than a year ago.
Combining on-chain metrics with datonomy™ can provide valuable insights into the evolving relationship between fundamental value-drivers and sector returns.
The On-Chain Derivatives asset class, comprising stablecoins and tokenized assets, represents 50% of trusted spot volume across all sectors.
Be sure to check out our datonomy™ dashboard, helping illuminate the vast digital asset universe.
The Evolution of Crypto as an Asset Class
In 2008, the world was introduced to Bitcoin—the first decentralized digital currency and peer-to-peer electronic cash system. Following its then meteoric rise came altcoins like Litecoin, the "silver" to Bitcoin's "gold"; Dogecoin, inspired by the popular “Doge” meme and Ripple, each offering unique capabilities influenced by Bitcoin’s foundation.
However, there existed a void in the ability to support more versatile and programmable transactions. This gap was bridged with the launch of Ethereum, broadening the scope of what blockchains could achieve via smart-contracts and on-chain applications. Several other Layer-1s emerged, each with its own optimizations and tradeoffs—from high-throughput chains like Solana to customizable architectures like Cosmos and Avalanche. Since then, we’ve witnessed an explosion of use-cases and tokens in the ecosystem, from tokenized assets and Layer-2 scalability solutions to oracle and application-based governance tokens and numerous more. The inception of a single concept has now flourished into a vast and complex universe.
But how do investors, operators or market-watchers make sense of this rapidly evolving landscape? In this issue of Coin Metrics’ State of the Network, we provide an update on crypto-asset valuations, sector performance and volumes leveraging datonomy™, a classification system for the digital asset ecosystem.
datonomy™: A Digital Assets Taxonomy
An ecosystem with constantly growing complexity requires simplification. This is where datonomy™ comes in, bringing tremendous value by classifying assets into 4 classes, 14 sectors and 41 subsectors based on their economic context of use. This allows investors to discern “Smart Contract Platforms” from “Digital Currencies”, and “Tokenized Assets” from “Decentralized Finance” providing a transparent framework to build portfolios, manage risk or understand trends shaping the market.
For instance, dividing the digital asset ecosystem into four major asset classes allows a better understanding of the relative market size of the industry and how it has evolved over time. As one of the first-use cases, the Digital Currencies class remains the largest, comprising 57% of total market capitalization, while Blockchain Infrastructure, composed of smart contract platforms, and utilities like scalability and interoperability solutions has been steadily growing, holding a 31% market share. With a ~4% share Digital Asset Applications still remain relatively small in size, presenting a tremendous opportunity for the next wave of growth underpinned by public blockchain infrastructure and tokenized assets.
In aggregate, the market capitalization of assets covered in the datonomy™ universe currently stands at $2T, growing by 100% since September 2023.
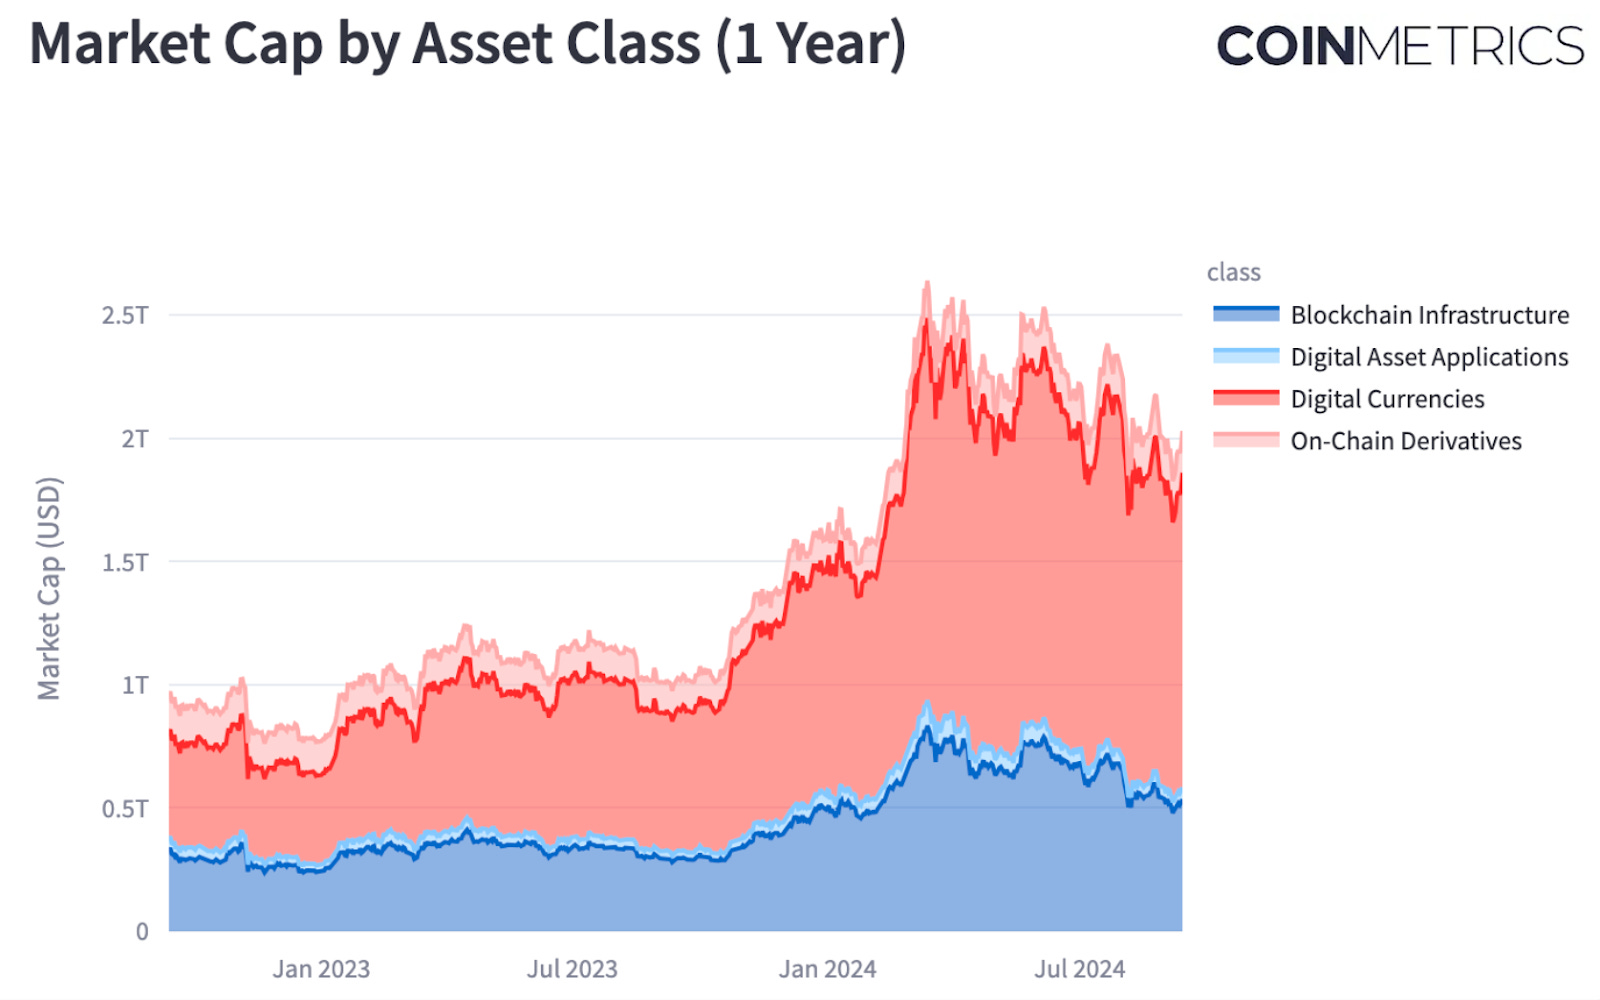
Source: Coin Metrics datonomy™ Dashboard
Sector Returns & Performance
Breaking the cryptocurrency market into sectors enables participants to identify trends, optimize portfolios, and assess risk across diverse segments of the industry. Much like how traditional equity investors analyze "Consumer Discretionary" or "Financials" sectors, cryptocurrency investors can gauge the performance of specific sectors such as Decentralized Finance and compare it to the broader market. This sectoral approach provides valuable insights into market dynamics and the strength of prevalent narratives, enabling targeted investment strategies, informed around the nuanced risks and opportunities within the cryptocurrency ecosystem.
How have sectors performed over the long term?
Over a longer time-horizon, despite large swings and variability in performance across sectors, the Coin Metrics Total Market Index (CMBITM) has provided 690% in cumulative returns. Among this, the Intermediated Finance (+1948%), Business Services (+1734%) and Information Technology (+1681%) sectors of the Digital Asset Applications asset class have outperformed the remaining market. Driven by the surge in interest around the “Metaverse” theme 2021 on the back of Facebook’s rebrand to Meta, the Metaverse sector (tokens associated with virtual ecosystems) displayed the strongest performance. However, this was short-lived as lackluster adoption and Meta's struggle to translate its efforts into substantial revenues led to waning investor enthusiasm.
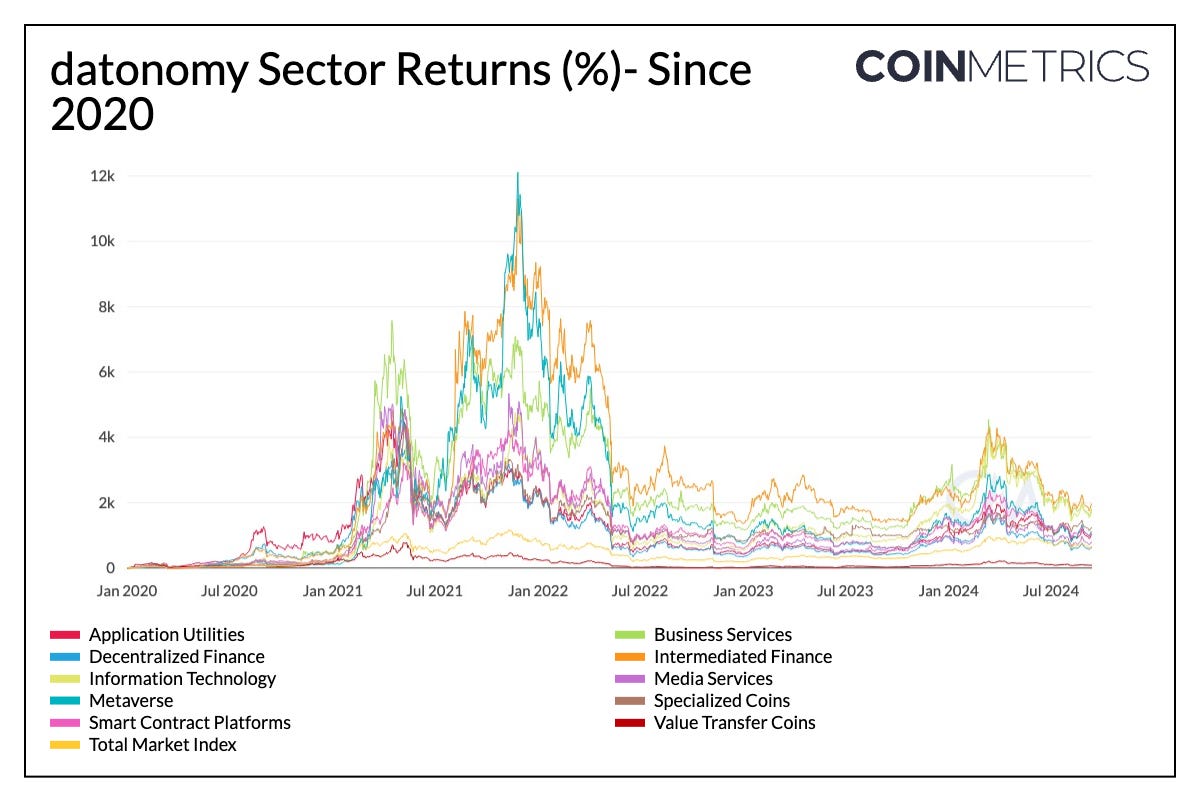
Source: Coin Metrics datonomy™
Which sectors are showing short-term strength?
It’s also valuable to decipher pockets of the market that show immediate strength post sudden market downturns or sectors that show weakness as market rallies cool down, when viewed from a short-term lens. The market volatility around the August 5th market crash resulted in a steep decline across all sectors. The Specialized Coins sector experienced the quickest rebound, and remains the best performing sector YTD with a 6% gain. The Metaverse theme rebounded to 15%, the highest among all sectors before receding alongside the market.
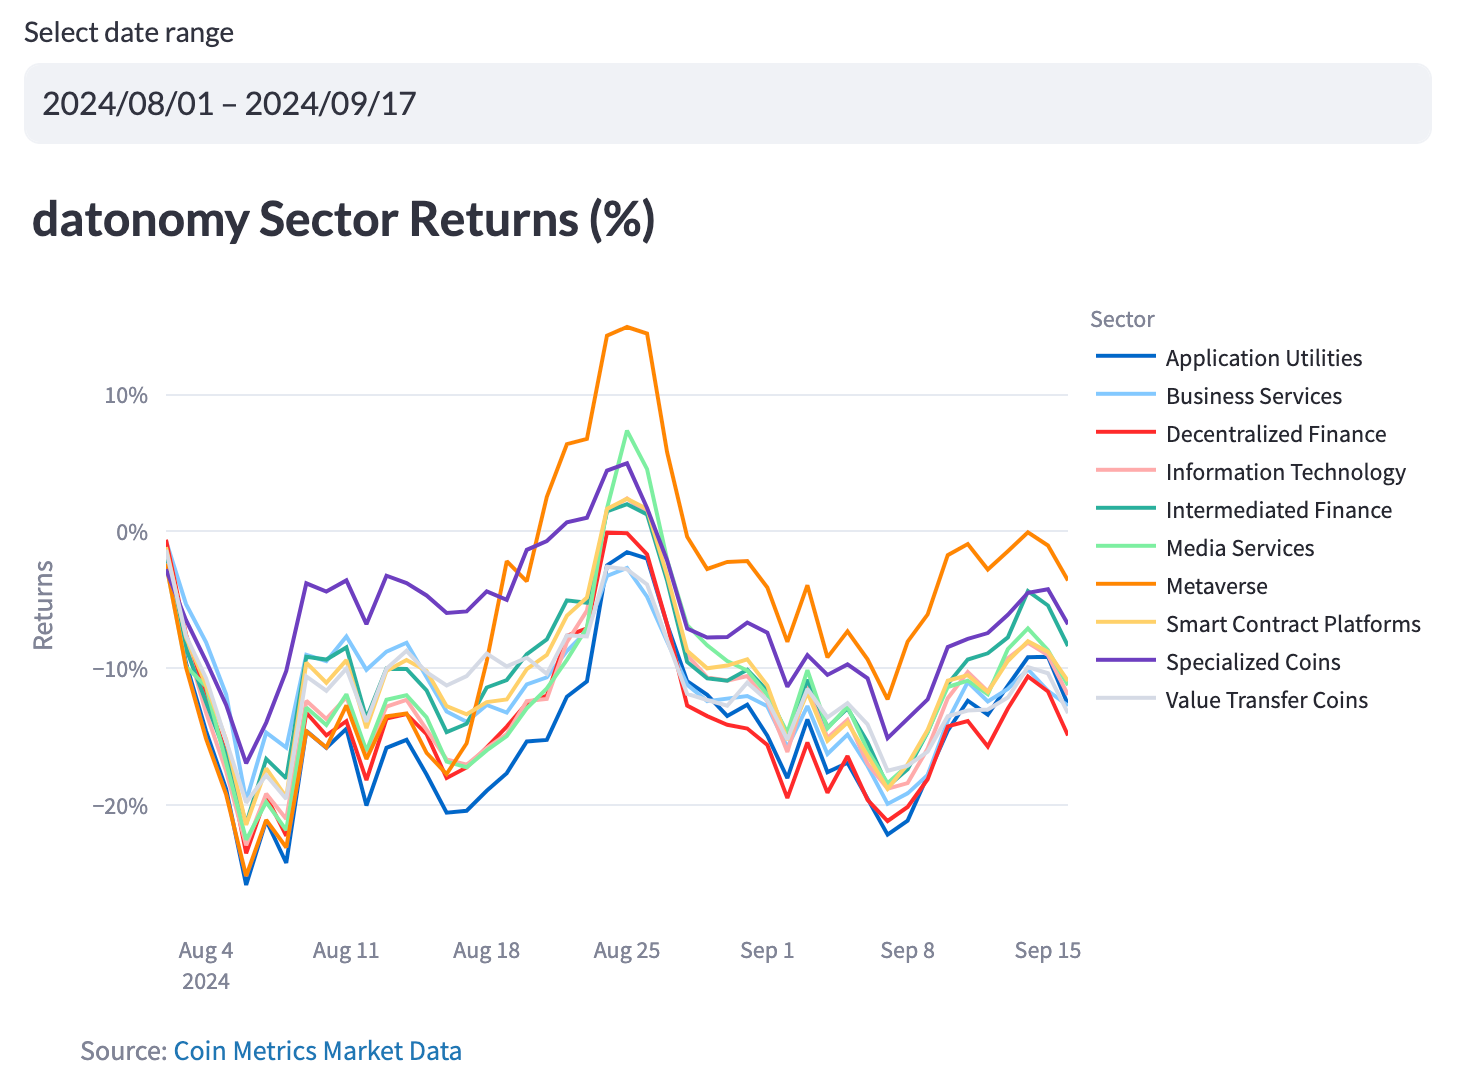
Source: Coin Metrics datonomy™ Dashboard
It’s also important to understand the unique volatility profiles and correlations in sector performance as they help inform investors around portfolio construction, reducing overall risk.
Correlation of On-Chain Metrics With Sector Returns
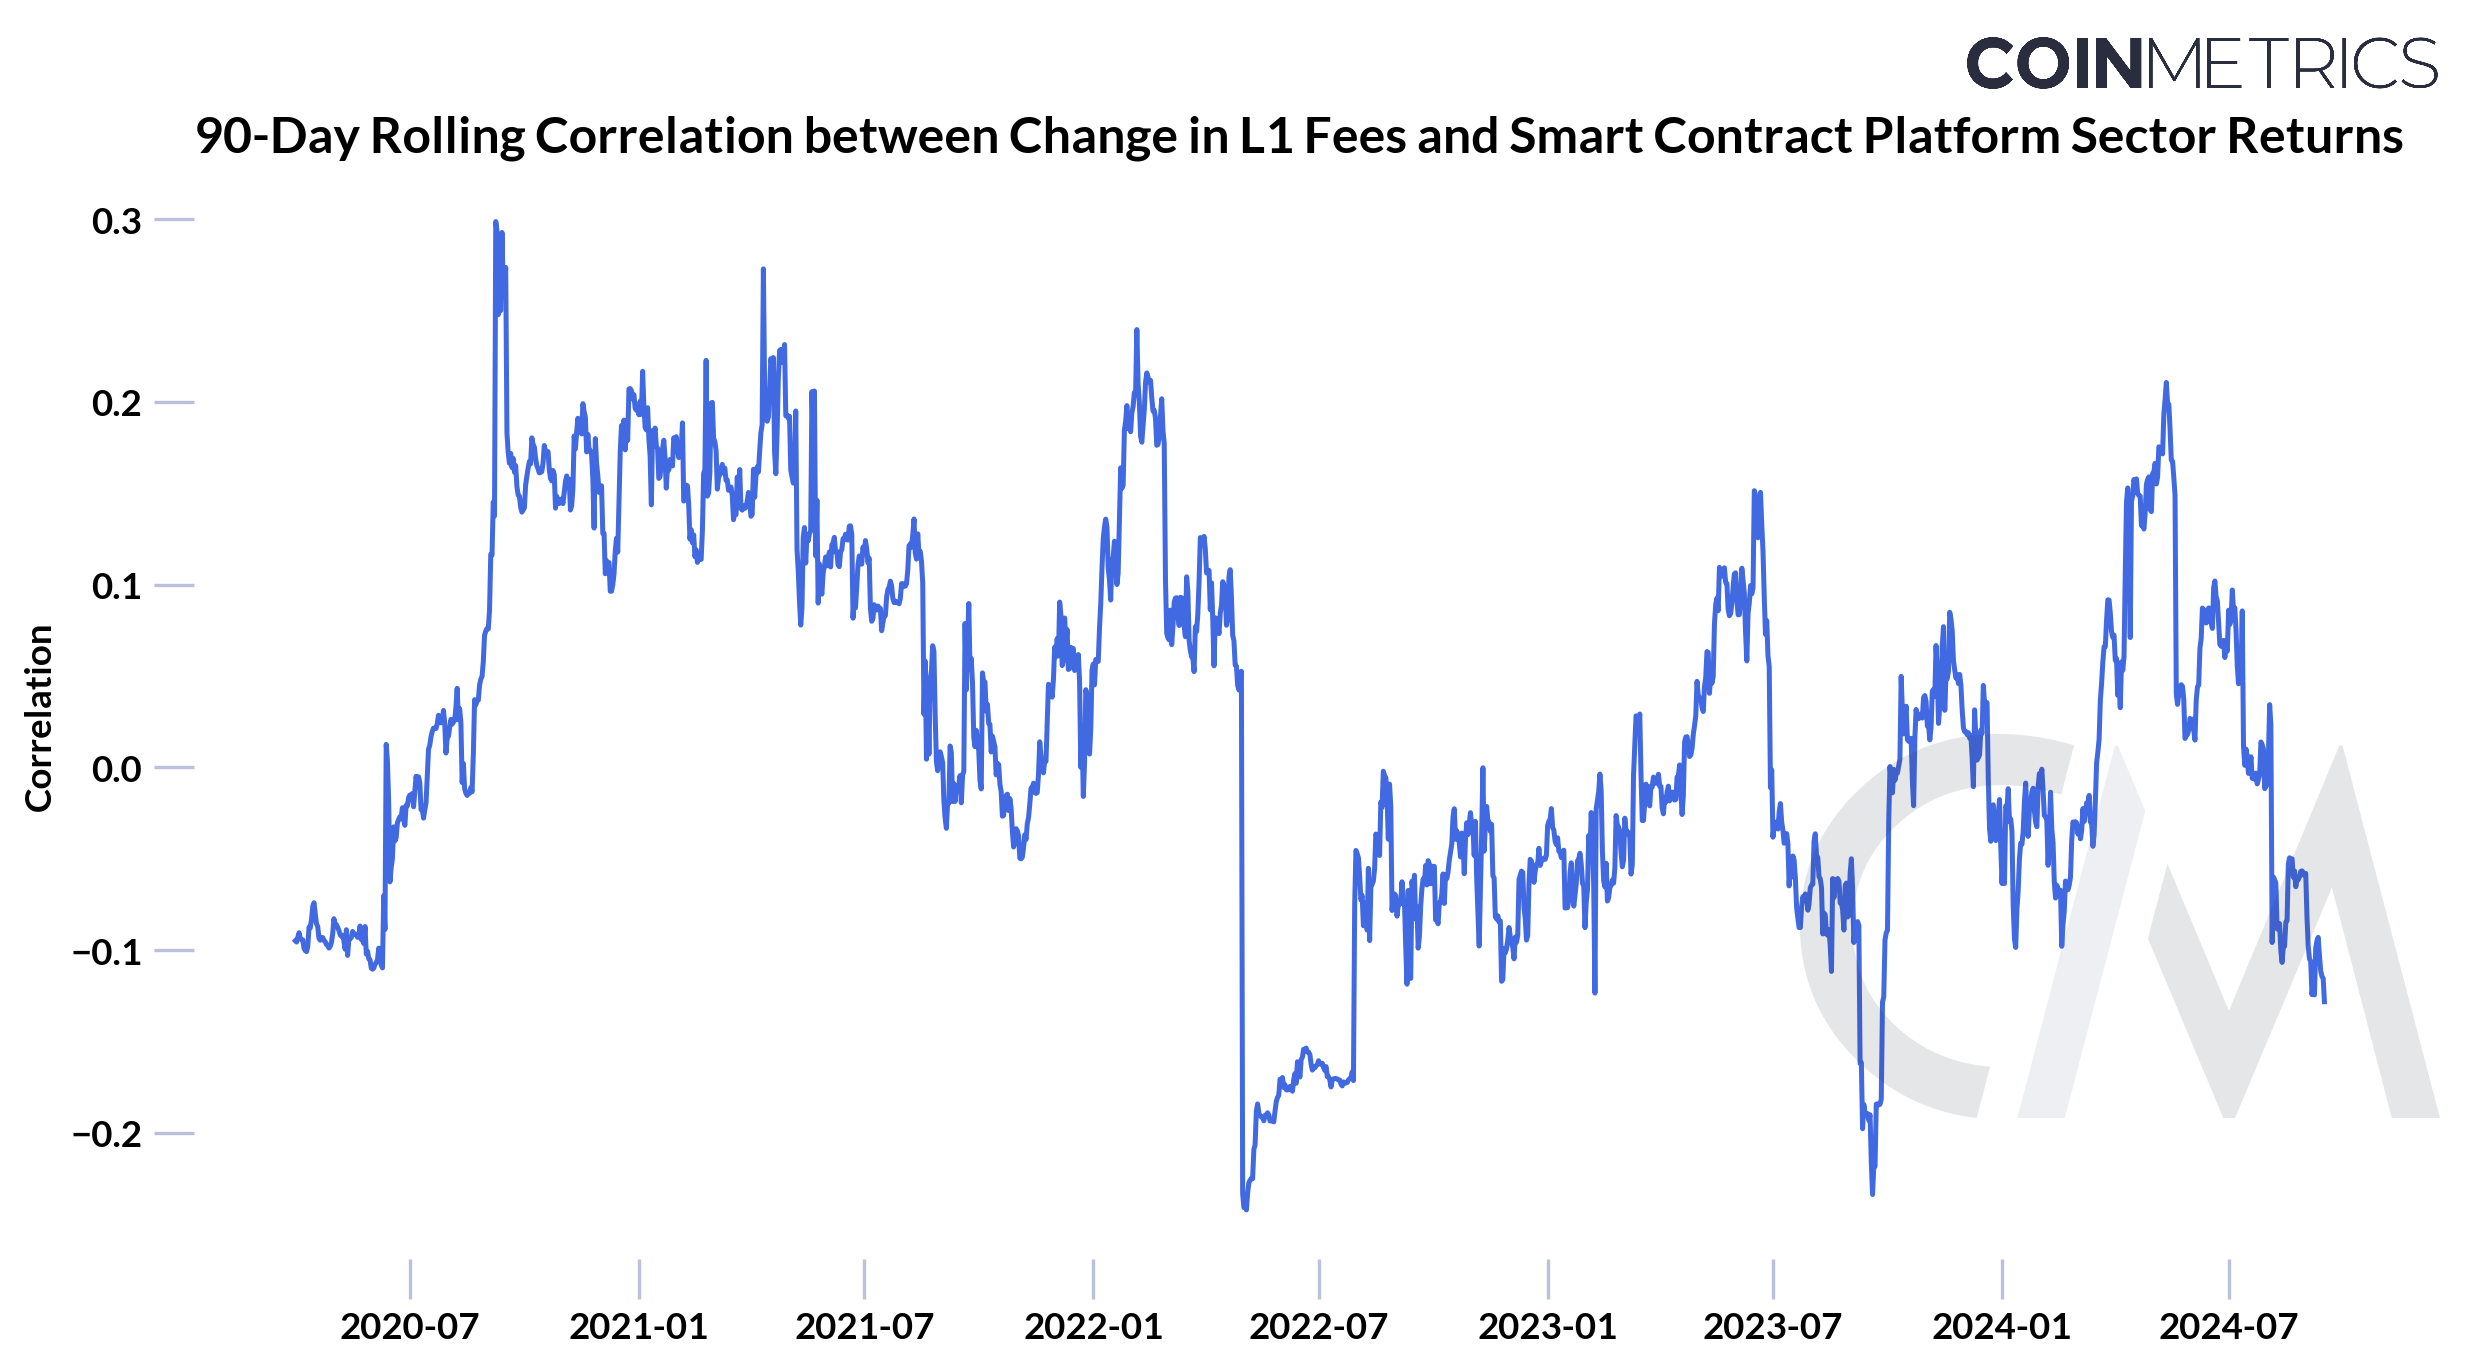
We can also discern the evolving relationship between on-chain fundamental metrics such as changes in fees on Layer-1 networks or volumes on decentralized exchanges (DEXs) in comparison to the Smart Contract Platform or DeFi sectors’ returns.
Source: Coin Metrics Network Data Pro, datonomy™
The 90D rolling correlation between change in L1 fees and Smart Contract Platform sector returns shows substantial cyclicality during different phases of the market, ranging between -0.25 to 0.3. Moderately positive correlations during periods suggest that rising network fees are likely a sign of increased demand for blockspace and transaction execution which aligns with rising prices in the smart contract sector (or vice versa). Boosts in fee markets have been observed in the past, with some occurring alongside broader market rises while others occur in isolation due to network specific events, like the launch of Runes, for example.
Source: Coin Metrics Network Data Pro, datonomy™
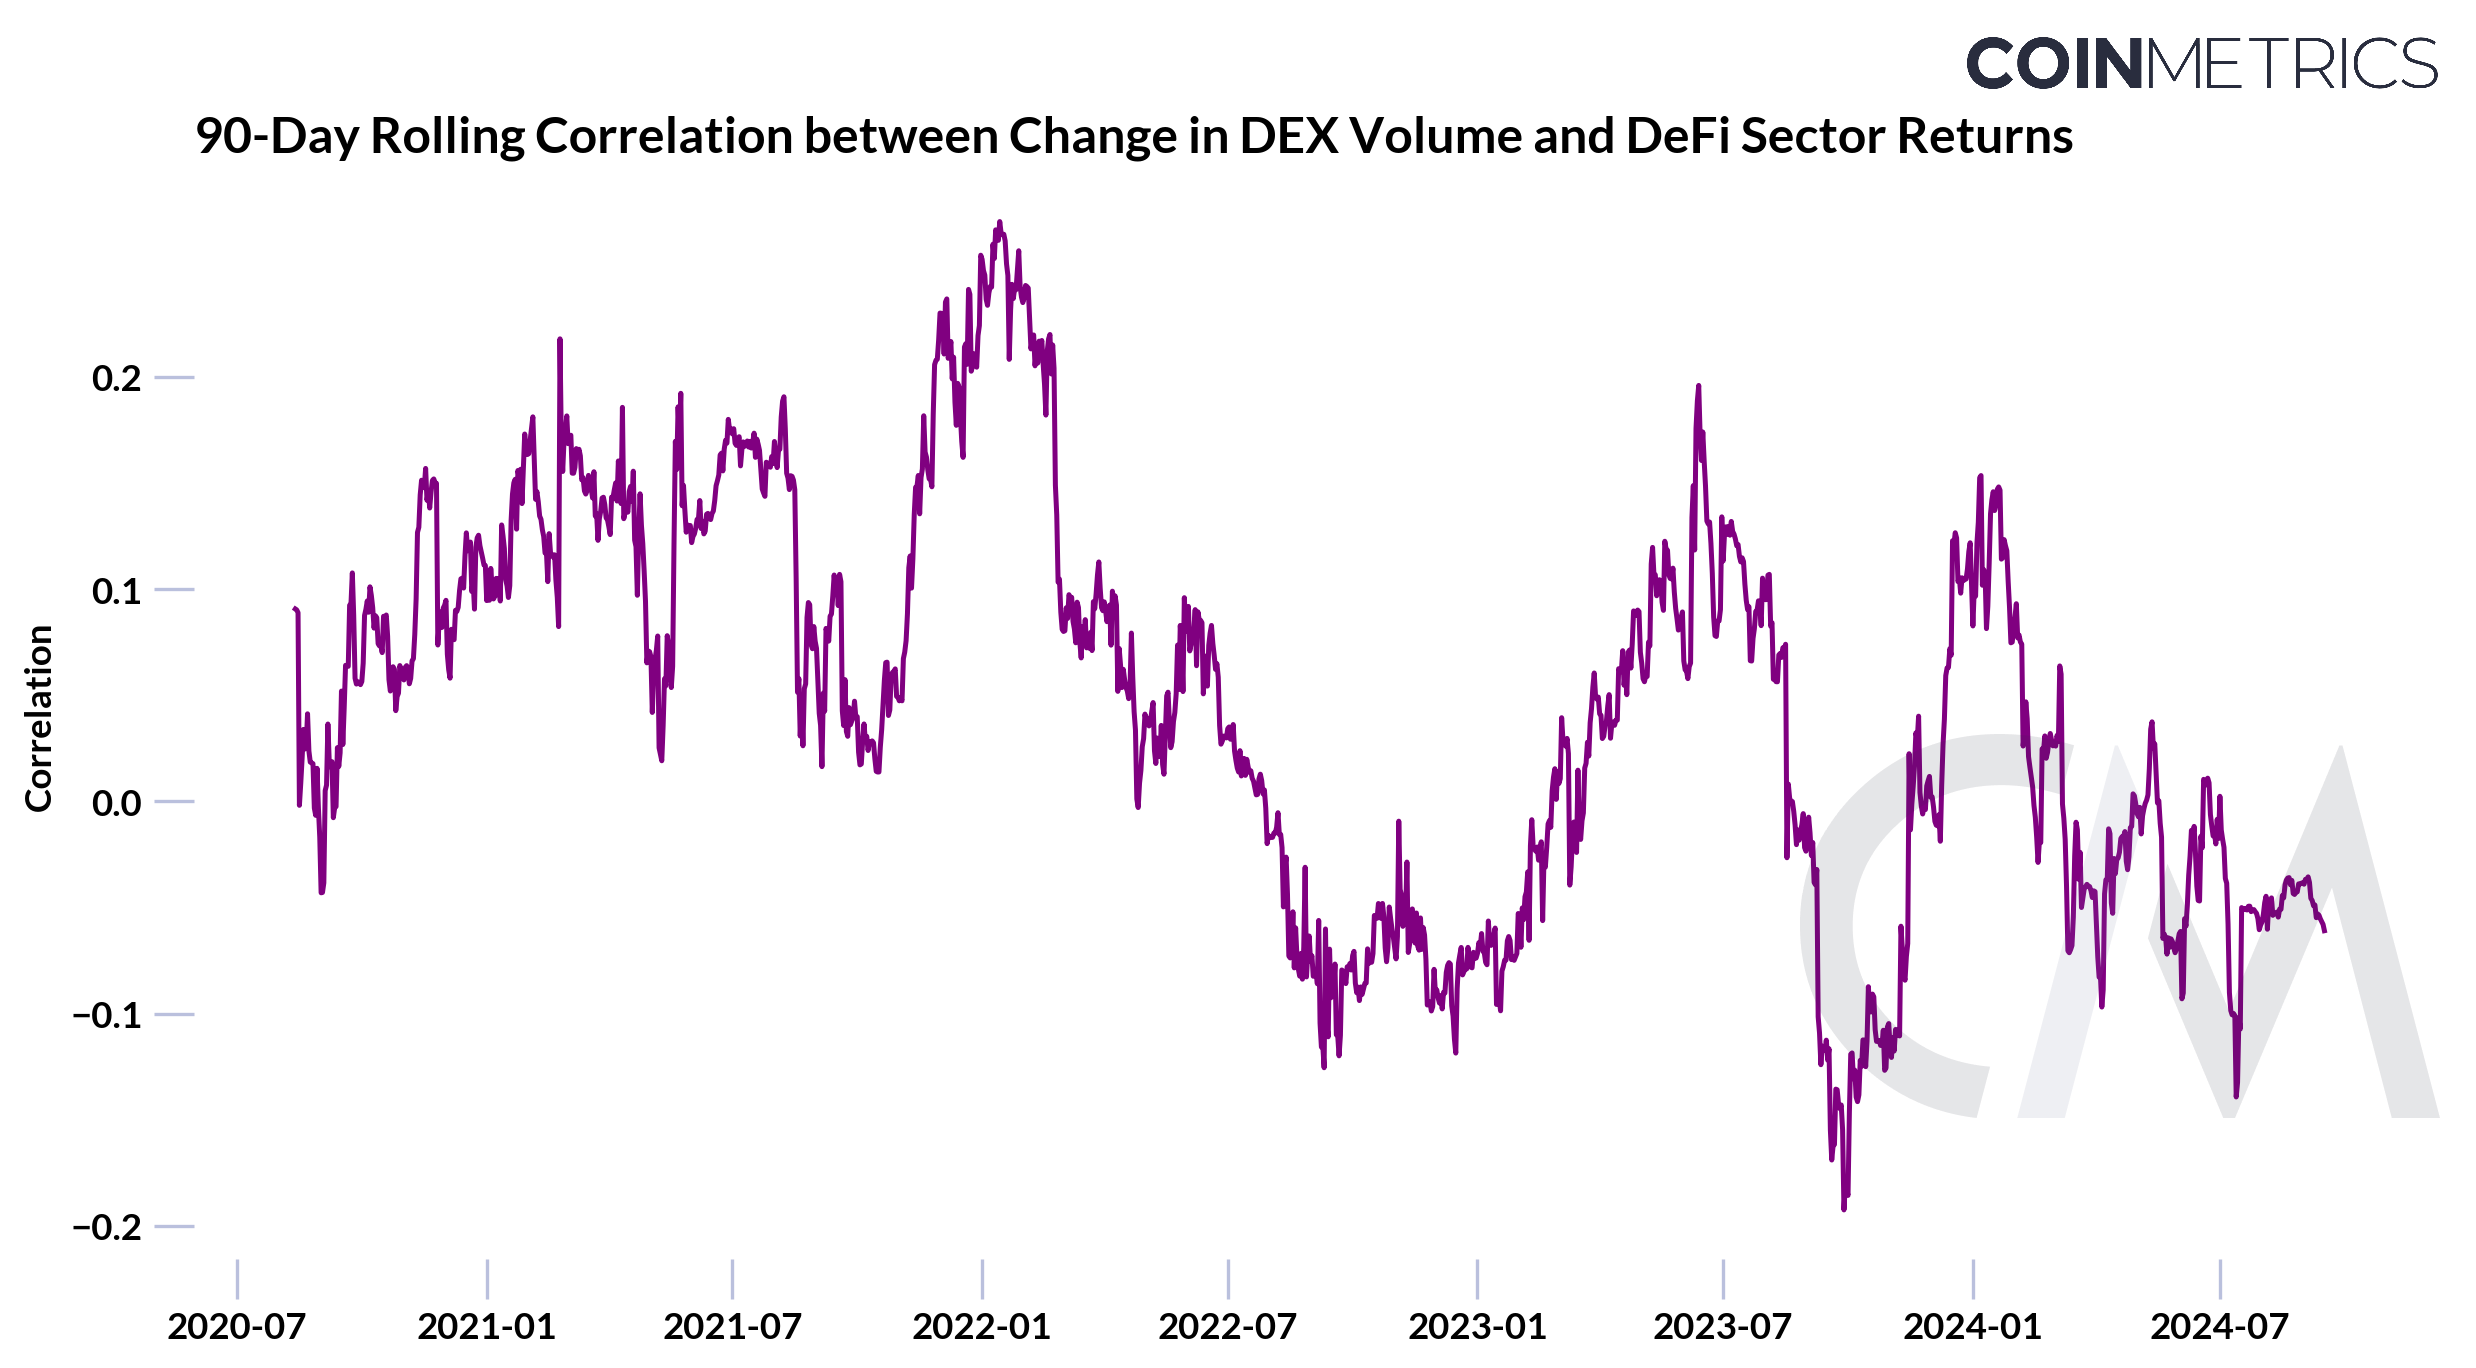
Changes in trading volume across major DEXs like Uniswap and Curve demonstrate a dynamic relationship with DeFi sector returns. Periods of positive correlation (~0.25) often indicate increased user participation and speculative activity coinciding with rising DeFi prices. This was evident in October 2023 when correlations rose from -0.25 to over 0.1, driven by altcoin and memecoin activity amid a broader market uptrend.
However, DEX volume spikes can also occur during market stress, such as the Silicon Valley Bank collapse, leading to rapid correlation shifts as investors manage risk. Over time, the declining trend in correlation may be attributed to the sector's growth beyond just on-chain exchanges to stablecoin issuers like Maker and money markets like Aave, reflecting a more diversified ecosystem.
Volumes by Asset Class & Sector
The evolution of spot trading volume reflects market activity and liquidity across asset classes of the ecosystem. Driven by the adoption and nature of early projects, the Digital Currencies sector dominated volumes. However, the subsequent rise of Blockchain Infrastructure underpinning Digital Asset Applications is evident—currently making up 20% and at times, 40% of total spot volume.
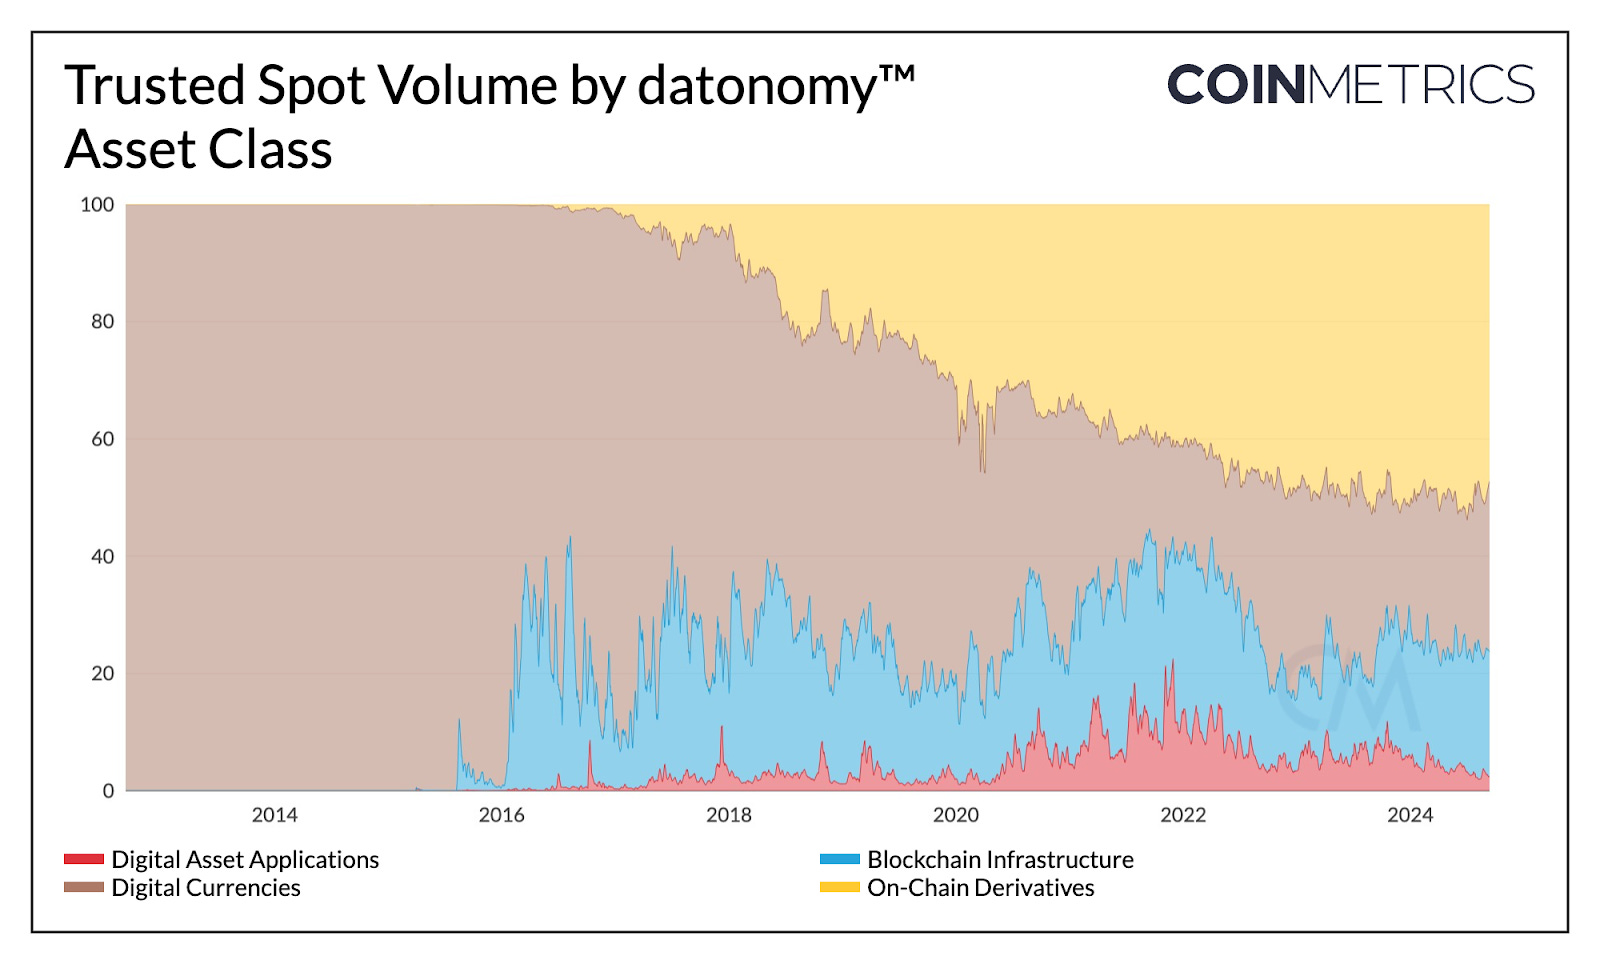
Source: Coin Metrics datonomy™, Market Data Feed
In parallel, the On-Chain Derivatives sector has grown substantially to represent a 50% market share of spot volume among all asset classes. This growth stems in particular from the Stablecoins sector, contributing $25B, or half of the 30D average spot volume which stands at $50B across all sectors. Value Transfer Coins and Smart Contract Platforms have maintained their importance, representing a combined 45% market share of spot volume across trusted exchanges.
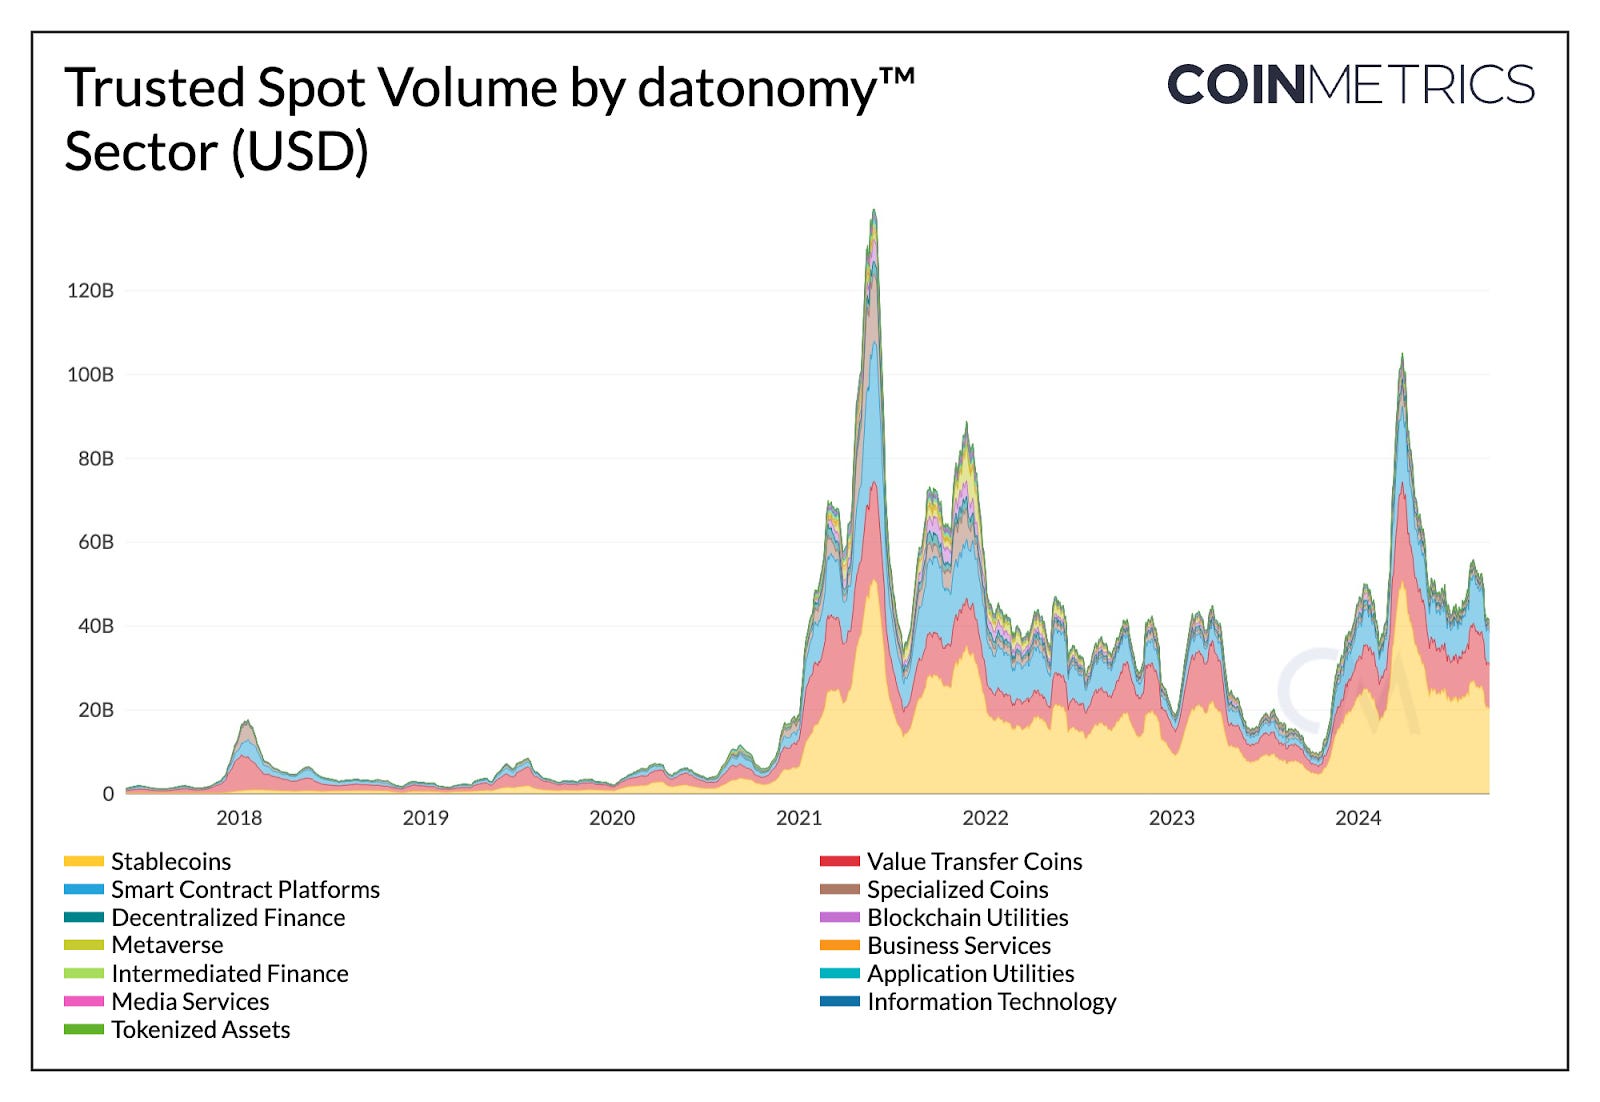
Source: Coin Metrics datonomy™, Market Data Feed
While volumes have tapered off recently, they remain at levels observed during the bear market phase of 2022 and significantly higher than the summer of 2023, when several market makers retreated their operations.
Conclusion
What once was a single application has now flourished into a multi-faceted industry encompassing smart contract platforms, scalability and interoperability solutions, on-chain financial, information technology and media infrastructure as well as a plethora of tokenized assets, from stablecoins to off-chain financial instruments. As the building blocks of the digital asset ecosystem continue to develop, it is likely that the ecosystem will increase in breadth and complexity, owing to the need for standardized classification frameworks such as datonomy™.
To explore datonomy™ further, check out our new dashboard which provides an interactive view into market sizes, sector performance, correlations and volatility across sectors of the crypto universe.
Network Data Insights
Summary Highlights
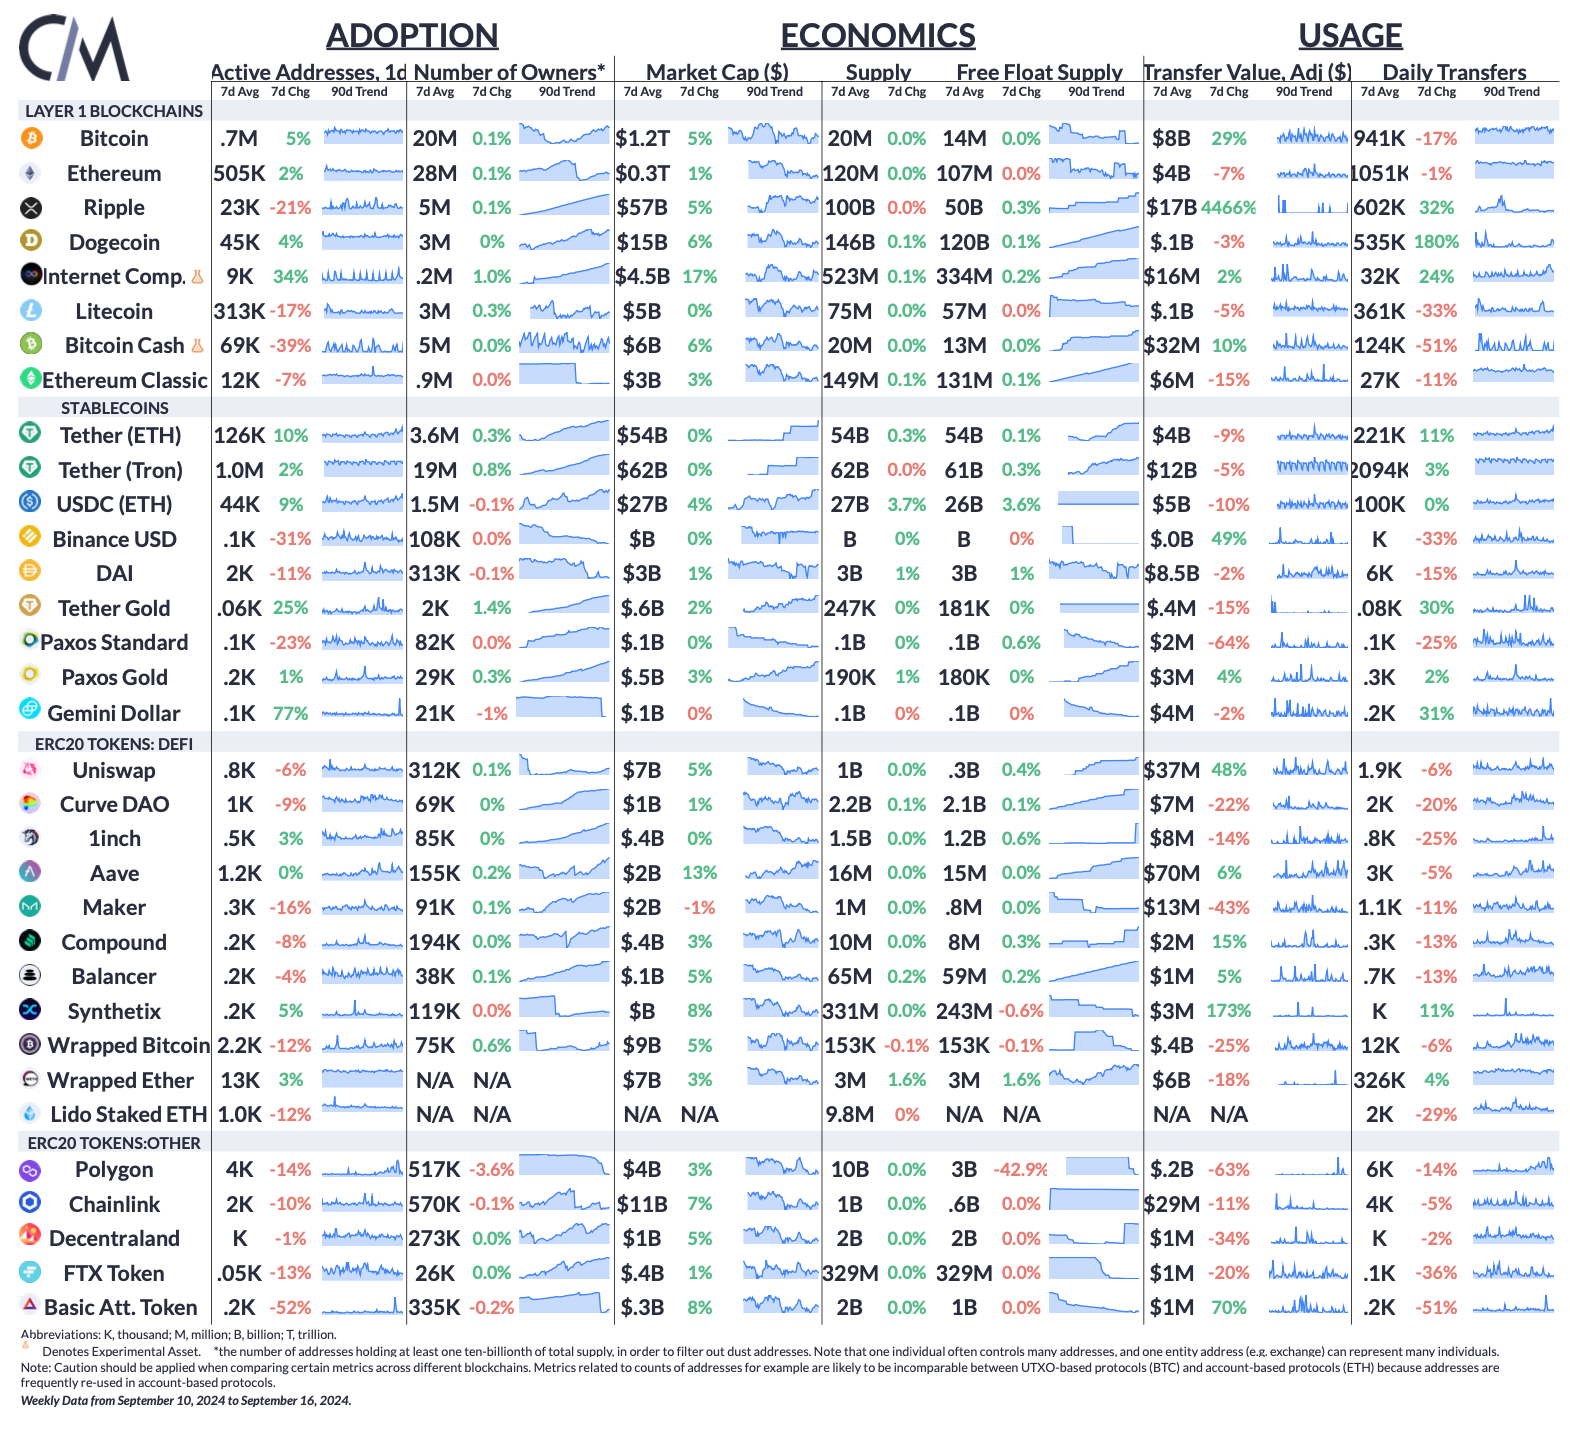
Source: Coin Metrics Network Data Pro
Daily active addresses increased by 5% for Bitcoin and 2% for Ethereum over the week respectively. Adjusted transfer value (USD) for Ripple surged by 4466%, reaching $17B on the back of an announcement of the Grayscale XRP Trust.
Coin Metrics Updates
This week’s updates from the Coin Metrics team:
Follow Coin Metrics’ State of the Market newsletter which contextualizes the week’s crypto market movements with concise commentary, rich visuals, and timely data.
Subscribe and Past Issues
As always, if you have any feedback or requests please let us know here.
Coin Metrics’ State of the Network, is an unbiased, weekly view of the crypto market informed by our own network (on-chain) and market data.
If you'd like to get State of the Network in your inbox, please subscribe here. You can see previous issues of State of the Network here.


