Bitcoin (BTC) has surged back above $60,000 after the Fed decided to cut interest rates by 50 basis points for the first time in 4 years. This is a positive signal for the cryptocurrency market.
Analysts, however, have mixed views on the short-term reaction to the rate cut. BitMEX co-founder and Maelstrom chief investment officer Arthur Hayes expects markets to fall after the rate cut because it will “narrow the interest rate differential between the US dollar and the Japanese yen.”
Conversely, founder of Bitcoin and digital asset investment fund Capriole Investments Charles Edwards believes that Bitcoin will continue its bullish phase after the Federal Reserve cuts interest rates, as it signals the beginning of a dovish policy regime.
So what are the key levels that Bitcoin and altcoins need to overcome to indicate bullish sentiment? Let's analyze the charts of the top 10 cryptocurrencies to find out.
Bitcoin's price action over the past few days has formed a symmetrical triangle pattern, showing indecision between bulls and bears.

BTC/ USDT daily chart | Source: TradingView
The price has declined from the resistance line and is likely to drop to the 20-day Medium ($58,639). This is a crucial level for the bulls to defend, as a break of this level could open the doors for a drop to the triangle's support line.
Conversely, if the price rebounds from the 20-day EMA, the bullish outlook above $61,200 will improve. If that happens, the BTC/ USDT pair could start a recovery towards $65,000 and then $70,000.
Buyers attempted to push Ether (ETH) above the 20-day EMA ($2,397) on September 17, but the bears remained unmoved.
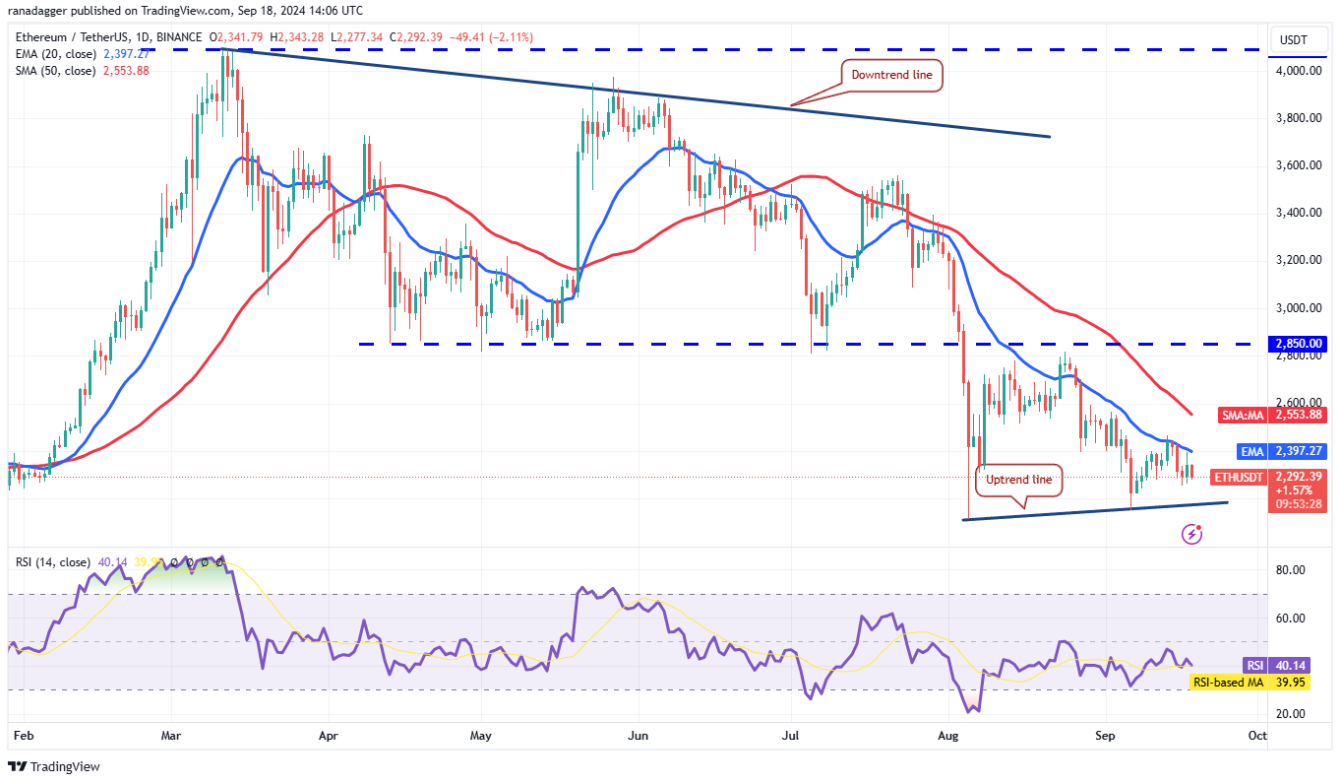
ETH/ USDT daily chart | Source: TradingView
The rising trend line is an important support level to watch on the downside. If this support level is broken, the selling could accelerate and the ETH/ USDT pair could drop to $2,111 and eventually $2,000.
Contrary to this assumption, if the bulls push the price above the 50-day SMA ($2,553), it will signal that the bears are losing strength. The pair could rise to the breakout level of $2,850. Buyers will have to break above this level to hint at a potential trend change.
BNB (BNB) has managed to stay above the moving Medium , suggesting positive sentiment in the short term.
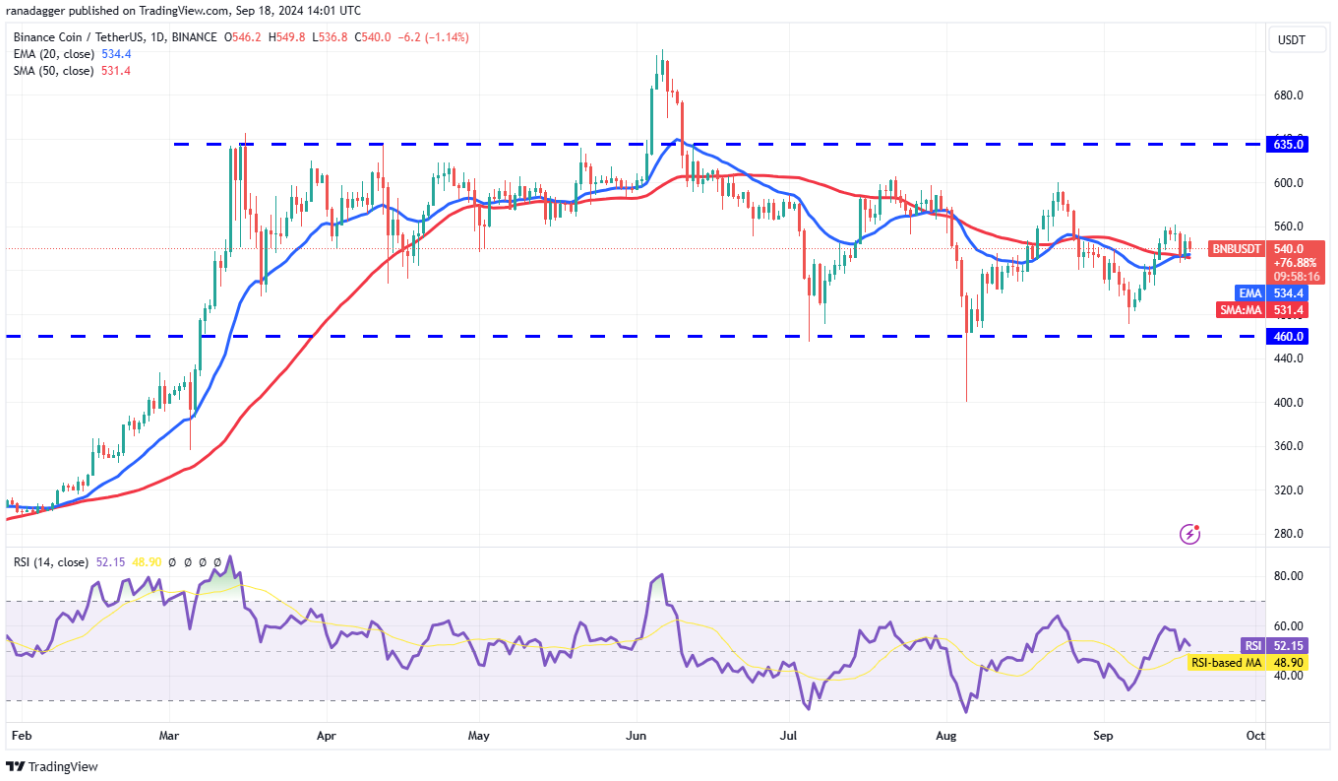
BNB/ USDT daily chart | Source: TradingView
Buyers will have to push the price above $562 to indicate a continuation of the relief rally. The BNB/ USDT pair could reach $600, where bears are likely to pose a significant challenge. If bulls overcome this barrier, the pair could reach $635.
Conversely, if the price breaks below the moving Medium , it will indicate that the bears have overpowered the bulls. The pair could move down to the important support level at $460.
The bulls attempted to push Solana (SOL) above the 20-day EMA ($134) on September 17, but the bears held firm.
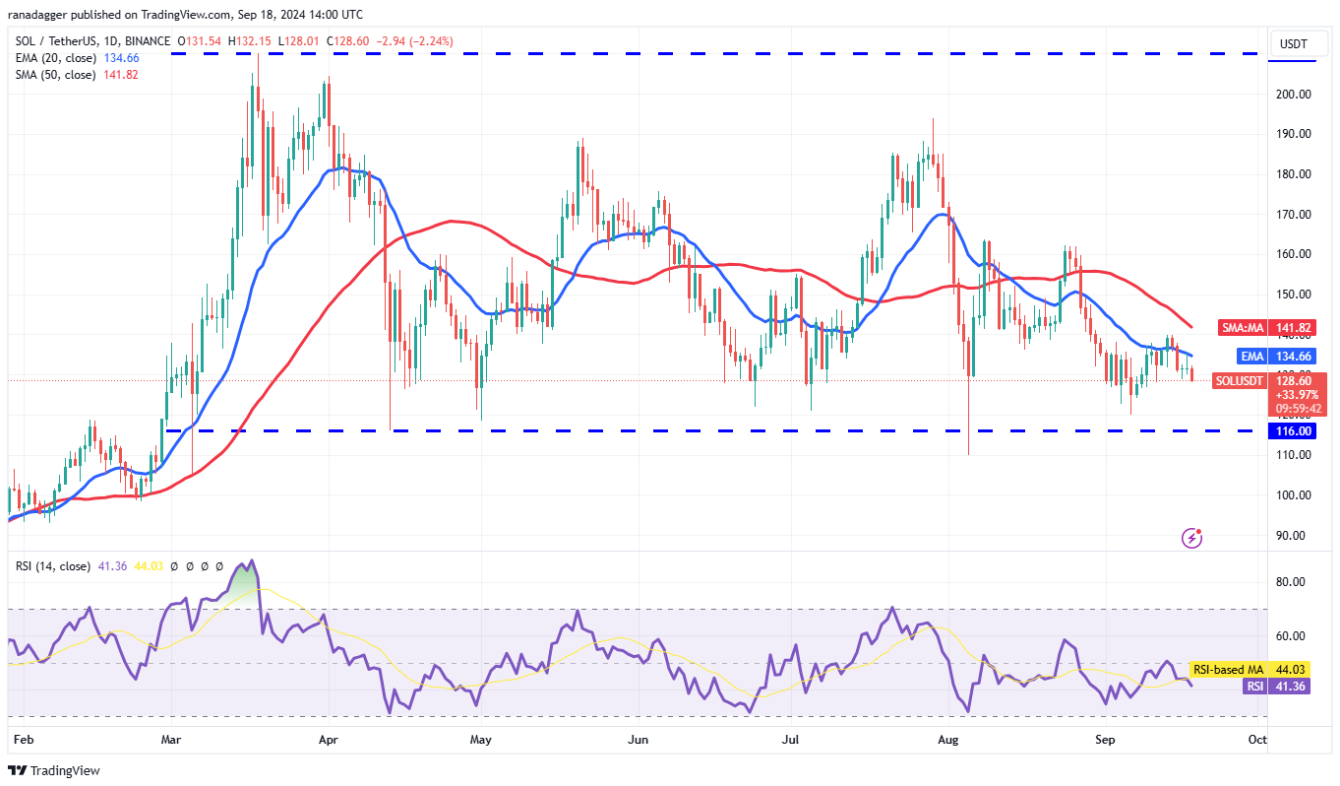
SOL/ USDT daily chart | Source: TradingView
The 20-day EMA has started to turn down and the RSI is in the negative zone, which suggests that bears have the upper hand. There is minor support at $128, but if this level breaks, the SOL/ USDT pair could drop to $116.
Contrary to this assumption, if the price rises from the current level and breaks above the 50-day SMA ($141), this will indicate the start of a sustainable recovery. After that, the pair could attempt to rise to $164.
XRP (XRP) bounced from the 20-day EMA ($0.56) on September 16, but the bulls could not push the price above the overhead resistance at $0.60.
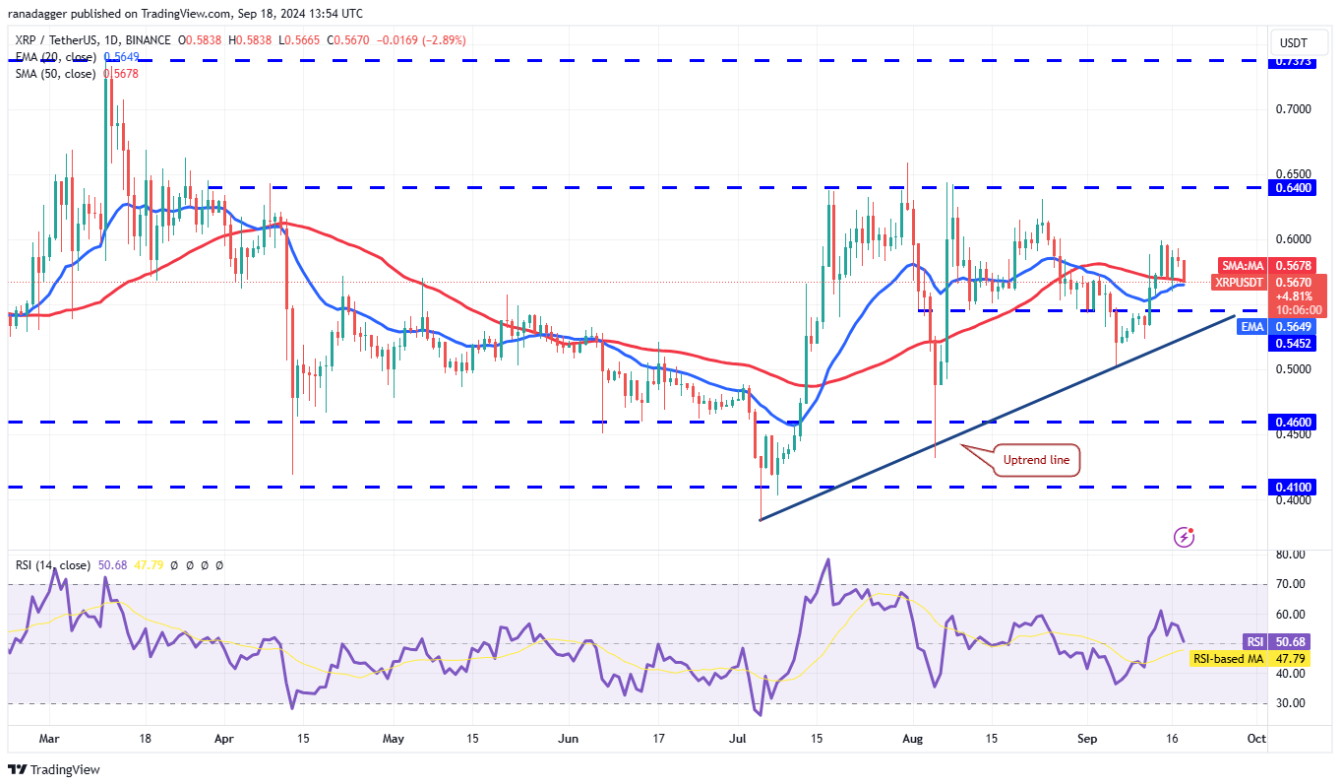
XRP/ USDT daily chart | Source: TradingView
The bears pulled the price back to the moving Medium on September 18. If this support breaks, the XRP/ USDT pair could drop to the uptrend line. The bulls are expected to defend the uptrend line because a break below it could see the pair drop to $0.46.
Instead, if the price bounces off the moving Medium and breaks above $0.60, this will signal that dips are being bought in. The pair could rise to $0.64, which could be a tough barrier to overcome.
Dogecoin (Doge) has been trading near the downtrend line of the Falling Wedge wedge pattern, which suggests that bulls remain in buying pressure.
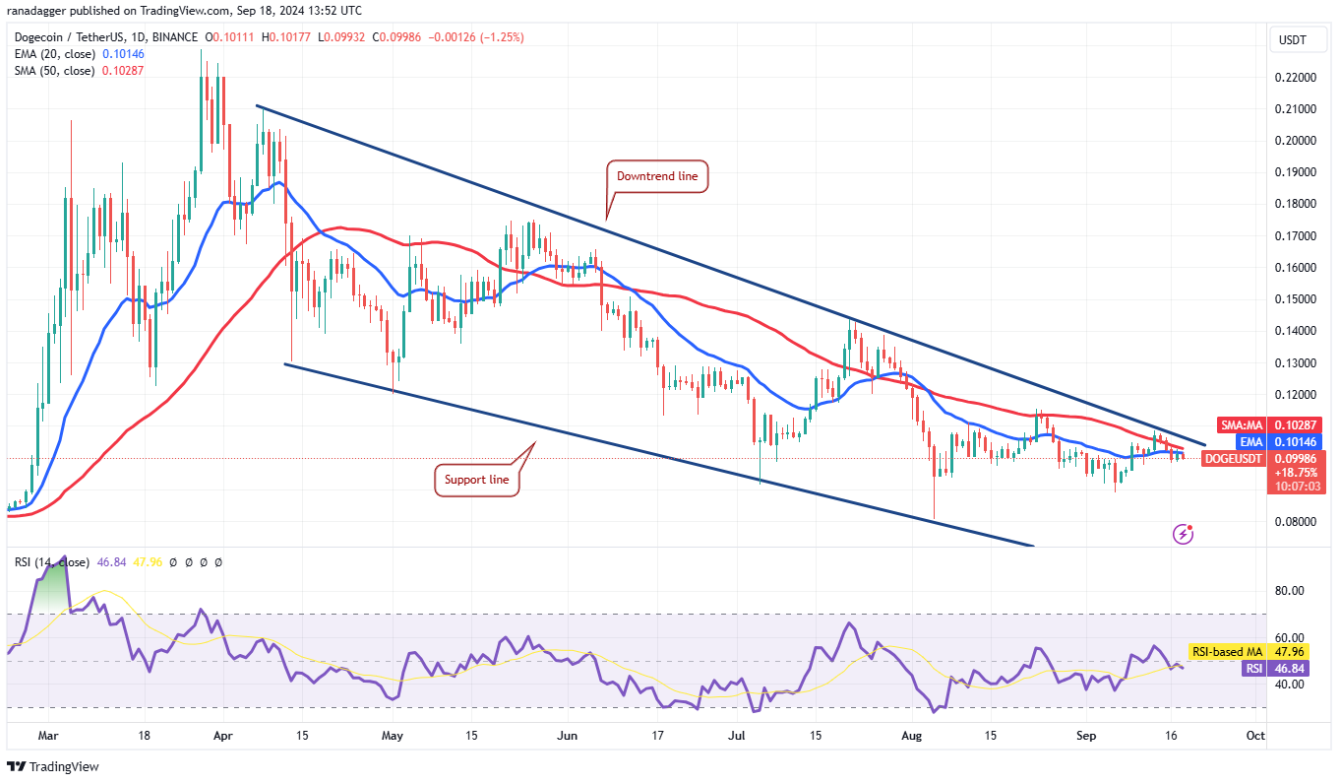
Doge/ USDT daily chart | Source: TradingView
If the price rises and breaks above the downtrend line, this will indicate the start of a new uptrend. The Doge/ USDT pair could rise to $0.14 where the bears could mount a strong defense.
Contrary to this assumption, if the price drops sharply from the current level, this will indicate that bears are selling on the rise. The pair could drop to $0.09 and then $0.08.
Toncoin (TON) has been trading near the 20-day EMA ($5.46) for the past two days, suggesting a tough battle between the bulls and the bears.
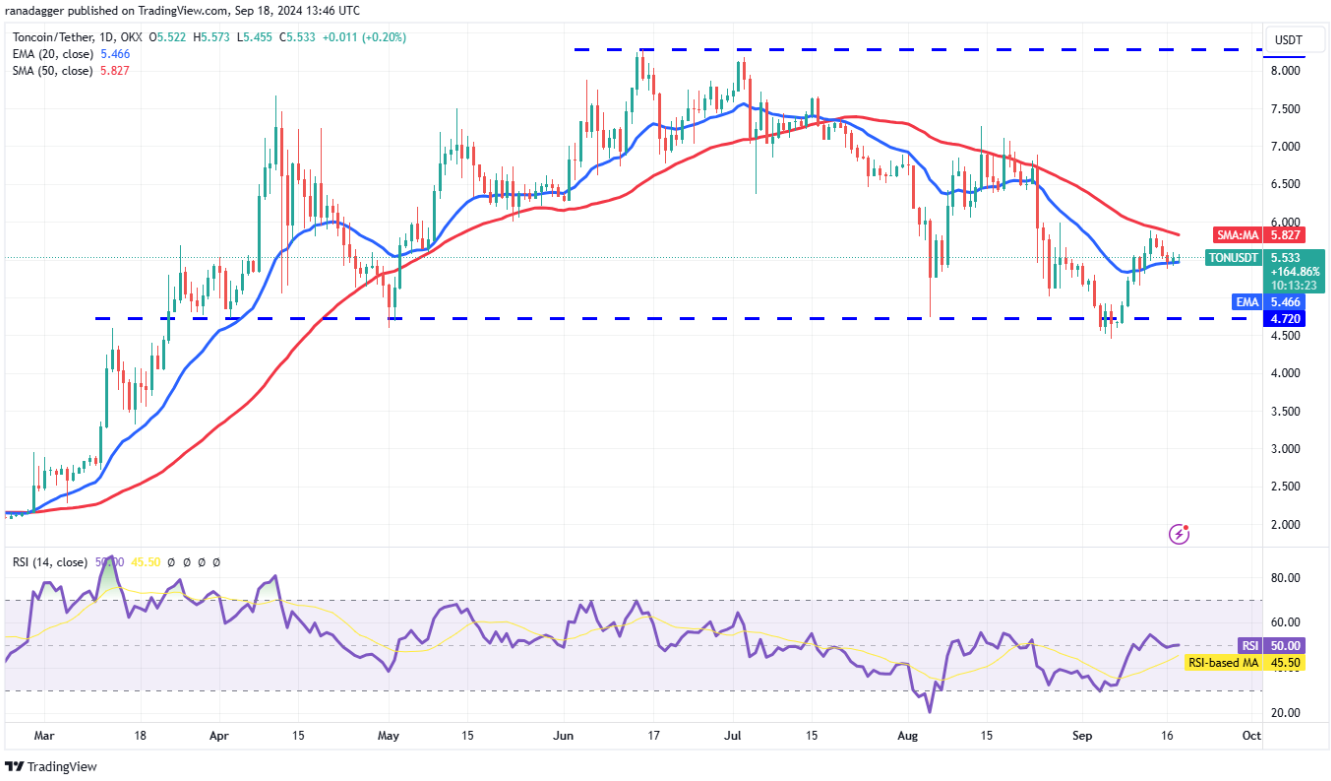
TON/ USDT Daily Chart | Source: TradingView
The flattening 20-day EMA and the RSI near the midpoint do not give a clear advantage to either the bulls or the bears. If the price rises from the 20-day EMA and breaks above the 50-day SMA ($5.82), it will signal the start of a strong recovery. Above $6, the TON/ USDT pair could rise to $7.
Conversely, if the price slides below the 20-day EMA, the selling pressure could intensify and the pair could drop sharply towards the $4.72-$4.44 support zone.
Cardano (ADA) has formed a descending triangle pattern, which will complete on a break and close below $0.31.
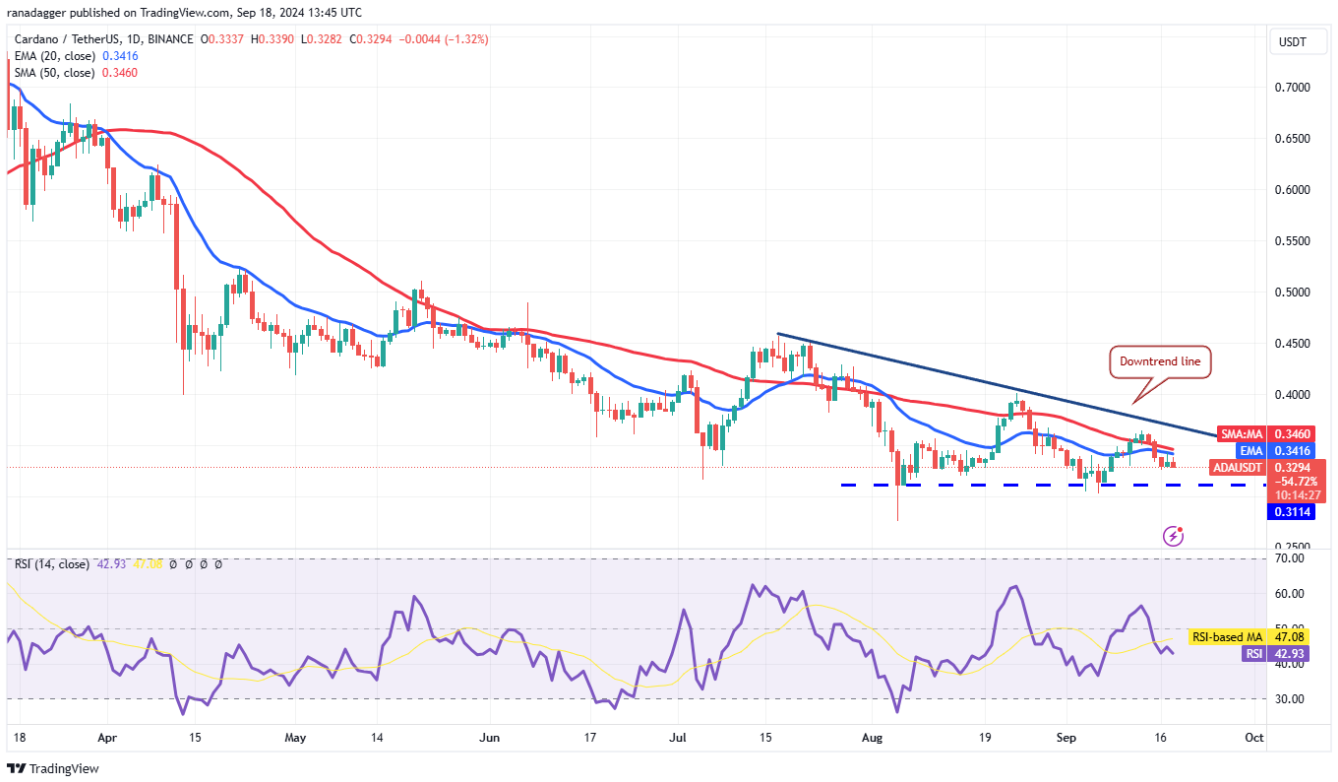
ADA/ USDT daily chart | Source: TradingView
If that happens, the ADA/ USDT pair is likely to drop to $0.24. This is an important level to watch because if it breaks, selling pressure could increase and the pair could freefall to $0.20.
If the bulls want to halt the decline, they will have to push the price above the downtrend line quickly. That would invalidate the bearish pattern, leading to a possible short squeeze. The pair could then attempt to rise to $0.40 and higher to $0.45.
The bulls are struggling to push Avalanche (AVAX) above the resistance line of the descending channel, but a positive sign is that they are not allowing the price to dip below the 50-day SMA ($22.82).
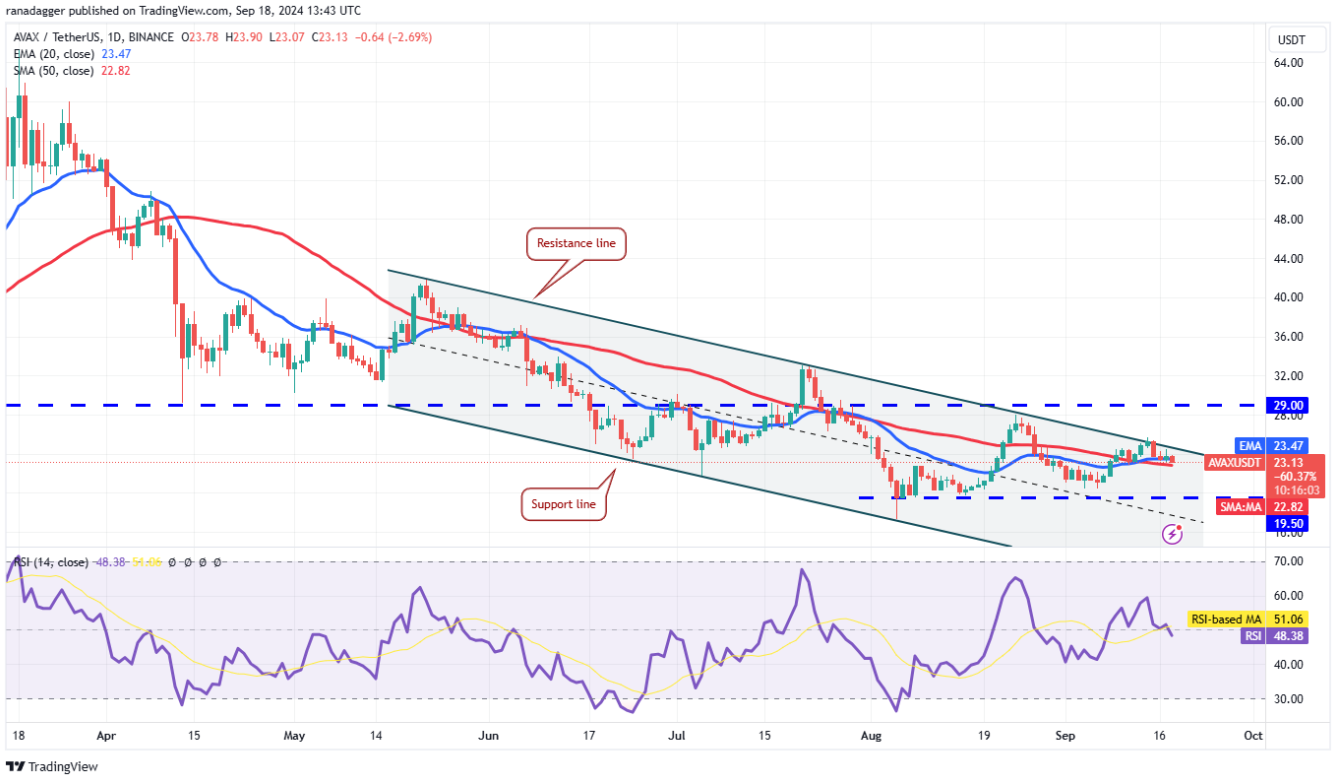
AVAX/ USDT daily chart | Source: TradingView
The bulls will again attempt to push the price above the channel resistance line. If successful, the AVAX/ USDT pair could rally to the breakout level of $29 and then to $33.
Conversely, if the price continues to decline and breaks below the 50-day SMA, it will signal that the bulls have given up. That could drag the price down to the strong support at $19.50. The bulls are expected to defend this level strongly.
SHIB continues to trade between the 50-day SMA ($0.000014) and the horizontal support at $0.000012, suggesting that bears have a slight advantage.
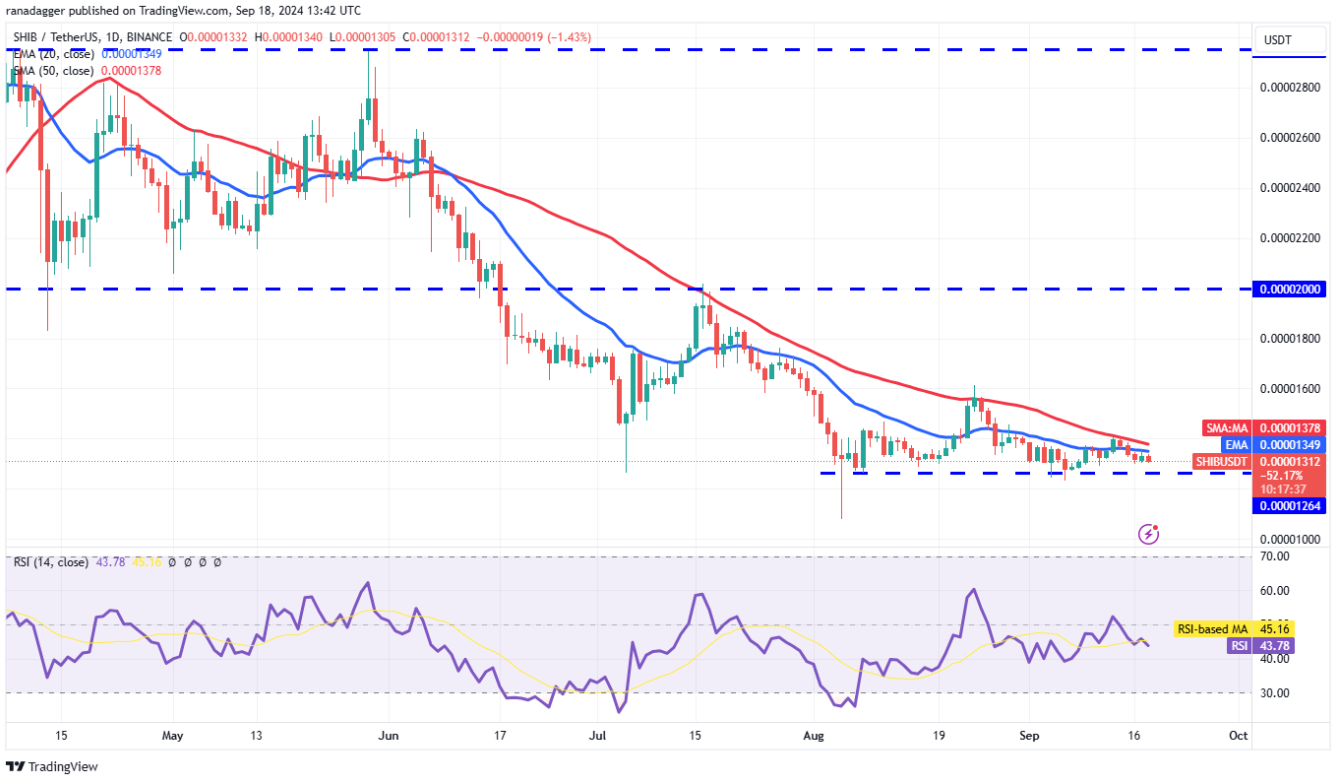
SHIB/ USDT Daily Chart | Source: TradingView
The bears will attempt to push the price below the $0.000012 support. If successful, the SHIB/ USDT pair could start the next decline towards $0.000011 and then $0.000010.
On the other hand, if the price rises and closes above the 50-day SMA, it will indicate that the bears are closing their positions. That could start a recovery towards $0.000016. This level could Vai as a temporary barrier, but if it is cleared, the pair could reach $0.000020.
You can XEM coin prices here.
Disclaimer: This article is for informational purposes only and is not investment advice. Investors should research carefully before making any decision. We are not responsible for your investment decisions.
Join Telegram: https://t.me/tapchibitcoinvn
Follow Twitter: https://twitter.com/tapchibtc_io
Follow Tiktok: https://www.tiktok.com/@tapchibitcoin
SN_Nour
According to Cointelegraph