Written by:Coinbase & Glassnode
Compiled by: Felix, PANews
What changes have occurred in the crypto market over the past three months? The price of BTC has basically shown range-bound fluctuations, oscillating between $50,000 and $60,000, with some volatility in between. But a closer look reveals that important developments are unfolding behind the scenes.
First, the liquidity and complexity of the crypto market have increased this quarter. Institutions remain deeply interested in cryptocurrencies. The US Bitcoin spot ETF saw net inflows of $5 billion, indicating that institutions are still participating despite occasional volatility. The price of ETH reached a new all-time high, reflecting that traditional finance is exploring new ways to interact with digital assets. Meanwhile, stablecoins remain one of the most widely used applications in the crypto space, with a market capitalization reaching a record $170 billion, and growing trading volumes demonstrating their continued utility in cross-border transactions and other areas.
This report will comprehensively introduce the forces driving these trends. It also points out the potential shifts and directions that may occur for the major assets, especially BTC and ETH, as the year-end approaches.
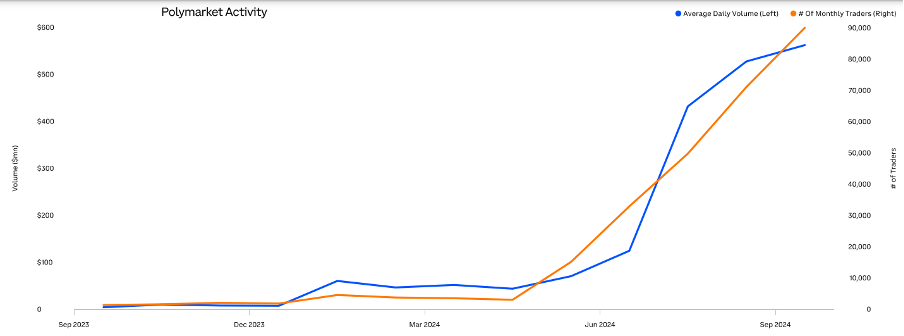
Polymarket is a breakthrough application for the crypto election year, demonstrating how blockchain technology can help improve the transparency, accessibility, and trustworthiness of markets and information.
Source: @rchen8, dune analytics, Grayscale Investments
Data as of September 30
In the L1 blockchains, Ethereum's fee market share has rebounded, rising from a low of 9% at the end of August to 40% by the end of September.
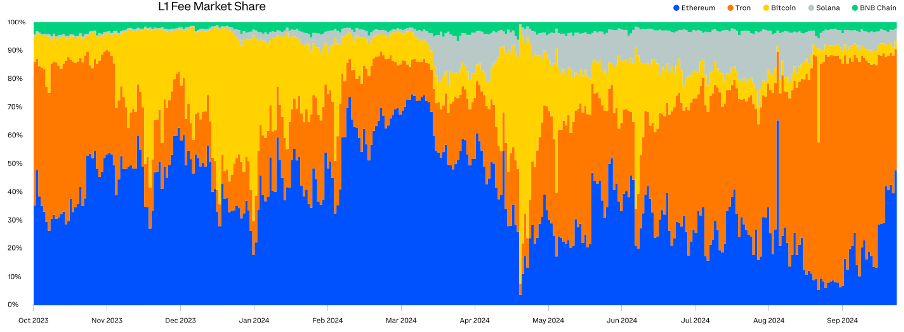
Source: Token Terminal, September 24
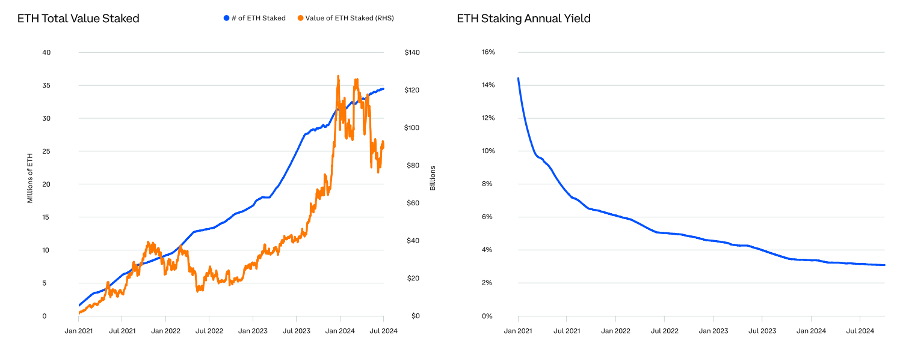
The Ethereum staking yield is more than double the real (inflation-adjusted) yield of the 10-year US Treasury bond.
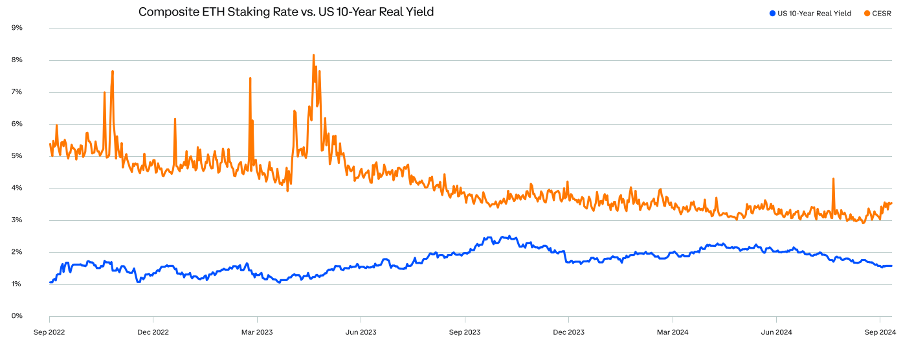
Source: CoinDesk Indices
(CESR measures the average annualized yield earned by ETH validators, composed of consensus rewards and priority transaction fees; while ETH's inflation rate has been negative for most of its history, it has recently turned positive, so stakers should consider its impact on staking yields)
Many successful applications generate yields that exceed the infrastructure they run on.
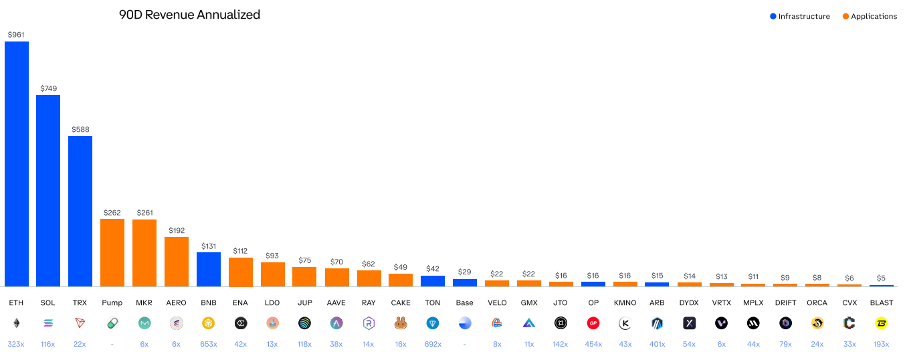
Source: Token Terminal, MakerBurn, defillama, Tronscan
Annualized revenue is calculated over the past 90 days, Solana revenue includes base fees, priority fees, and MEV tips; data as of September 25
Last year, token issuance volume surged 13-fold, with Solana accounting for the largest share.
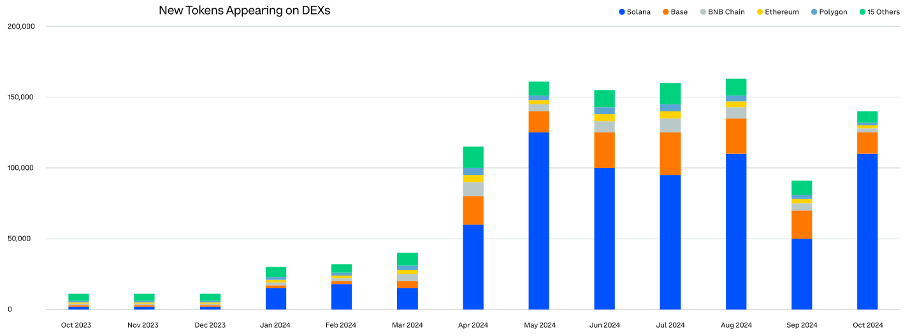
Source: dune analytics
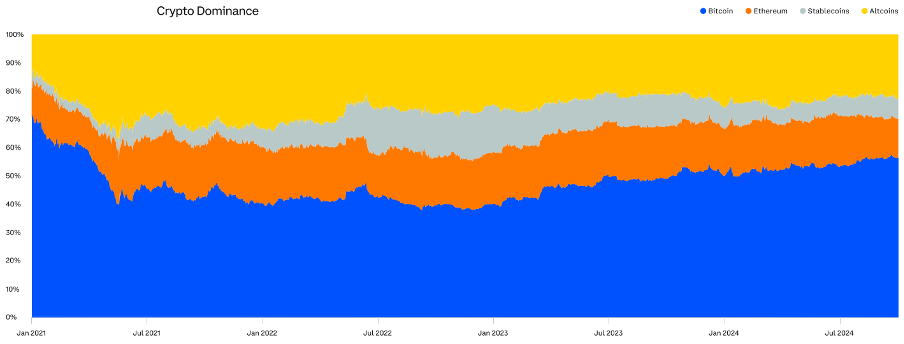
Market Overview
Due to market participants being drawn to the highest-quality assets, the dominance of BTC and stablecoins increased in the third quarter.
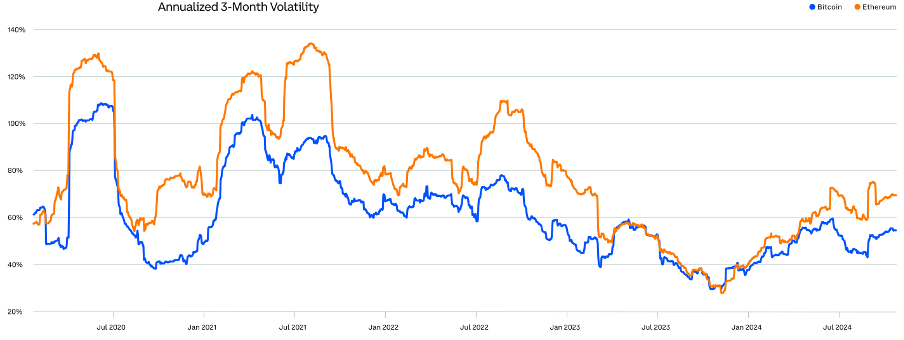
As the market matures, the volatility of BTC and ETH has shown a significant downward trend.
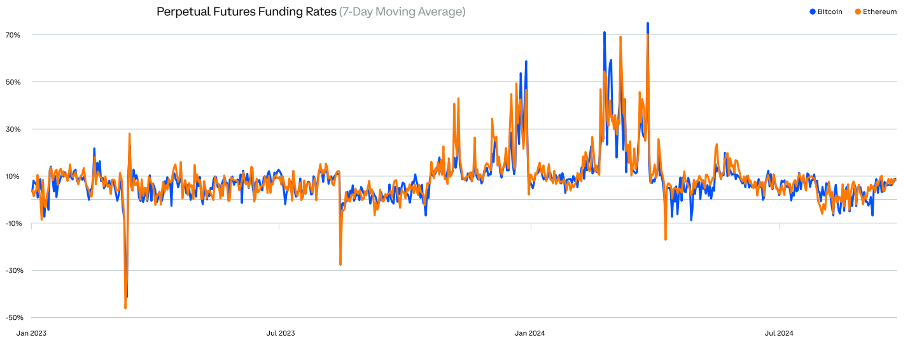
In the third quarter, the perpetual contract funding rates traded in a narrow range, indicating a balance between buyers and sellers in the market.
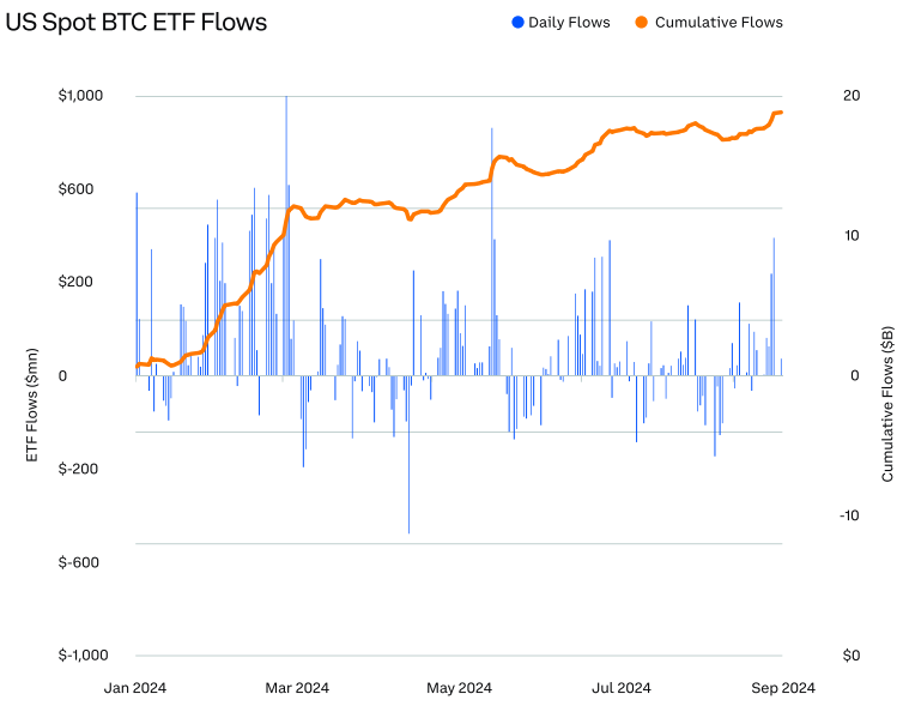
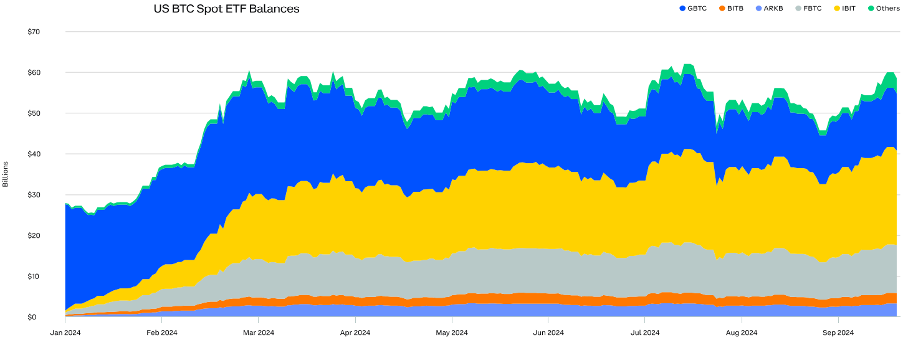
The US spot BTC ETF attracted over $5 billion in net inflows in the third quarter.
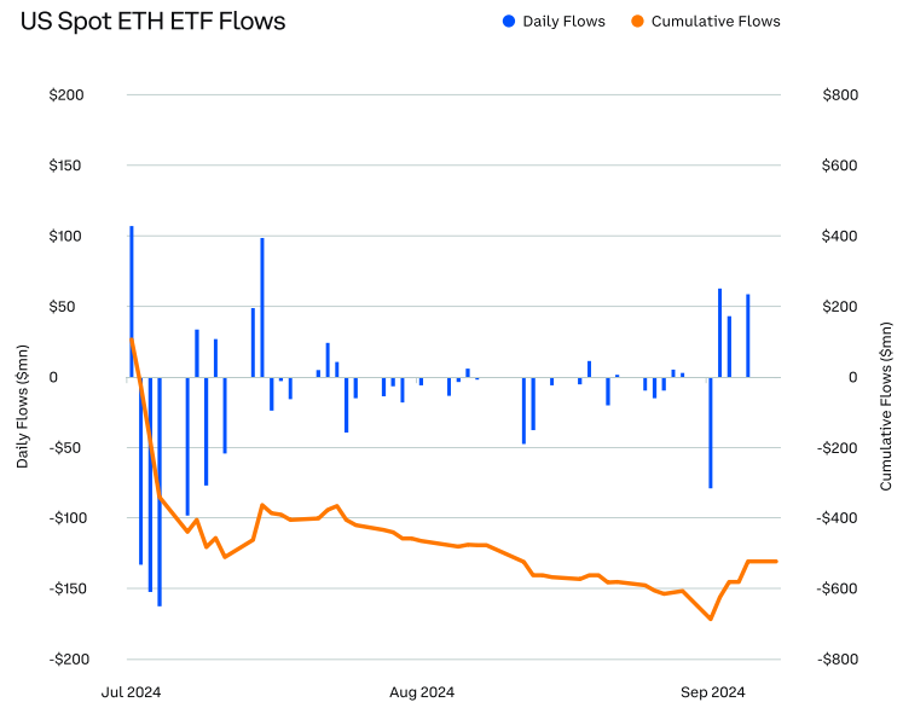
After experiencing weeks of outflows, the US spot ETH ETF saw a rebound in inflows towards the end of the third quarter.
The basis (CME futures minus spot) for both BTC and ETH declined in the third quarter.
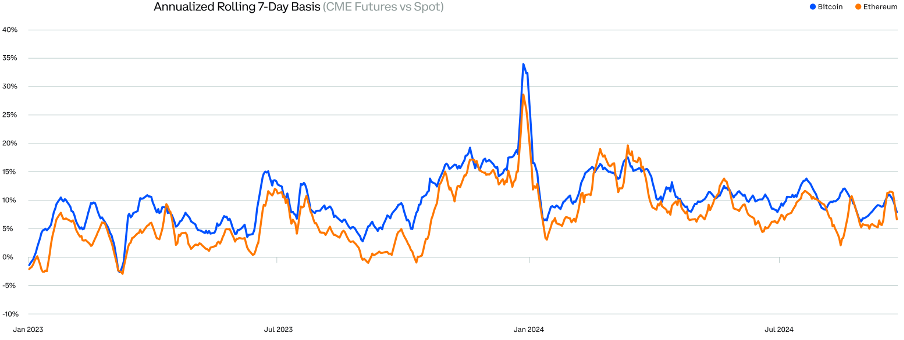
Extreme basis movements, whether positive or negative, are often associated with significant swings in market sentiment.
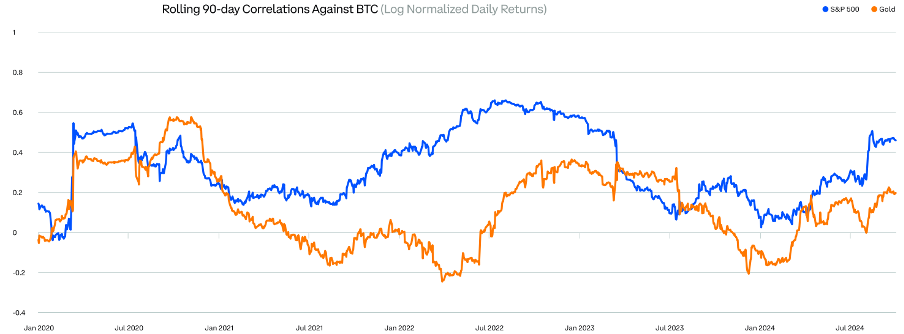
Cryptocurrencies have exhibited low or negative correlations with all major asset classes.
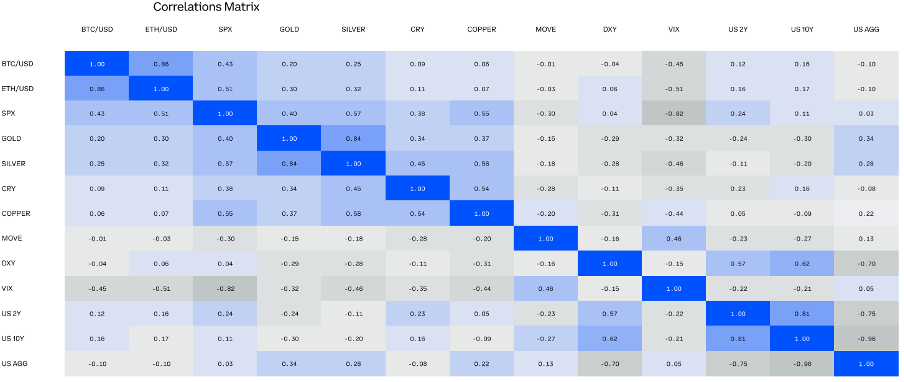
Source: Bloomberg, Coinbase. Data from July 1 to September 30
Since 2020, the average correlation between BTC and the S&P 500 index has been only 0.33, and the average correlation with gold has been only 0.13.
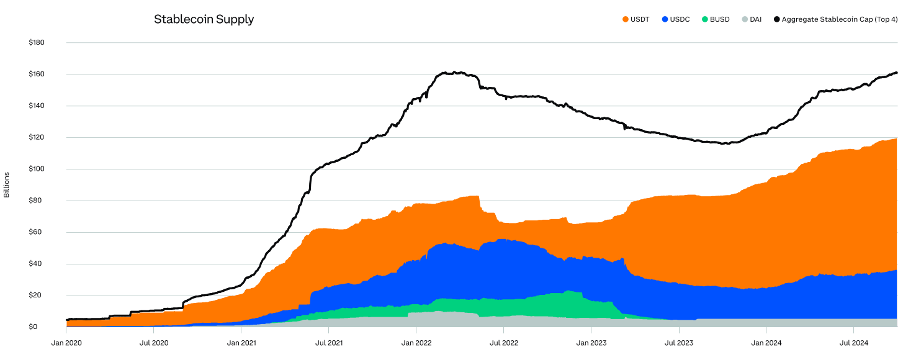
Stablecoins Soar
The total market capitalization of stablecoins reached a new all-time high of nearly $170 billion in the third quarter of 2024, and the new rules under the EU's Crypto Asset Markets (MiCA) regulation also came into effect.
Both of these events reflect the increasing mainstream adoption of stablecoins and the recognition of the advantages they can provide, including speed, cost, and security. Stablecoins are being increasingly used to build payment systems, facilitate remittance payments, and simplify cross-border transactions.
Integrating stablecoins into existing payment systems is just one example of how cryptocurrencies are being increasingly applied in the real economy.
As market participants continue to use stablecoins for a variety of new and existing use cases, the supply of stablecoins reached a new all-time high in the third quarter.
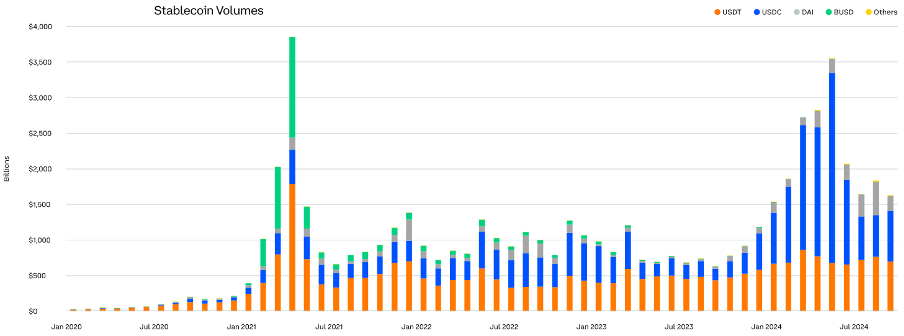
So far this year, stablecoin trading volume has soared to nearly $20 trillion.
L2
As we enter the fourth quarter, the price of ETH is approaching the levels seen at the beginning of the year. But beyond just the price, we can see a rapidly growing Ethereum ecosystem, largely driven by new innovative L2s.
As developers and end-users continue to migrate onto the blockchain, both active user counts and transaction volumes have surged. At the same time, after Ethereum's Dencun upgrade, L2 fees have dropped significantly.
While it remains to be seen how the activity between Ethereum L1 and the various L2s will evolve, the L2s have brought more users, more activity, and more innovation to the Ethereum world.
This year, the daily active addresses in the Ethereum ecosystem have skyrocketed, with the most significant increase coming from L2s, led by Base.

With the proliferation of new L2s and use cases, the daily transaction count in the Ethereum ecosystem has increased 5-fold since the beginning of 2023.
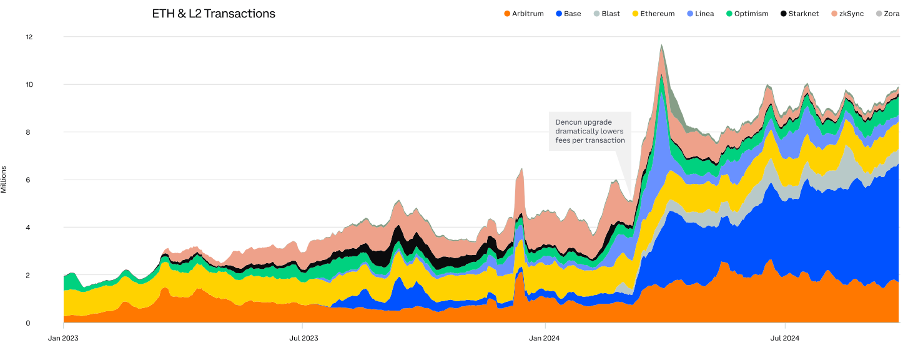
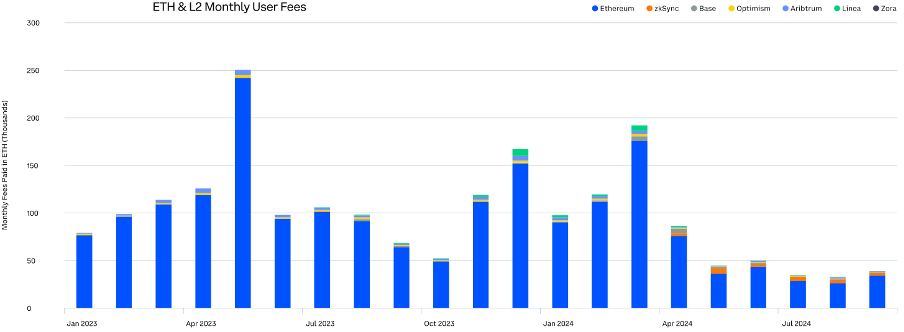
After Ethereum's Dencun upgrade in March 2024 significantly reduced L2 transaction fees, the total fees paid have dropped significantly despite the surge in transaction activity.
Bitcoin (BTC)
The current BTC cycle is closely related to the 2015-2018 and 2018-2022 cycles, which had total returns of around 2,000% and 600%, respectively.
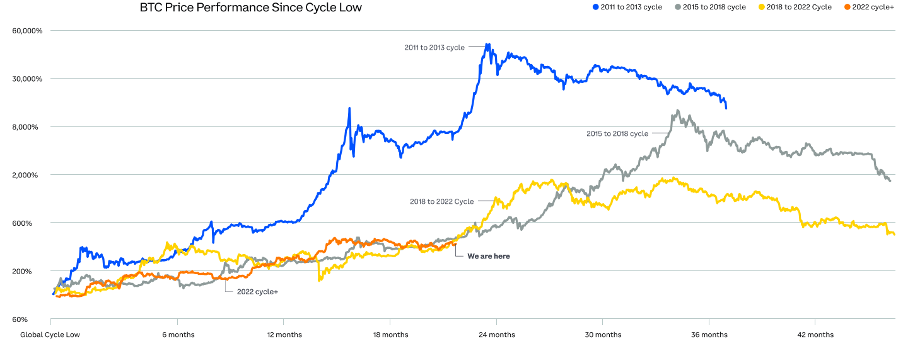
Bitcoin has experienced four cycles, each including both bull and bear markets. This chart shows how the current market cycle (starting in 2022) compares to the previous cycles. (Past performance does not guarantee future results)
BTC's performance since the fourth halving is most similar to the period after the third halving, when the price consolidated for several months before a significant rally in the year following the halving.
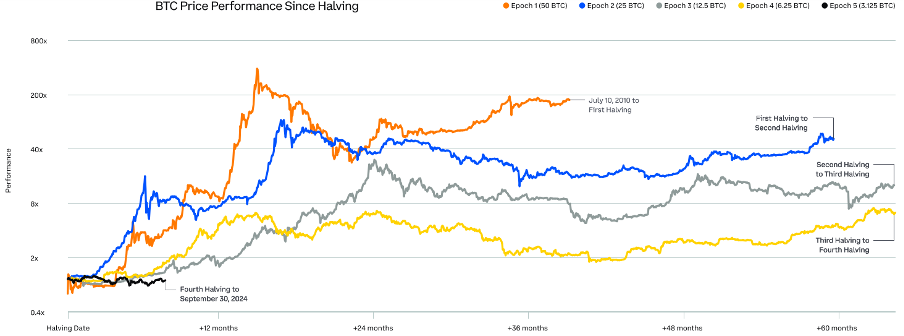
This chart measures the total returns of Bitcoin in each halving cycle or period. After the halving, the price tends to trade sideways, just like the six months since the April 2024 halving. However, within the first 12 months after the previous three halvings, the price has risen significantly. After the first halving, the price rose over 1000% in the first 12 months. After the second halving, the price rose 200% in the first 12 months. After the third halving, the price rose over 600% in the first 12 months. Since the fourth halving (black line) on April 19, 2024, the price of Bitcoin has fallen 1.2%.
As of the end of the third quarter, the asset management size of the US spot BTC ETF, which was launched only 9 months ago, has reached nearly $60 billion.
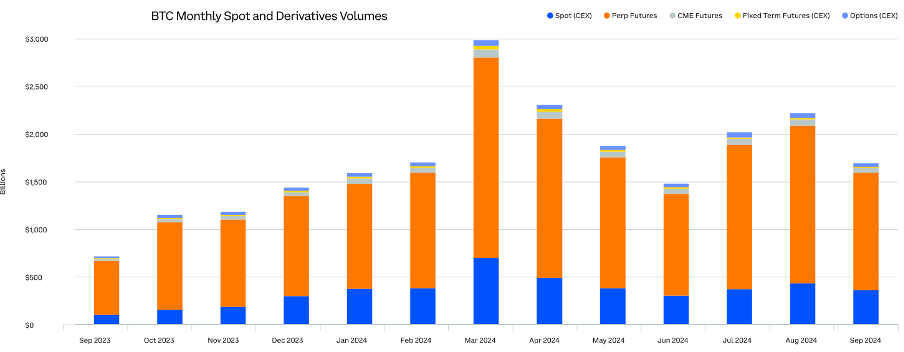
Crypto market liquidity is getting stronger. So far this year, the average monthly trading volume of BTC has been $2 trillion, up 76% year-over-year.
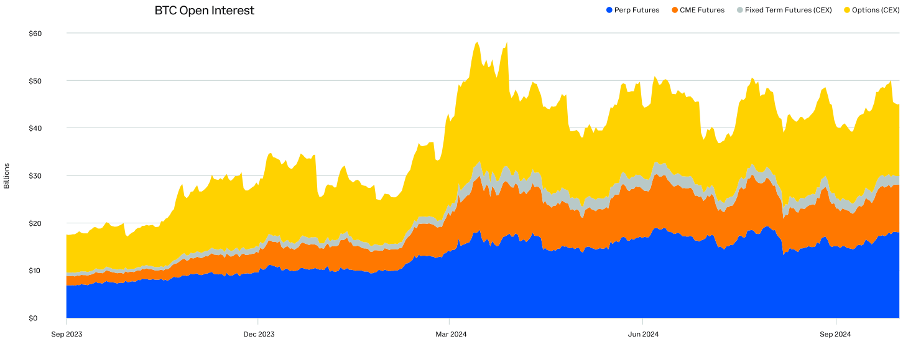
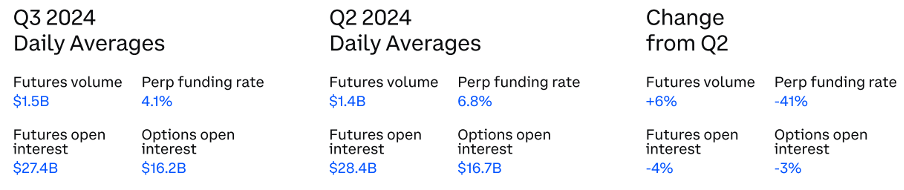
In the third quarter of 2024, the average open interest of Bitcoin derivatives was $44 billion.
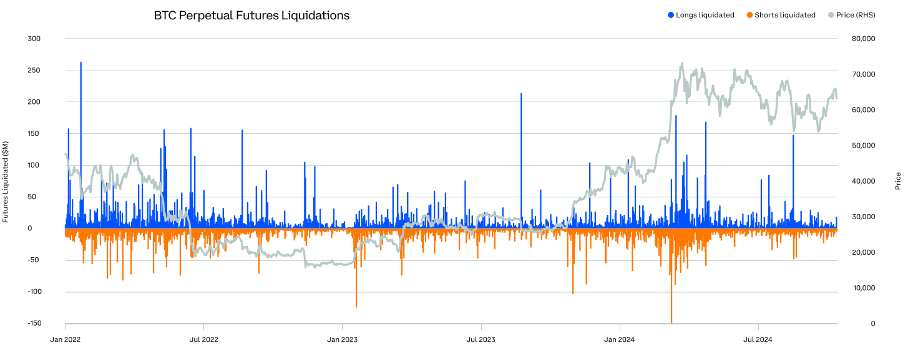
After the large-scale long liquidation related to the unwinding of the JPY short arbitrage trade in early August 2024, Bitcoin positions appear to be more clear.
BTC Derivatives Summary Statistics:
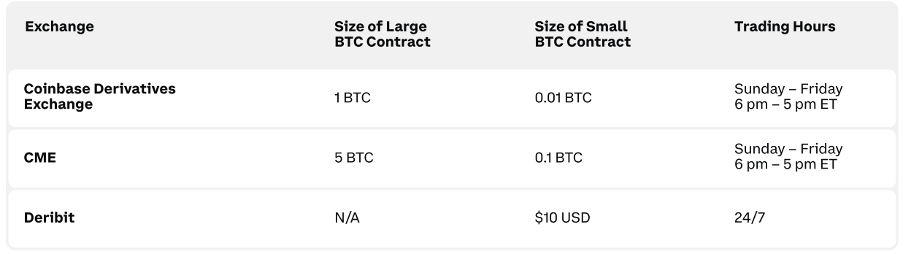
BTC Traditional Futures Specifications
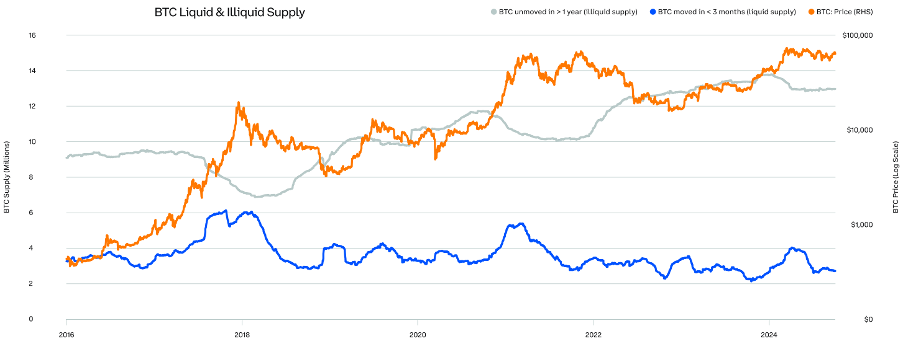
Throughout the third quarter, the scale of BTC's liquid and illiquid supply remained relatively stable.
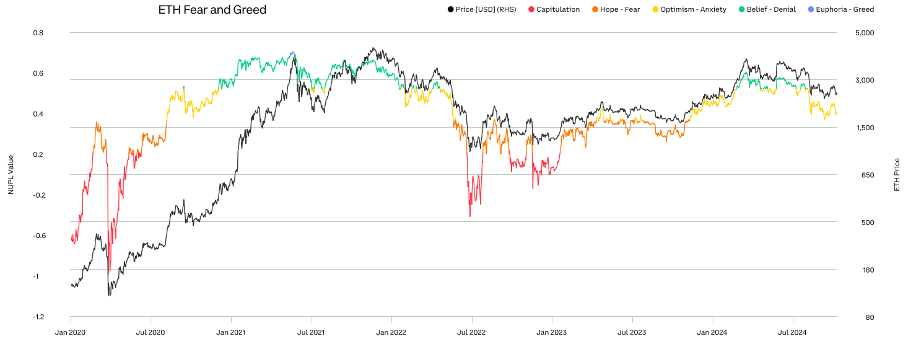
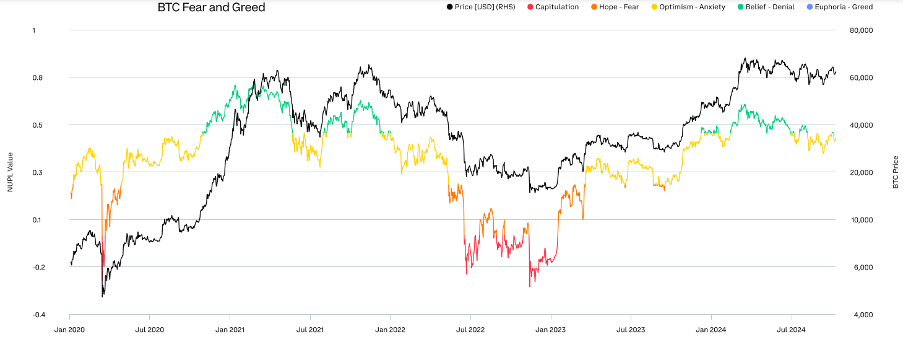
As the market consolidates, market sentiment has shifted from greed to fear, perhaps laying the foundation for the next rebound.
Ethereum (ETH)
After closely tracking the 2018-2022 cycle, the current ETH cycle has begun to differentiate as ETH prices retreated in the third quarter.
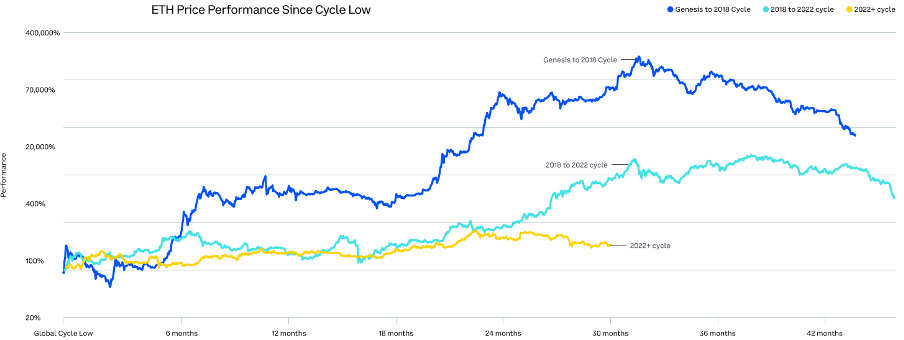
ETH has gone through two cycles, each including a bull market and a bear market. This chart shows how the current market cycle (starting in 2022) compares to the previous cycles. In the current cycle, ETH has risen over 125% since hitting the cycle low in November 2022. (Past performance does not guarantee future results)
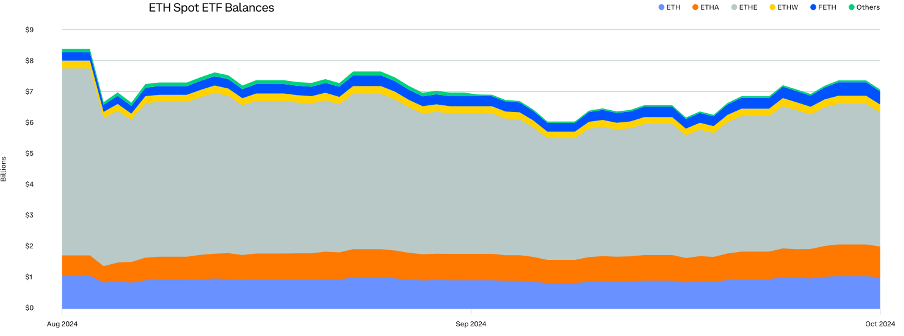
The US spot ETH ETF was launched in July, with a total size of $7.1 billion at the end of the third quarter.
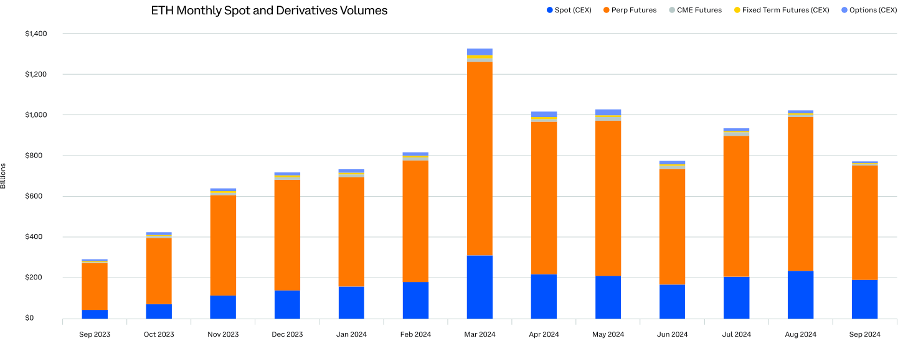
Crypto market liquidity is getting stronger. In 2024, the average monthly trading volume of ETH was $930 billion.
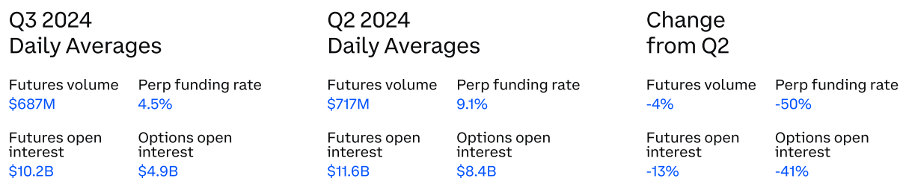
In the fourth quarter of 2023, the average open interest of ETH derivatives was $15 billion.
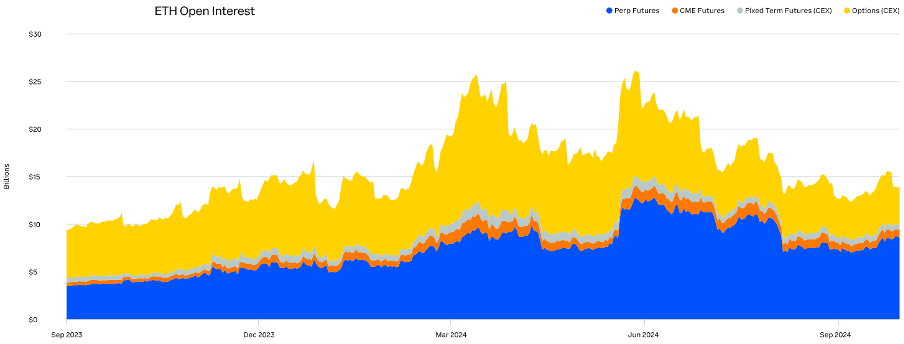
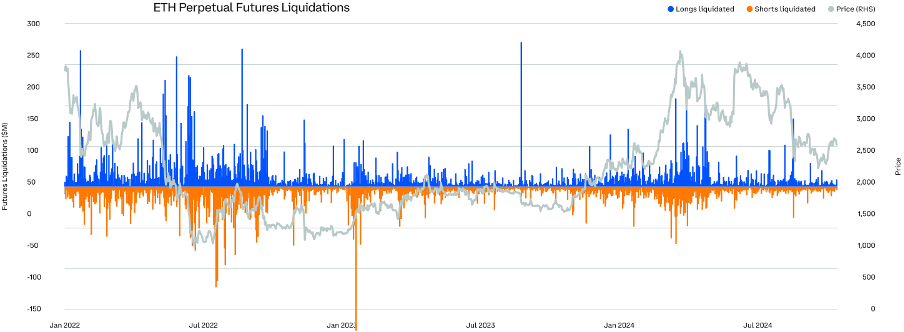
After the launch of the US spot ETH ETF and the unwinding of the JPY short arbitrage trade in early August, the volume of ETH long liquidation immediately surged.
ETH Derivatives Summary Statistics
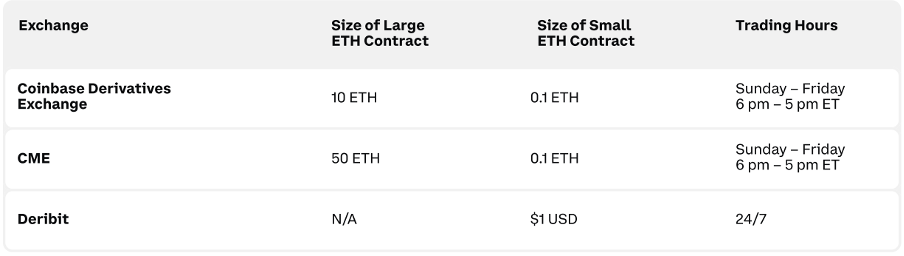
ETH Traditional Futures Specifications
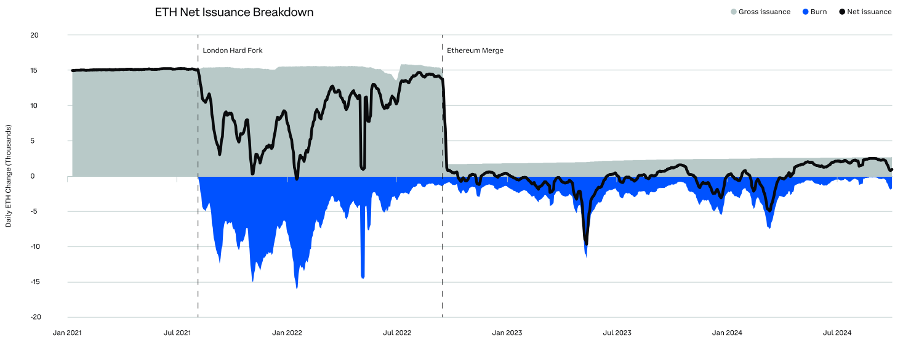
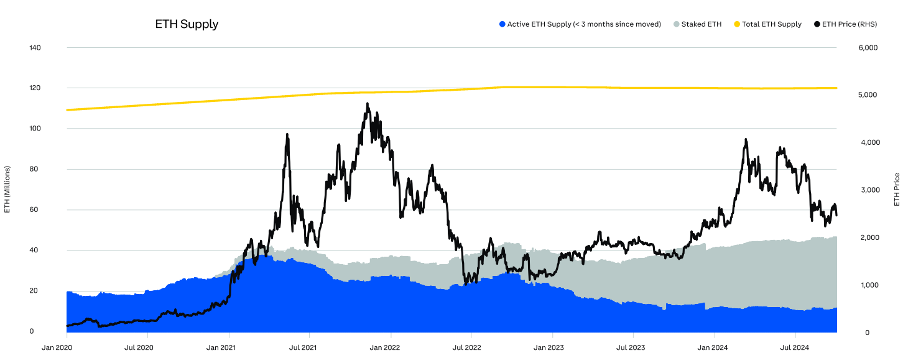
Although fees have risen slightly at the end of the third quarter, ETH issuance still maintains net inflation.
With more and more holders seeking to earn yield from their positions, the amount of ETH staked reached a new high in the third quarter.
In the third quarter, the amount of ETH locked in DeFi increased by 11%.
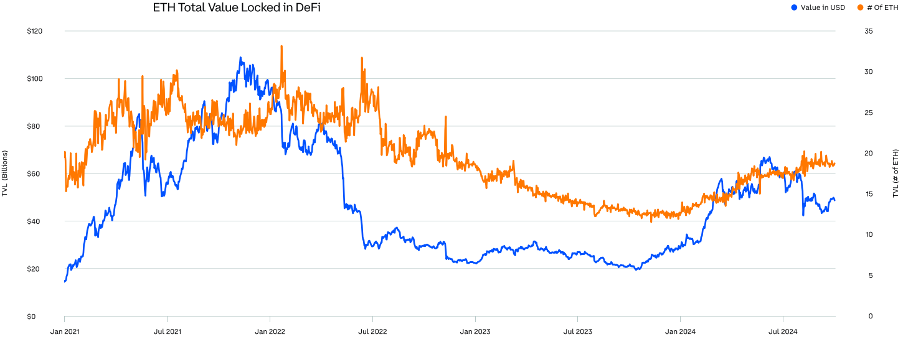
Staking has become the main source of ETH liquidity consumption.
As the ETH price retreated, market sentiment shifted from greed to fear, perhaps laying the foundation for the next rebound.