Individual investors are actively participating in Bitcoin (BTC) again. This time, their demand has exceeded the level seen in May 2020. This surge occurred at a time when BTC was aiming to reach the elusive $100,000 target.
However, will the return of individual demand be enough to push Bitcoin to new highs? This on-chain analysis evaluates the potential impact.
Bitcoin Leading the Broader Cryptocurrency Surge
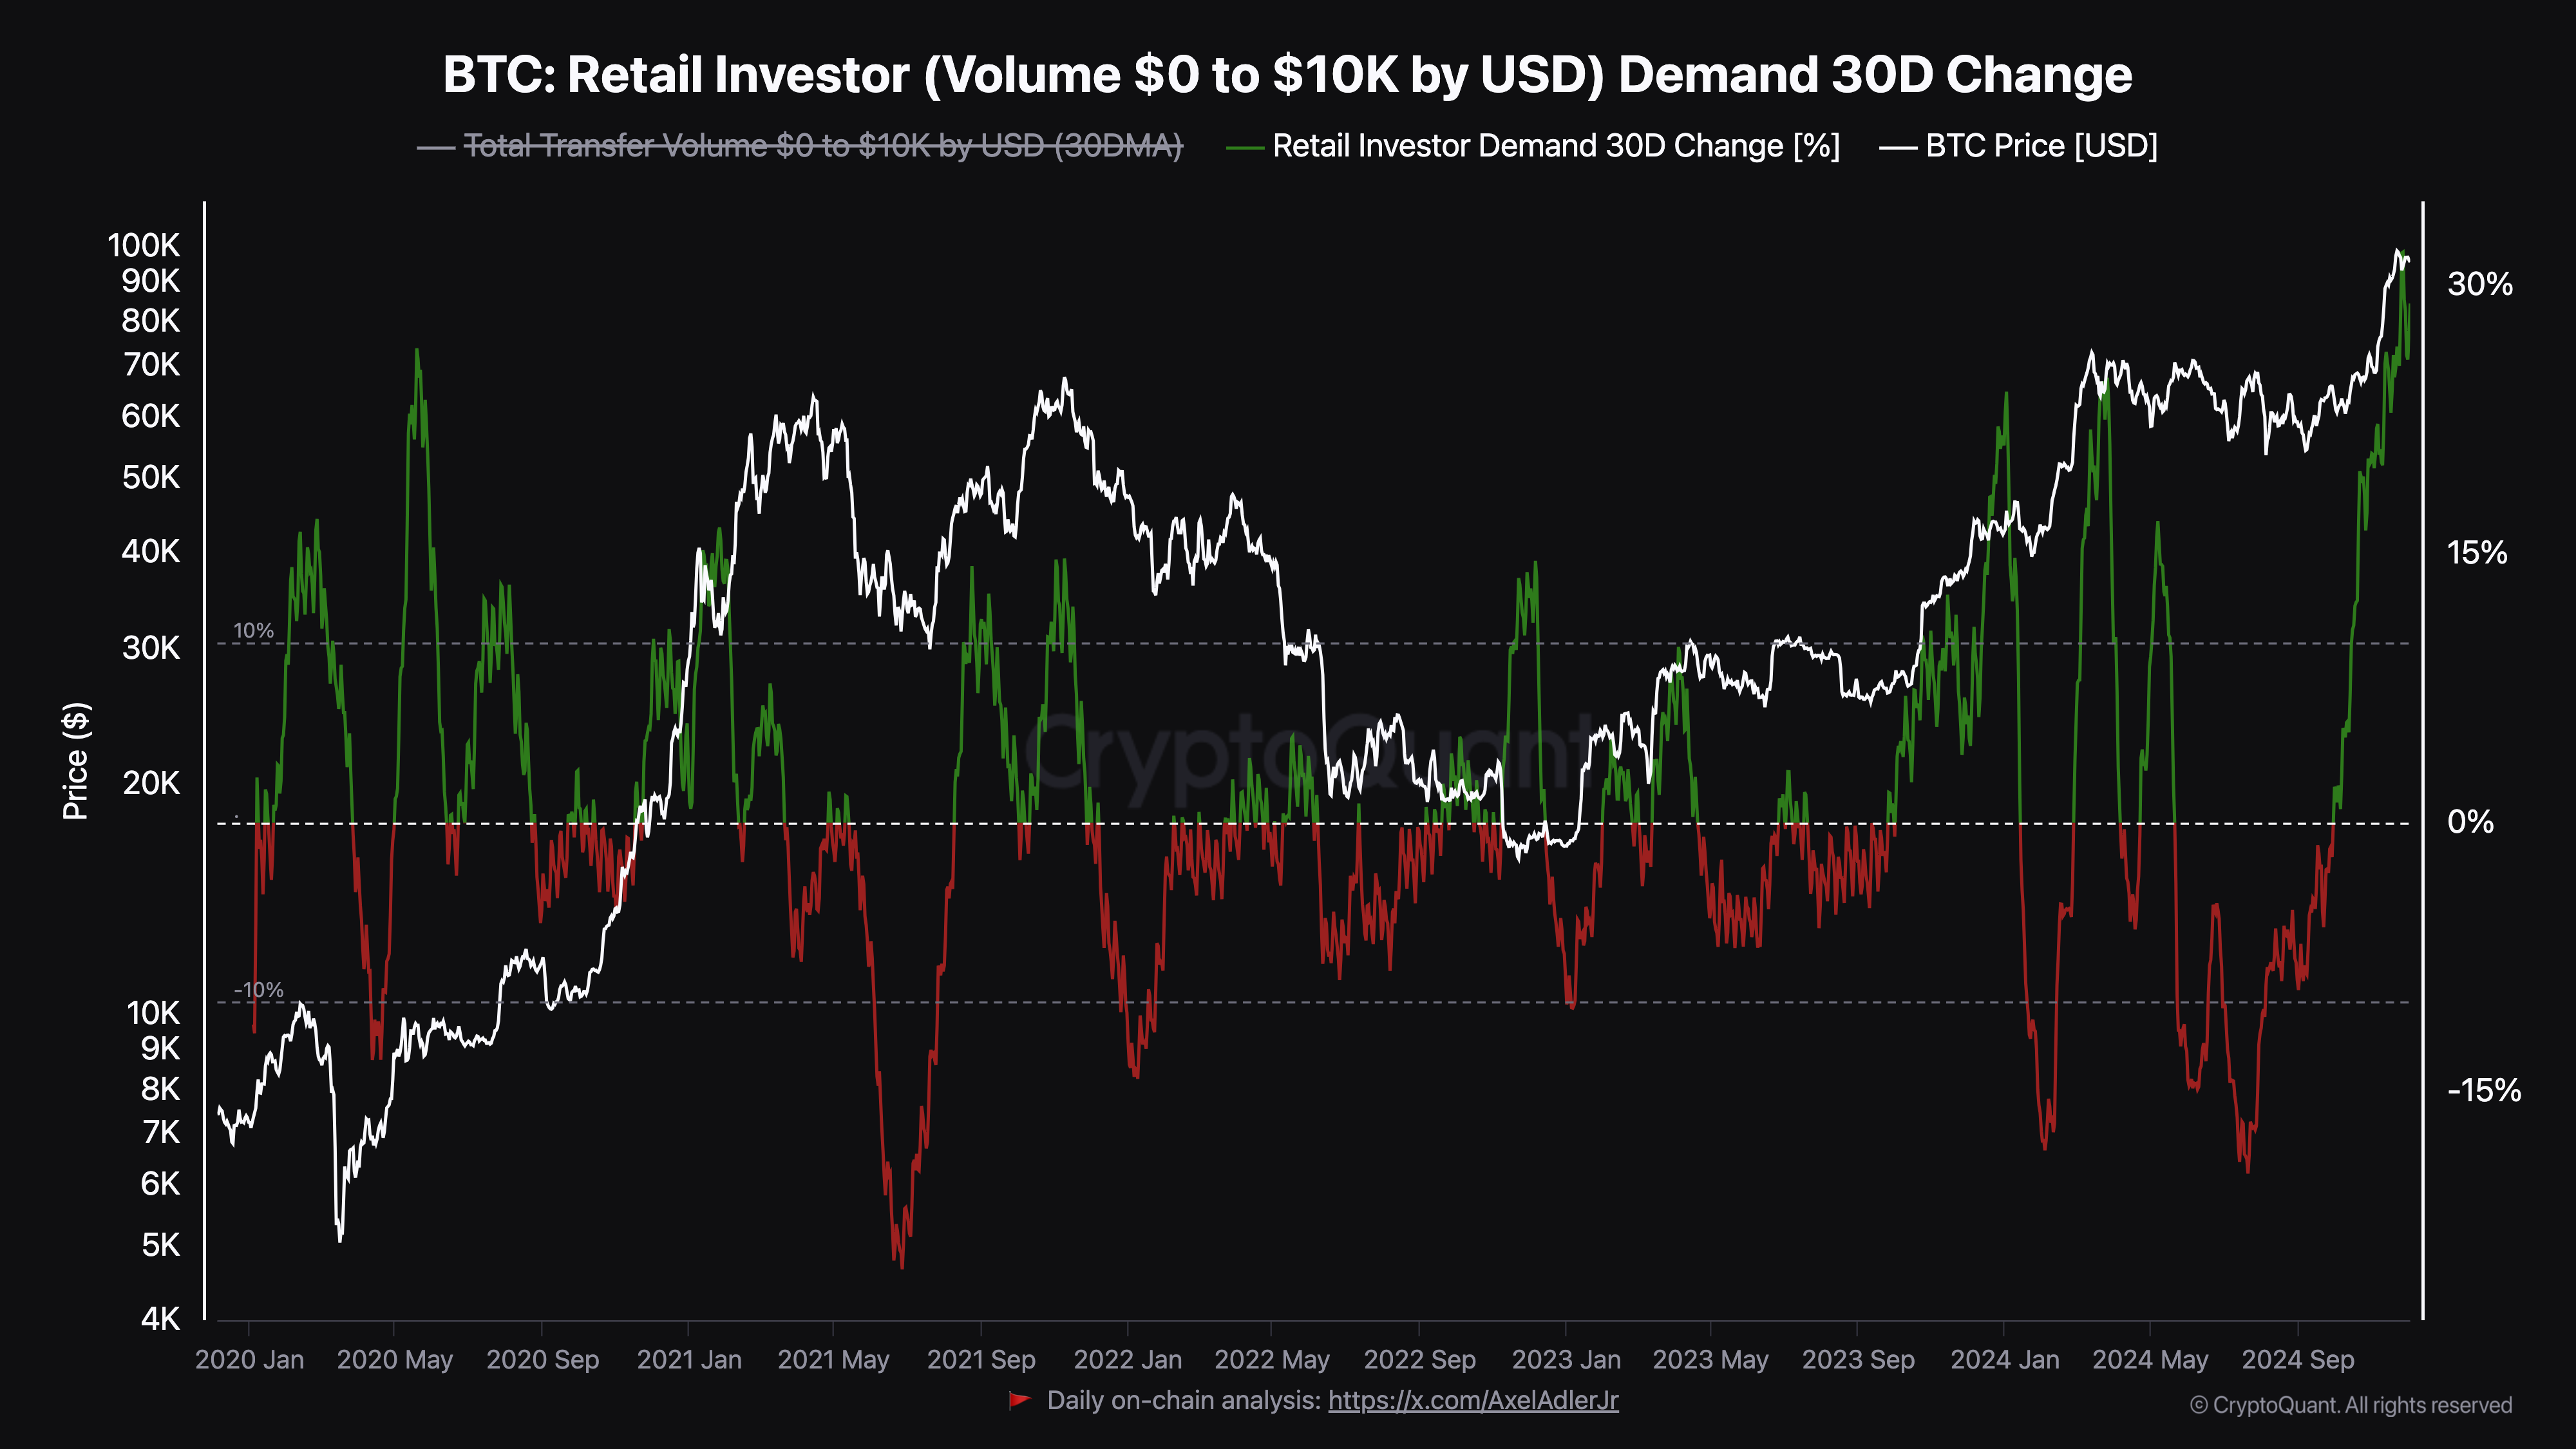
Historically, Bitcoin's price has surged after an increase in individual demand. However, this cycle has been primarily driven by whales and institutional investors.
But according to Cryptoquant, this trend may be changing. The 30-day individual investor demand metric, which tracks the flow of sub-$1,000 transactions into Bitcoin, suggests that the influence of individual investors is growing.
At the time of reporting, this metric reached 27.15, the highest level in 4 years. The last time it approached this level, Bitcoin's price surged from $9,500 to $37,000 in less than 6 months.

Therefore, if history repeats itself, BTC could break through $100,000 in a few months. However, an anonymous analyst from Cryptoquant, Darkposter, believes that a surge above $100,000 may not happen quickly.
According to the analyst, the increase in Bitcoin's individual investor demand could signal a local top. Darkposter mentioned in his post that the cryptocurrency could undergo a brief correction before the uptrend resumes.
"Bitcoin may consolidate for a while before breaking the psychological $100,000 barrier, and this breakout could reignite the frenzy of individual demand and trigger the euphoric stage of the market," the analyst explained.
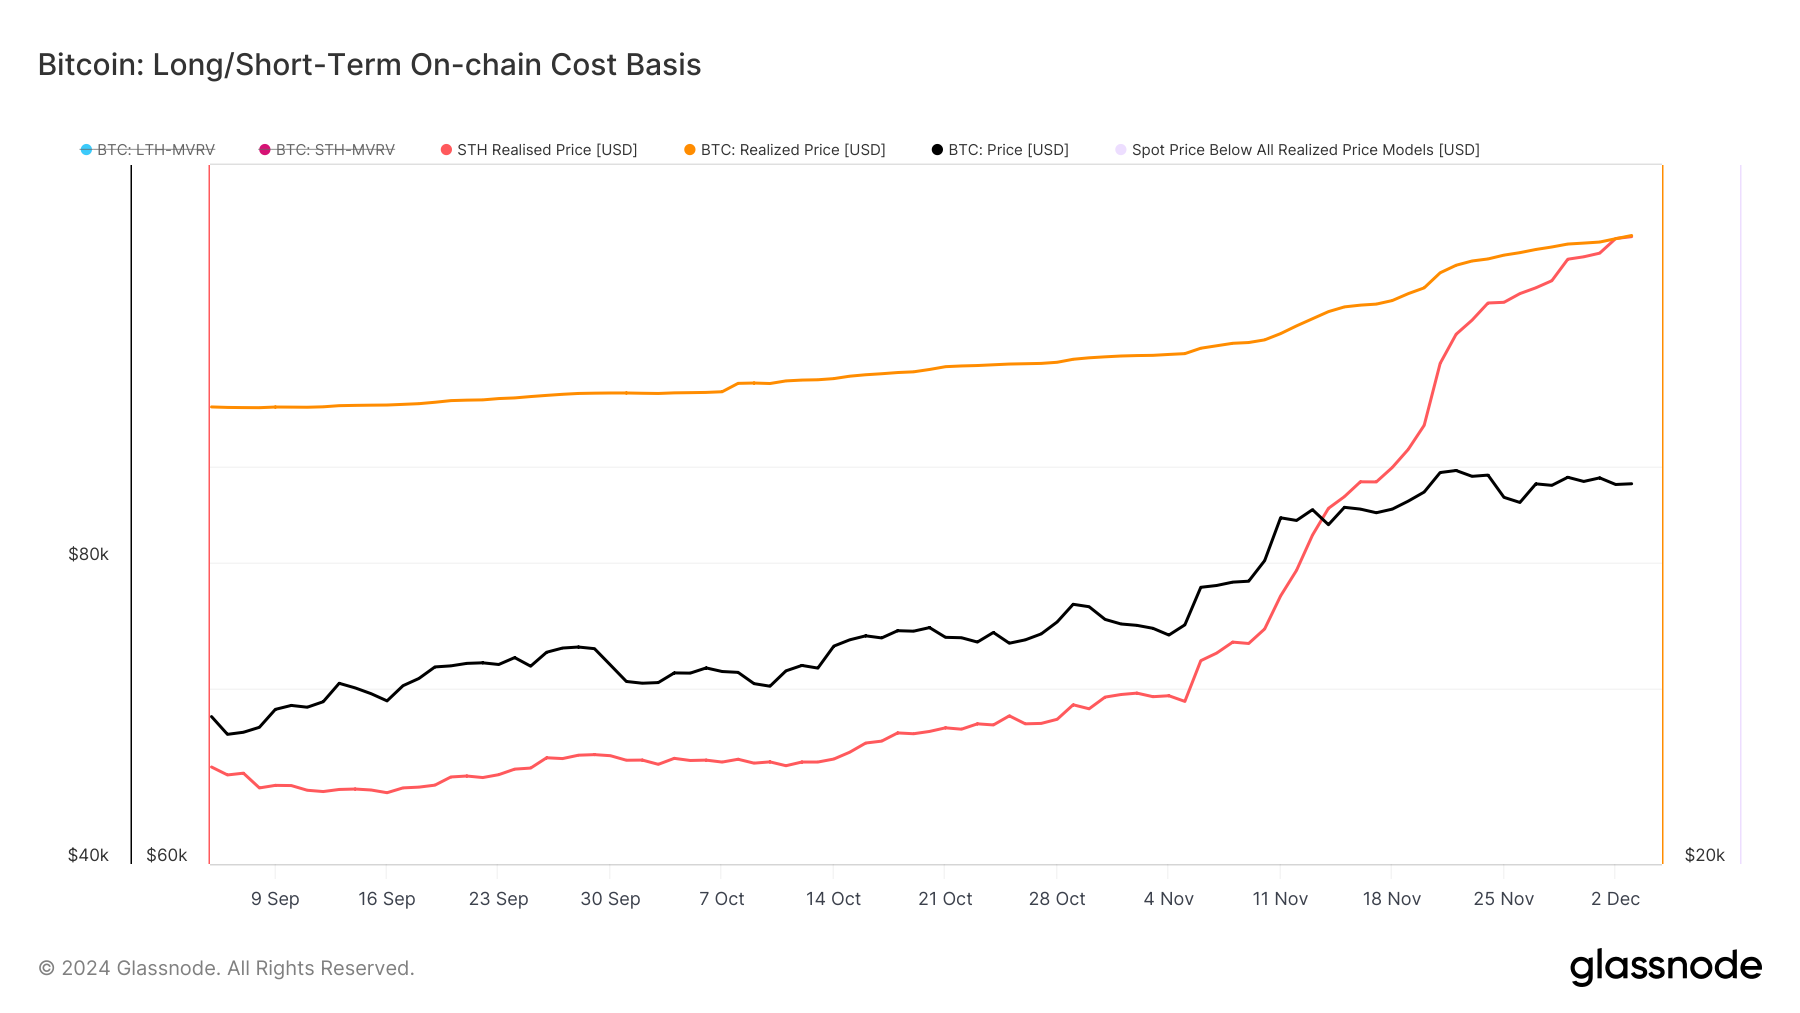
Moreover, according to Glassnode's data, the short-term realized price of Bitcoin, or the average on-chain acquisition value, is $77,675.

Generally, when the realized price is higher than Bitcoin's market value, the trend is bearish. However, with BTC trading above $96,000, the trend around the coin suggests a bullish sentiment and the potential for price appreciation.
BTC Price Prediction: $110,000 in the Short Term
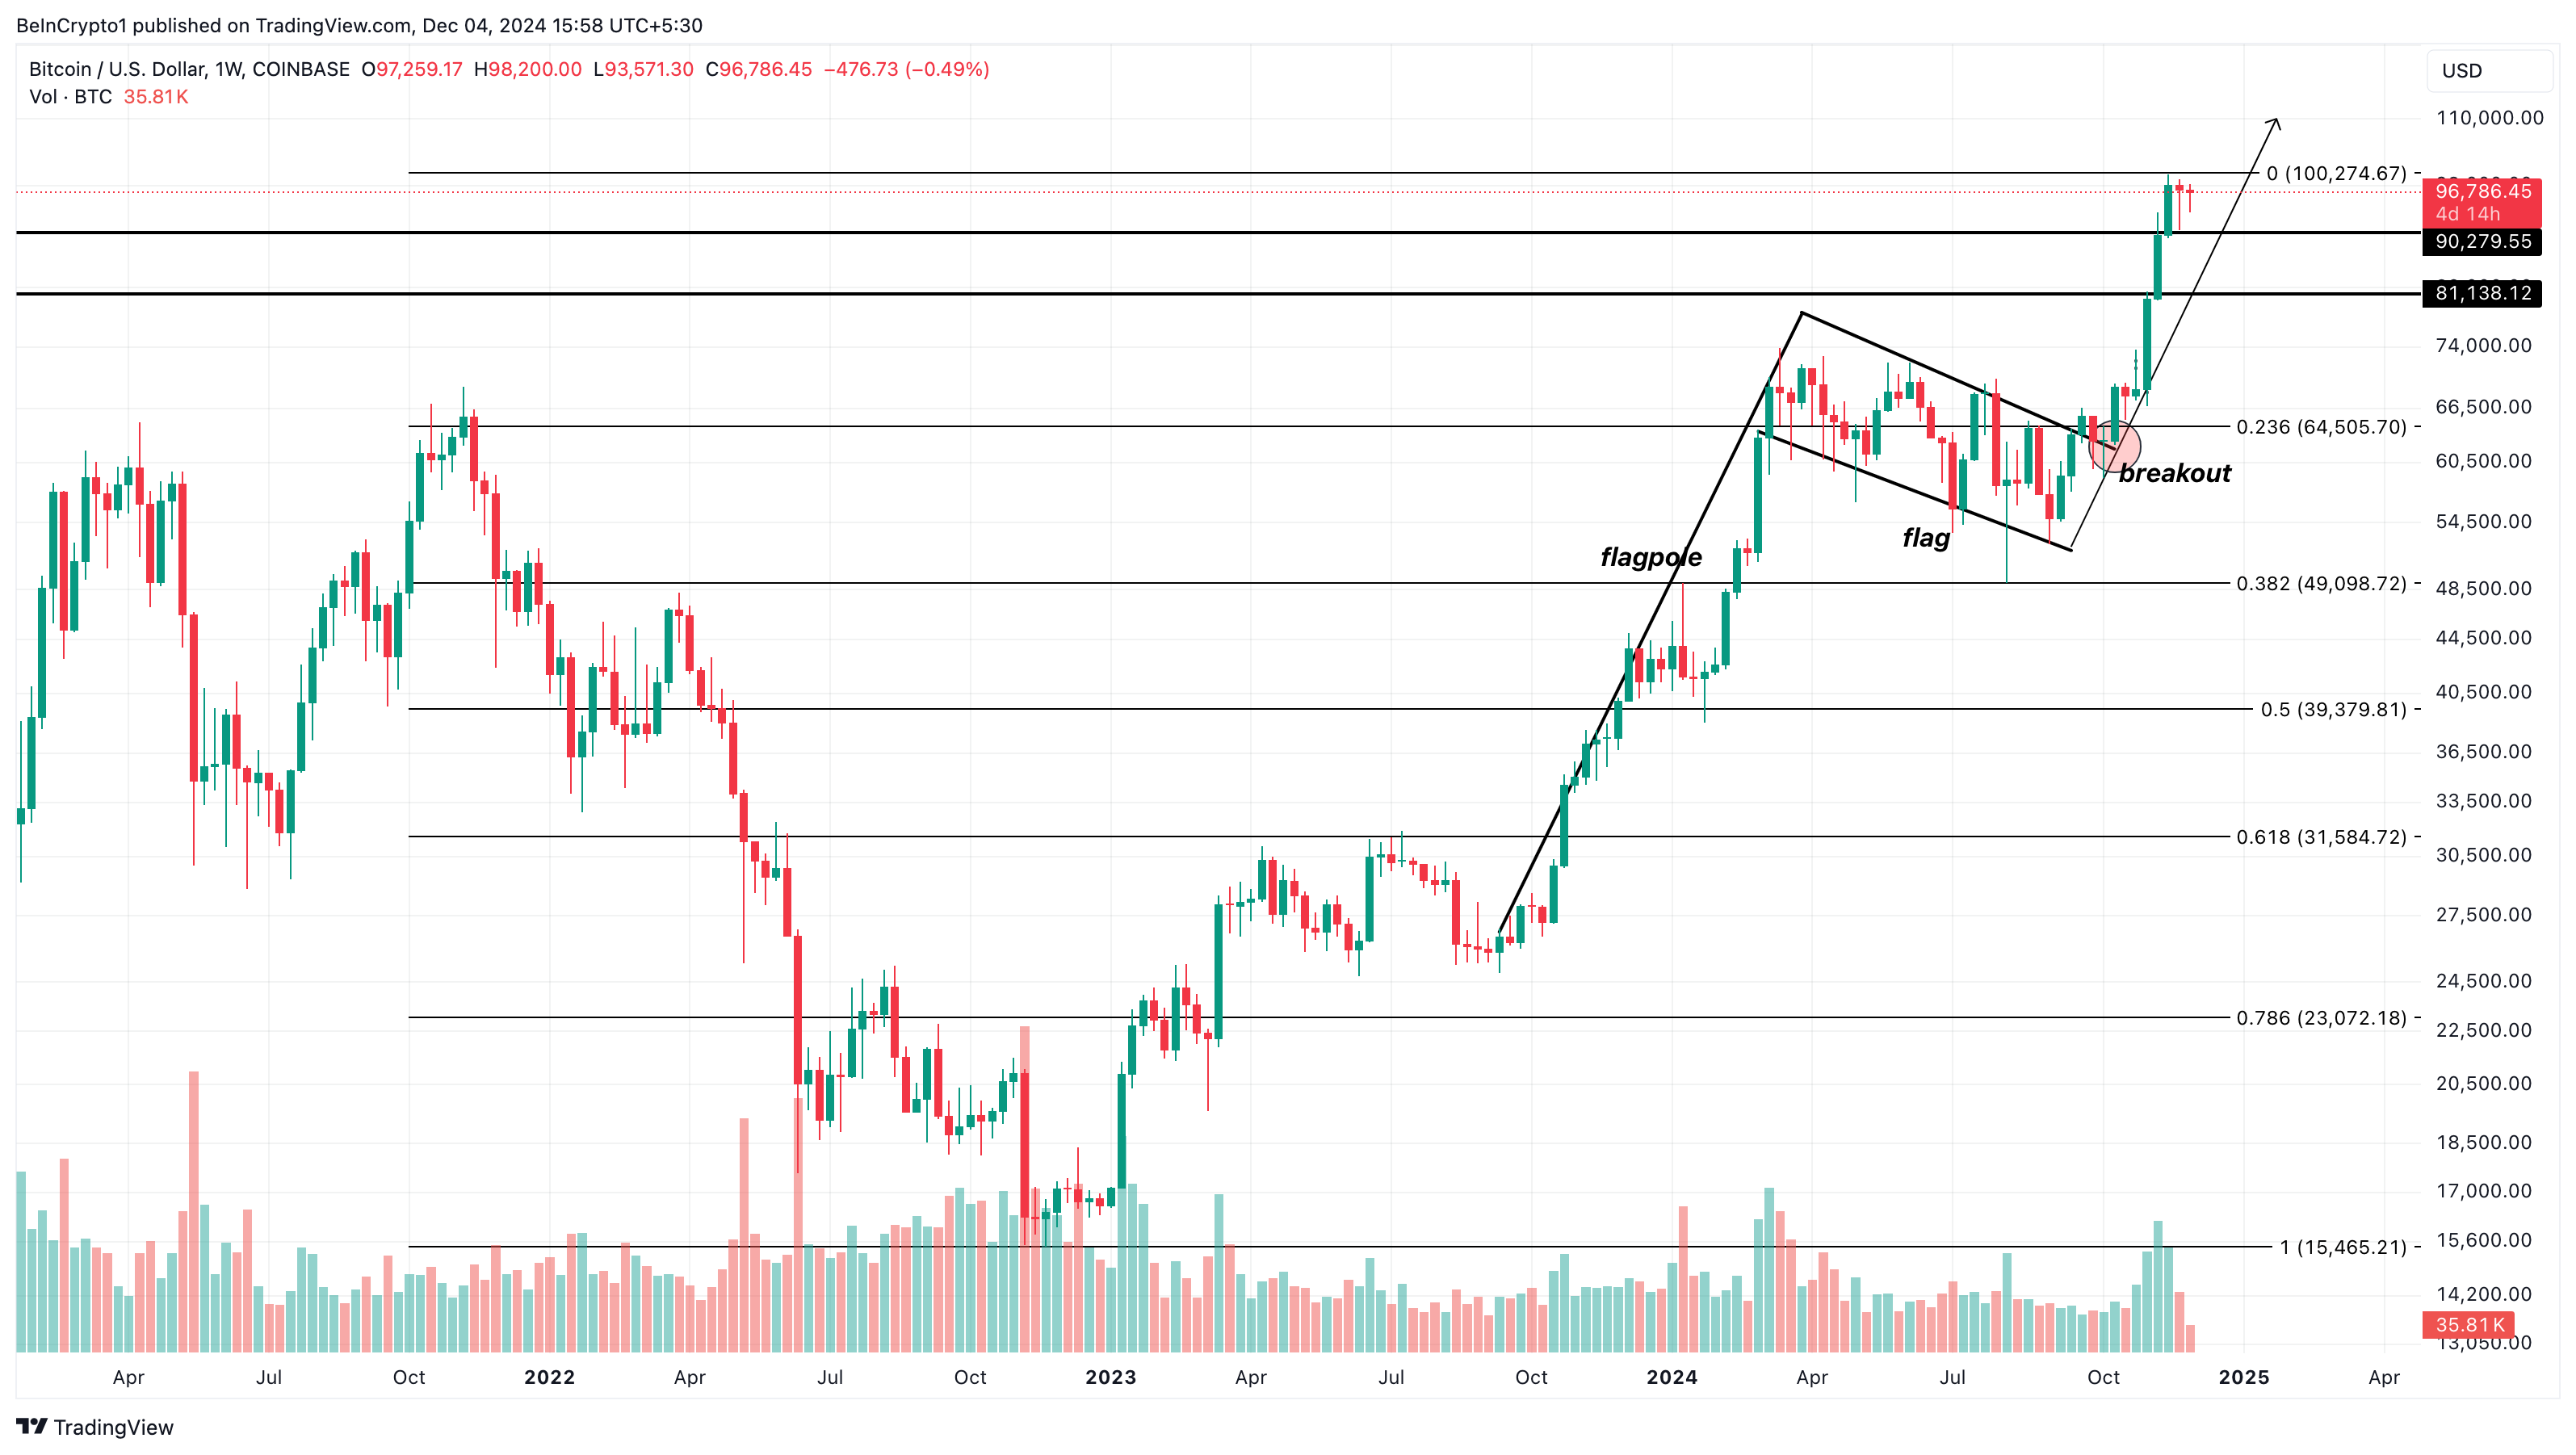
On the weekly chart, Bitcoin has formed a bullish flag pattern. A bullish flag is a strong bullish chart pattern characterized by two powerful rallies and a brief corrective phase.
This pattern starts with a sharp and almost vertical price surge, creating the 'pole'. This is followed by a consolidation phase with parallel support and resistance lines, forming the 'flag' itself. You can see it below.
Since BTC has broken out of this pattern, the coin's price could record higher values in the short term. If confirmed, Bitcoin's price could soon reach $100,274. In a very bullish scenario, it could even rise above $110,000.

However, if the demand for Bitcoin from individual investors decreases, this prediction may not materialize. In that case, the price could drop to $90,275.


