

Analysts expect the price of Bitcoin to consolidate by the end of February, as the Bollinger Bands indicator suggests an imminent breakout.

Since February 5th, the price of Bitcoin (BTC) has been consolidating in a narrow range between $93,300 and $98,500.
According to technical indicators and on-chain data, Bitcoin's consolidation may be nearing its end, and the price may be poised for a breakout. The key question is when Bitcoin will break out of the consolidation range.
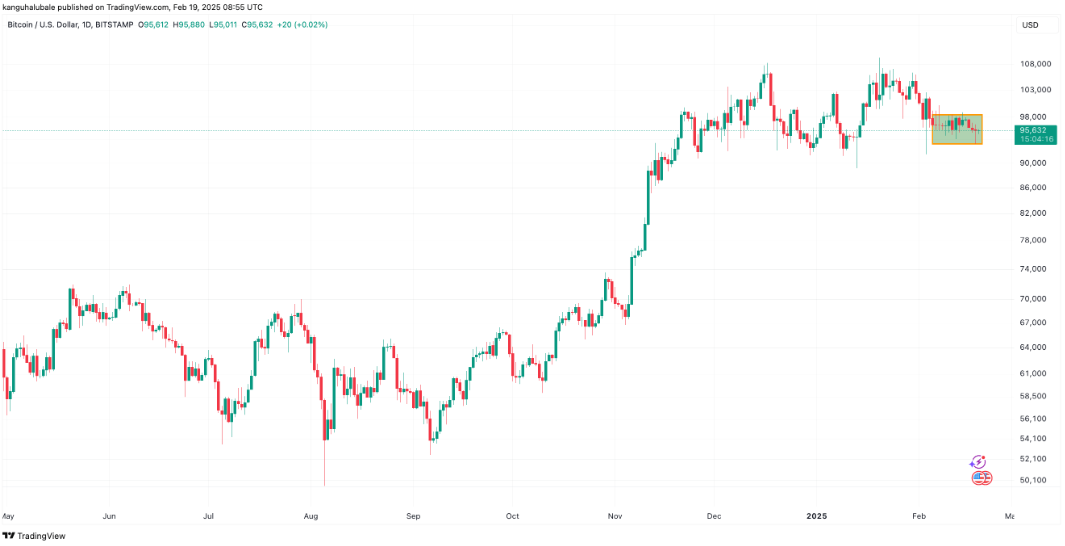
BTC/USD daily chart. Source: TradingView
Bitcoin needs to reclaim $98,000 to end the consolidation
Crypto analysts say that if Bitcoin fails to reclaim the $98,000 support level, its price may continue to consolidate within the current range for some time.
In his X platform analysis on February 19th, renowned Bitcoin analyst Tyler Durden pointed out:
- Bitcoin's price needs to break above the $98,000 level (the orange line in the chart) to confirm an upward breakout.
- If it fails to do so, Bitcoin may break down and fall to $74,000.
"It must break the orange line this week, otherwise it will break out of the range and fall back to $74,000."
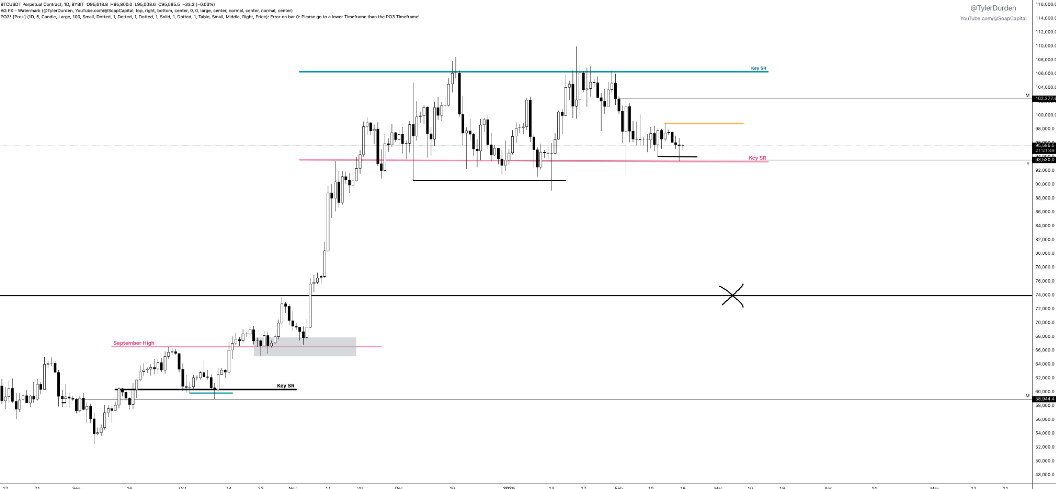
BTC/USD daily chart. Source: Tyler Durden
Independent analyst Jelle: Bitcoin consolidation may last until the end of February
Independent analyst Jelle believes that Bitcoin's current consolidation cycle may last until the end of February. Jelle stated:
- On the weekly timeframe, Bitcoin's price is forming a bullish pennant.
- As long as BTC/USD remains above the pennant's downtrend line (around $93,000), the overall structure remains strong.
- If it breaks above the pennant's upper trendline, it will confirm a bullish breakout.
- The consolidation cycle is expected to end "within the next two weeks", after which BTC may rise to $140,000.
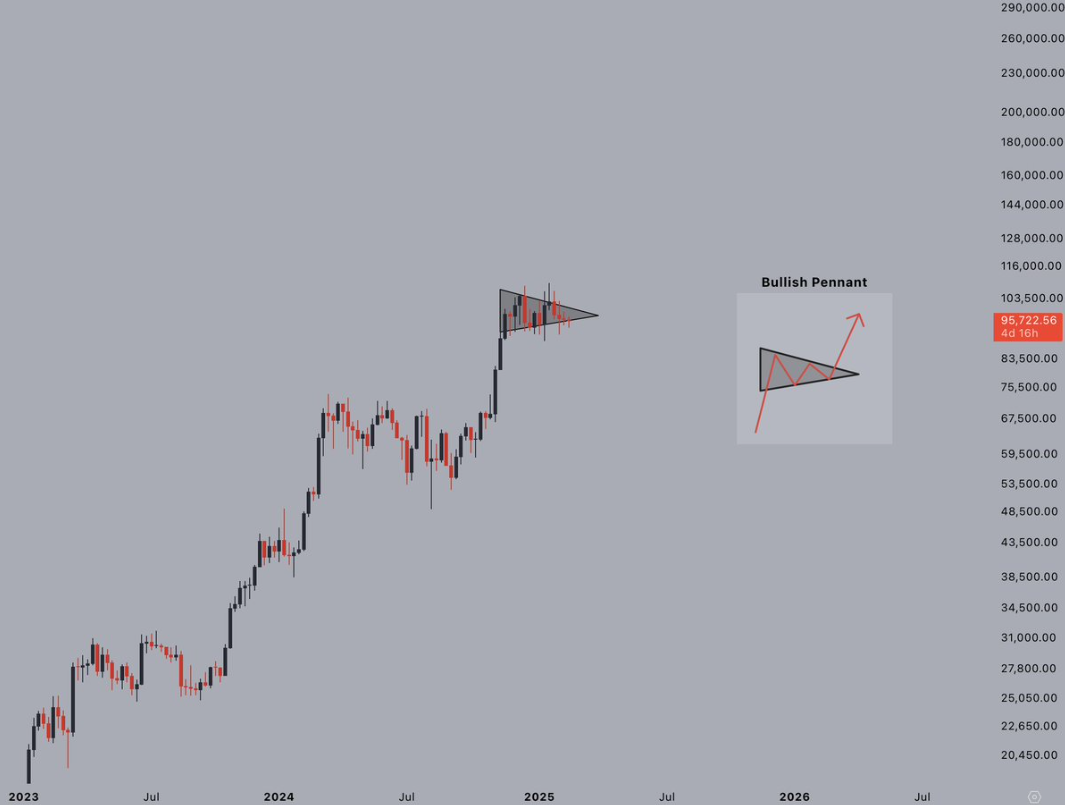
BTC/USD weekly chart. Source: Jelle
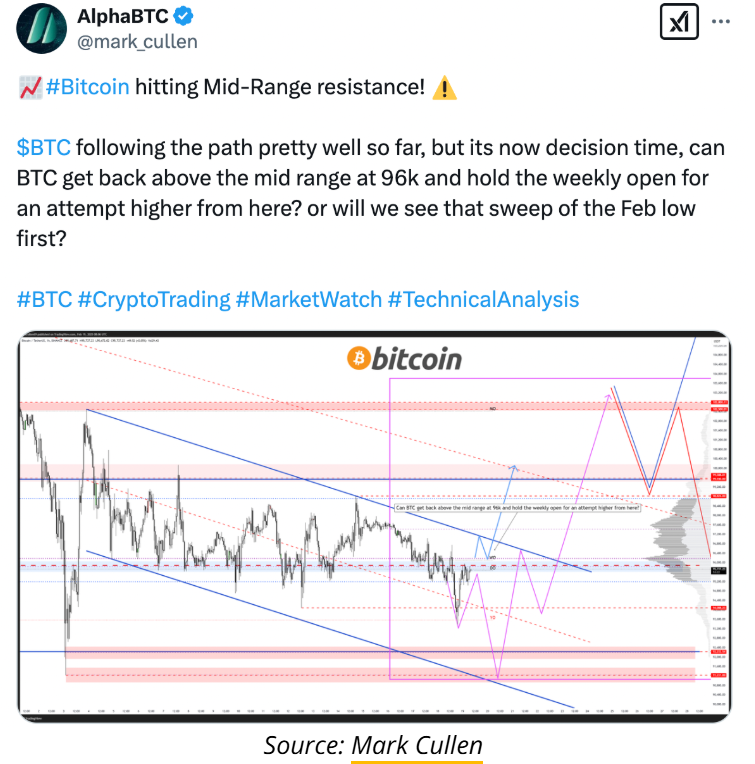
Analyst Mark Cullen believes that Bitcoin's ability to continue its uptrend depends on its ability to reclaim and hold the "$96,000 midrange" level, which is also this week's opening price.
Bitcoin consolidation is about to end - Bollinger Bands indicator
The expectation of a Bitcoin price breakout remains in the background, with the Bollinger Bands indicator suggesting an imminent breakout.
Key points:
- The narrowing of the Bollinger Bands suggests a breakout may be imminent.
- The daily Bollinger Bands width has dropped to an extremely oversold level, touching the lower green line.
- The current Bollinger Bands width is more contracted than when Bitcoin's price was at $68,000 in November 2024.
- At that time, BTC/USD rallied 46% from $67,300 on November 5, 2024, to $99,317 on November 22, 2024.
- The indicator also contracted similarly in January 2024, after which Bitcoin's price surged 94% from $40,000 on January 24, 2024, to $73,800 on March 14, 2024.
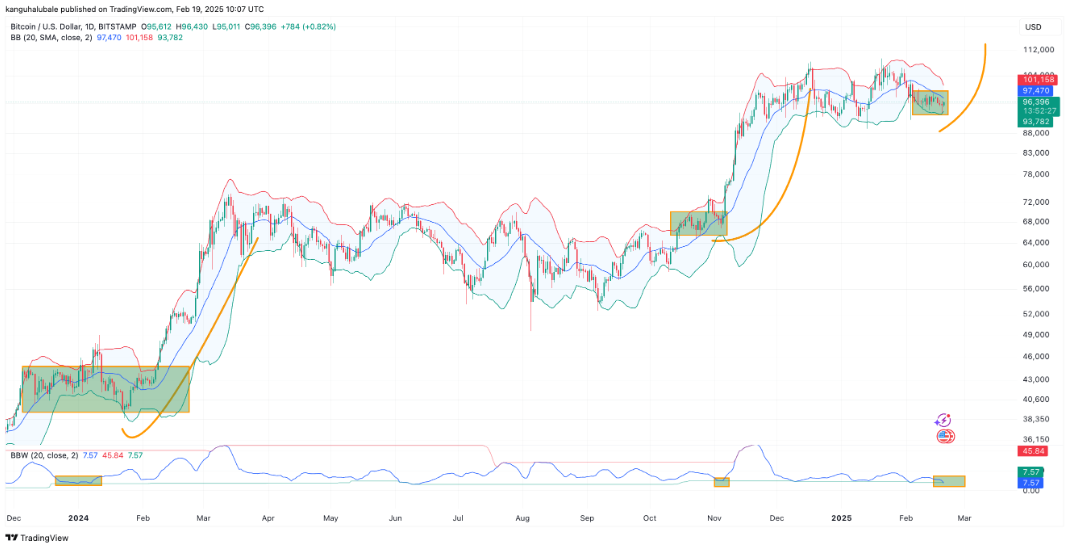
BTC/USD daily chart. Source: Cointelegraph/TradingView
If history repeats itself, Bitcoin may soon break out of its consolidation and embark on a significant rally in the coming days.


