

Author: Dragonfly
Compiled by Felix, PANews
Reliable salary data in the crypto sector is extremely scarce. Dragonfly previously released its first salary-related dataset and analysis report (2023). Now, Dragonfly has released another report, covering 85 cryptocurrency companies, collected from the end of 2024 and the first quarter of 2025. The report also expands its research scope to include data from approximately 3,400 unique and non-duplicated employees and candidates, and where relevant, compares the findings with the 2023 report. PANews has excerpted some key points from the report; the following is a detailed description:
Highlights
Most crypto companies are in growth mode, but not hypergrowth mode.
Hiring in the crypto industry has been global from the start, with US-only hiring being almost non-existent.
Europe is a major international center.
Base salary and token compensation decreased across almost all levels and regions.
Remote work is still prevalent, and major companies have no plans to change this status quo.
The crypto industry is difficult to enter, with less than 10% of positions being entry-level.
The engineering sector dominates.
US salaries are the standard for engineering leadership positions worldwide.
Salary situation
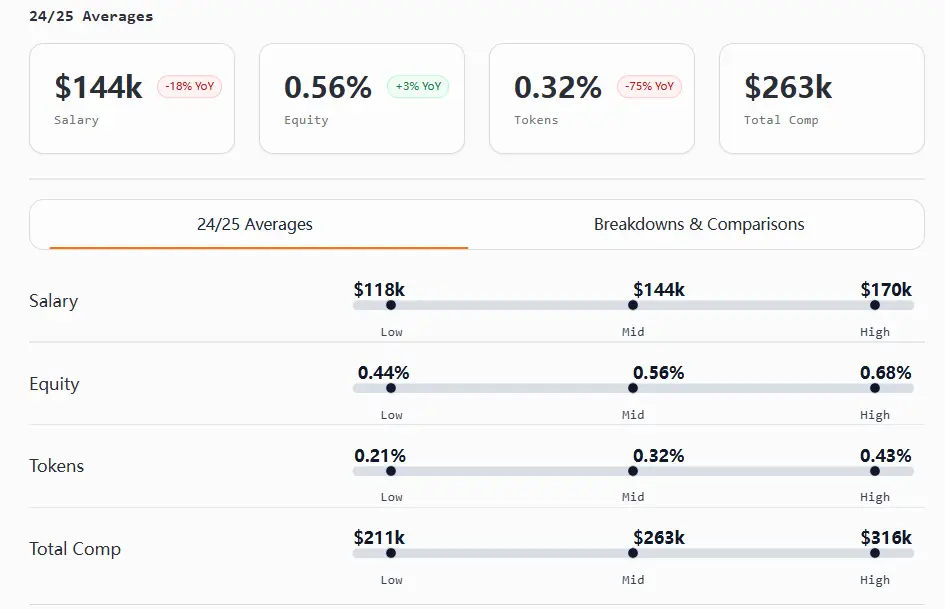
Overall, crypto industry salaries in 2024 and early 2025 are in a downward market, and its salary system is still relatively immature compared to traditional industries.
Salaries and token awards declined across nearly all levels. US-based roles still lead in cash compensation, while international teams are closing the gap by offering larger equity and token awards. Equity distribution is uneven, particularly for non-technical, non-executive roles. US-based compensation has narrowed, while international roles can sometimes reach 2 to 10 times US levels.
By stage of development, the expected pattern holds true: early-stage companies offer lower salaries but more equity (often double), while later-stage teams see the opposite. Tokens are becoming less common overall, but remain significant in Go-to-Market (GTM), Product, and senior international roles.
Entry-level positions were hit hardest, with salaries plummeting and bonuses shrinking, though equity awards increased. New U.S. hires still received higher cash packages, but their international counterparts typically received two to three times as much equity and larger token awards.
Mid-level employees are being squeezed and facing limited growth, while senior employees are in a better situation, with smaller pay cuts, more stable equity, and increasingly concentrated tokens at the top.
Senior ICs (independent contributors) and executive management saw the largest salary increases, particularly in product and engineering.
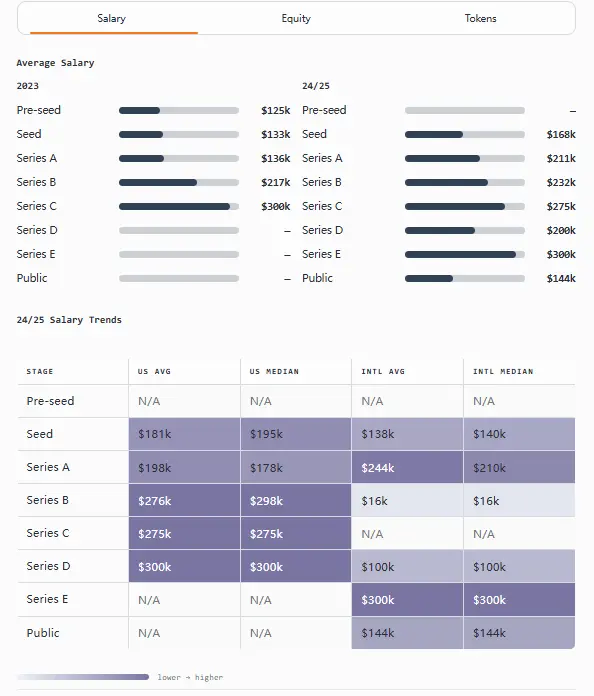
Salary benchmark
Below are salary data for positions such as software engineering, cryptography engineering, developer relations, product management, design, marketing, and market development.
For the first time, international engineering executives earned more than their US counterparts (with total compensation ranging from $530,000 to $780,000), thanks to a nearly 3% increase in token rewards.
For crypto engineers, the “certainty vs. upside” trade-off is clearer than ever. US engineers lead in cash and total compensation at nearly every level, while their international counterparts lead in equity and token rewards at both entry-level and mid-level positions.
Product management executives earn the highest salaries of all roles ($390,000-484,000), with total compensation comparable to or higher than engineering roles; equity awards in international product management are typically approximately 2 to 10 times higher than in the United States.
Developer relations has become the most “borderless” function, with almost identical salary ranges globally and smaller differences at the manager and executive levels (the US leads in equity and total compensation; the international sector leads in tokens).
Design leadership is not as highly valued as senior designers. In the US, ICs (principal/senior) in design positions surpass managers and even some executives in total compensation.
Marketing exhibits regional disparities in compensation and ownership. The US leads in salary and total compensation, while international companies' equity is approximately 3 to 10 times higher than US levels.
The gap in GTM total compensation narrowed between entry-level and manager-level compensation. Senior ICs surpassed managers in total compensation, while international business unit leaders won in equity.
Founder compensation
In this report, company ownership is broken down into equity and tokens (as opposed to prior reports where they were combined). As a result, salary analysis is reported on a year-over-year basis, while equity and token data reflect 24/25 year data.
Founder compensation has increased compared to last year. In general, higher rounds are associated with higher salaries and lower equity (as expected).
US founders generally earn more than their international counterparts in salary, equity, and tokens.
Key points:
The average founder salary is projected to increase by approximately 37% year-over-year, from $144,000 in 2023 to $197,000 in 2024/2025.
US founders in seed rounds own the highest percentage of equity (32%).
In the seed round, the token holding ratio in different regions was relatively stable (9%), but in the later stages, the differences were significant.
A rare exception: In Series A rounds, international founders received higher salaries than US founders ($244K vs. $198K), while US founders held more tokens (13% vs. 9%) and a slightly higher percentage of equity (20% vs. 19%).
A rare exception: In Series B rounds, international founders reported owning the highest percentage of equity (30%), but this figure is based on limited data and should be interpreted with caution.
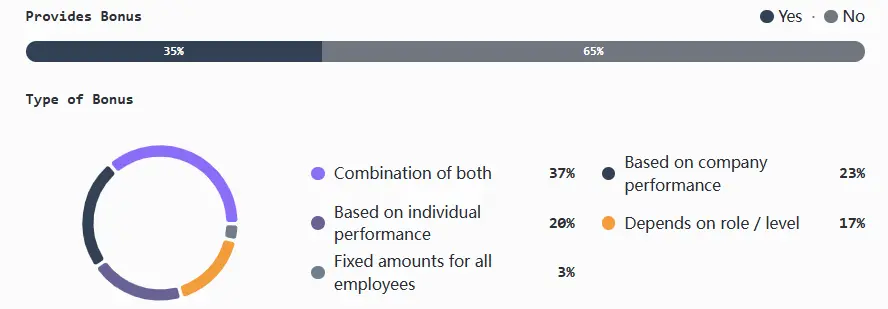
Bonuses and variable pay
Bonus usage decreases with company size: smaller and early-stage teams are most likely to experiment, mid-sized companies adopt them selectively, and late-stage and infrastructure-focused companies taper off their use in favor of long-term incentives.
Where bonuses exist, they are typically linked to both company and individual performance (a mix). Links to company only, individual only, and position/level-based models are less common, and fixed bonuses are also rare.
Key points:
Bonuses peak at the smallest companies (1-5 employees) and at the earliest stages (Seed/Series A), particularly among companies raising $5 million to $19.9 million.
CeFi has the highest adoption rate at 71%; DeFi is 50%, mainly driven by the United States and more focused on individual performance; Infrastructure/L1/L2 adoption rates are much lower (15-30%) and are usually a hybrid model.
The bonus packages in the United States are more friendly, especially for medium-sized teams.
Exception: Some well-funded post-Series C teams report facing an “overwhelming number of applicants” problem due to a surge in onboarding demand and increased brand awareness.
The exception: Infrastructure companies face the most widespread challenges: 63% cite talent shortages, 27% mention compensation, 5% mention competition, and 5% mention remote/global recruiting (the only sector to mention this issue).
Token Compensation Analysis
Many teams are increasingly separating tokens from equity when calculating token grants. In later stages, it is common practice to tie grants to fair market value, most commonly using time-weighted average price (TWAP).
In terms of vesting, most teams follow a four-year schedule with a one-year “cliff,” but some teams are experimenting with hybrid models that combine time-based and milestone-driven unlocking.
Most companies distribute tokens from a dedicated pool of employee tokens, with a few very large organizations still allocating grants from the total supply, but these are becoming increasingly rare.
Compensation structure (cash, tokens, equity)
Early-stage teams rely heavily on equity to maintain token flexibility. Mid-sized organizations often move to a hybrid model (equity + token) to provide a risk-adjusted compensation structure and additional liquidity. Most later-stage companies shift back to equity once the dynamics of company value and token liquidity become more stable.
Key points:
Nearly half of international teams (44%) offer only tokens, while the opposite is true for US teams, with only 39% offering only equity.
Early-stage companies rely heavily on equity (about 71% when the number of employees is 1-5), and mixed compensation peaks in Series A and gradually tilts towards equity thereafter (45% in Series B and 71% in Series C).
Protocol-intensive areas like L1, L2, and DeFi naturally tend to favor token-based compensation, while infrastructure, consumer, and CeFi companies default to equity.
Among the teams before TGE, nearly one-third only offered equity and token payments, and mixed payments accounted for 32%; once the project was launched, the teams relied heavily on token payments (47% only offered token payments, and 47% offered mixed payments), and pure equity payments were almost zero.
Rare exceptions: A very small number (5%) only offer cash payment
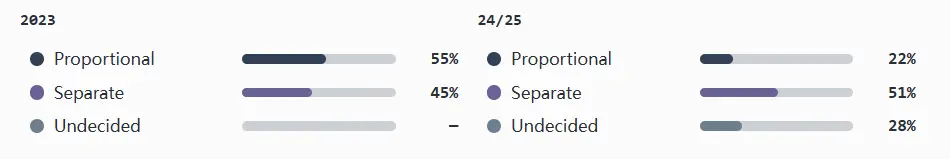
Equity / token relationship (ratio)
Only a few teams have established a proportional relationship between equity and tokens, where the company determines future token grants based on an individual’s equity share.
Before the TGE, this was the norm, but as companies matured, almost all of them severed this connection. In the later stages, equity and tokens were viewed as completely different things.
Key points:
51% of companies consider tokens and equity as separate compensation elements (with no proportional correlation); this is common by Series D and beyond.
The ratio model remains most common in the pre-seed/TGE stage (33%), but overall, its use decreases as companies grow.
Case: 90% of L2 companies have no proportional relationship and none are yet to be determined.
Region does not affect the proportion
Vesting Schedule and Start Date Convention
Pre-TGE companies (particularly in the DeFi and Level 1 sectors) often begin vesting at the TGE to manage retention and circulating supply. Teams with circulating tokens typically begin vesting on employee start date (the most common approach). These practices are largely consistent across US and international teams, with the primary difference occurring with pre-TGE teams.
Most companies use a standard time-based vesting schedule, typically a four-year plan with a one-year "cliff period."
A few teams have explored performance-based attribution, or a combination of performance and time. Anecdotally, teams are cautious about tying attribution to network-level KPIs (which are difficult for individuals to control), and instead focus on auditable product, team, and individual milestones.
Key points:
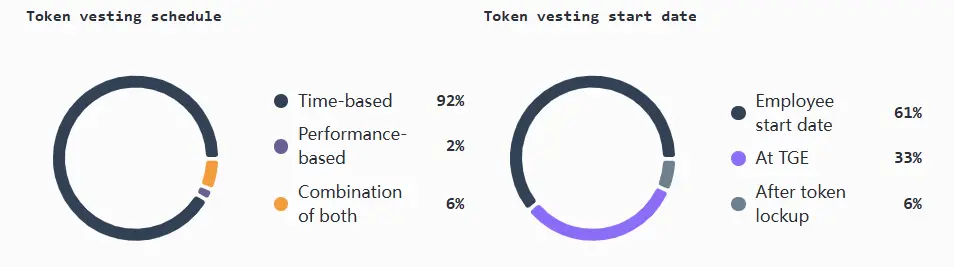
61% of companies begin vesting employees on their first day of employment
59% of the pre-TGE team began to vest at the TGE
Vesting arrangements are mostly standardized, with 92% of companies using time-based vesting, typically completed over 4 years, with the first year being a “cliff period”.
Exceptions: Only a few companies deviate from standard time-based vesting: 6% use a hybrid time and milestone model, and 2% rely entirely on performance-based arrangements.
Geography and remote work
Recruitment Footprints
Global-first is the default mode, with most teams hiring internationally from day one. Talent access and flexibility are generally more important than location.
US-only hiring is rare, primarily seen in the Seed and Series A rounds, and gradually disappears as a company grows. International-only hiring remains stable across all stages and sizes, often reflecting a cost-conscious hiring strategy.
Key points:
Globalization has become the default choice from day one, with 81% of companies hiring both in the U.S. and globally.
Smaller teams tend to hire globally earlier. Companies with 21-100 employees and $20-40 million in funding are the most stable, even more so than larger companies.
Infrastructure teams are most likely to hire internationally, at 80%.
Rare exceptions: US-only hiring is almost non-existent, accounting for only 6%. This strategy was mainly adopted by early consumer and DeFi teams, but they also abandoned this practice as they scaled.
International employee locations
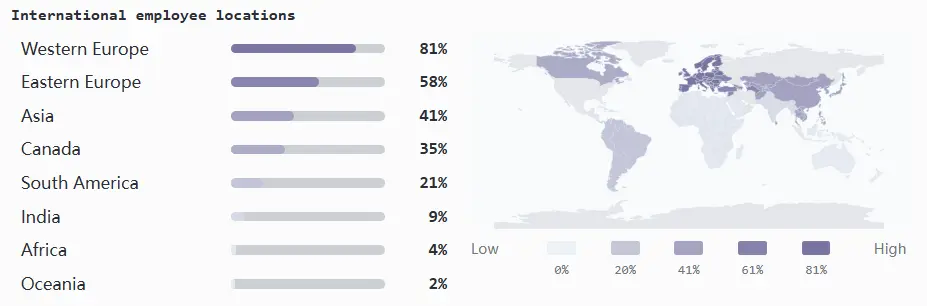
Western Europe is the main international recruitment center.
As companies mature and require stronger local operations, there is often a shift toward regional hiring in the later stages of the Series B round, leading to expansion into Asia, Canada, and Eastern Europe.
Key points:
Western Europe: 84% of Series B-E rounds (and about the same percentage of those with $40M+ funding) employ locally
Eastern Europe: 63% of late-stage companies hire there, attracted by a strong engineering talent pool and cost-effectiveness.
Asia: Hiring nearly doubled year-over-year (from 20% to 41%) in response to stronger market adoption.
Canada: 38% of Series B to E companies expanded to Canada, leveraging its proximity to the US, favorable regulatory environment, and developer base as a hedge.
South America: Only 13% of Series B to D companies are expanding there
Rare exceptions: India (9%), Africa (4%), and Oceania (2%) remain underdeveloped
Regulation-driven changes in hiring
Regulation will be one of the most prominent external factors influencing crypto talent strategies from 2023 to 2024. In the United States, increased scrutiny surrounding trading, custody, and protocol activities will make compliance considerations a key factor in hiring decisions.
However, looking back to 2024 and early 2025, regulation had little impact on prompting companies to hire outside the U.S. The adjustments that occurred were primarily concentrated among larger, better-funded teams in the infrastructure and DeFi sectors (the two sectors most likely to own or issue tokens), as well as in the CeFi sector (which is more heavily regulated).
Companies with both U.S. and international teams were most likely to cite regulatory-driven initiatives, while companies with U.S.-only operations were largely silent, with only a minority considering changes.
Key points:
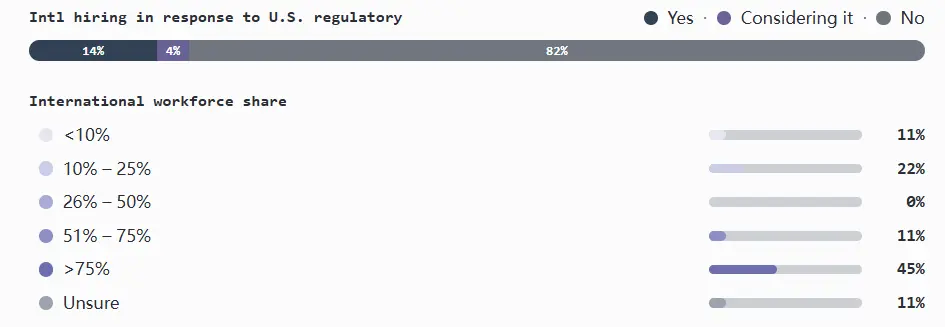
Overall, only 14% of companies have adjusted their recruitment strategies due to regulatory pressure.
Nearly a quarter of companies with employees both in the U.S. and abroad said regulation directly contributed to their decision to expand international hiring.
Among companies with only international employees, most had globalized for other reasons, but 21% acknowledged that regulation played a role.
Remote work and hybrid work policies
The crypto industry remains dominated by remote work, with most companies adopting a fully distributed work model. A hybrid model, combining remote work with mandatory office attendance, is next. A remote-first (office-optional) model occupies a smaller middle ground, with few companies operating entirely in the office.
The philosophy behind both models is strong, and overall, the policy is difficult to change: almost all teams plan to maintain the existing model.
Key points:
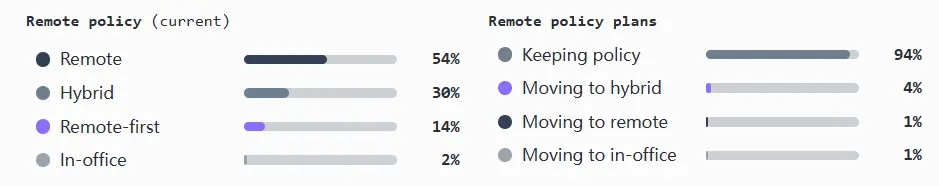
More than half of companies are fully remote, more than a quarter are using a hybrid model, and a smaller proportion, 14%, are remote-first.
94% of companies have no plans to change their policies.
US teams are more likely to prefer remote working (55%), while their international counterparts are more likely to prefer a hybrid approach (35%).
The working style of the team in the Series A financing was relatively mixed, but by the Series B financing, remote work accounted for 73%.
A rare exception: only 2% of companies work entirely in the office.
Organizational Structure and Recruitment Trends
Team and level composition
The crypto industry has long been dominated by engineers, a trend seen across all sizes, stages, and funding levels, from pre-seed to post-Series B. International teams tend to be more heavily engineered, while product and marketing leadership positions are heavily concentrated in the US.
From the perspective of team growth, the seed round team is mainly engineers; from round A to round B, senior product managers, designers and marketing teams (with fewer management personnel) were added; after round B, architecture was added in marketing and engineering.
Notably, the scarcity of entry-level job postings is limiting the talent pool and diversity, making it harder for new entrants to break into the industry (product and marketing are particularly challenging). Executive recruitment outside of engineering is also limited.
Key points:
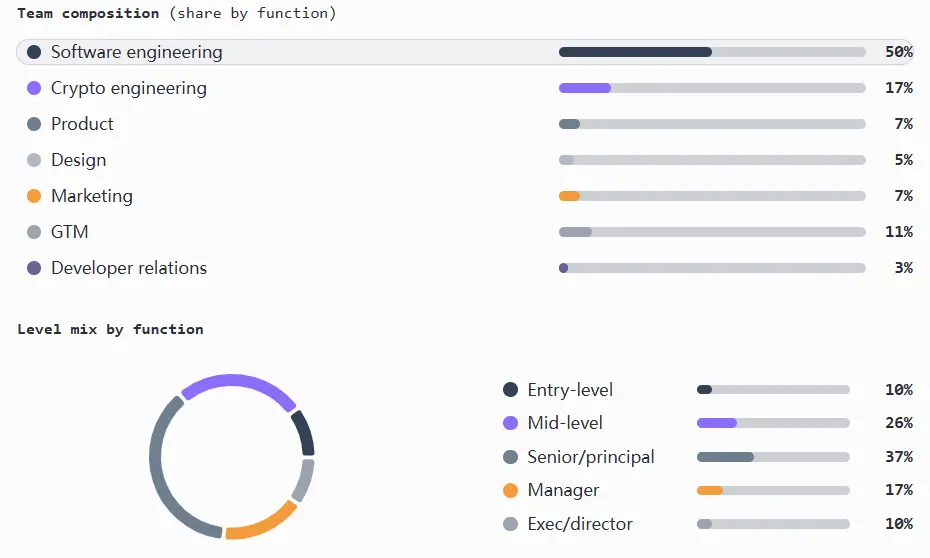
Engineering (software and cryptography) positions make up approximately 67% of total headcount, across companies of all sizes, stages, and funding rounds.
Entry-level positions only account for 10% of all jobs
Product departments are understaffed, with more than half of product managers at the senior or executive level.
The marketing department also has a small staff, accounting for only 7% of the total employees, with a slightly higher proportion of international teams.
The GTM department accounts for 11% of the total number of employees, mainly in mid- and senior-level positions
The developer relations department accounts for 3% of the total staff, mainly mid-level positions, and the salary is comparable to other departments.
Design department staff are mainly senior and lack leadership. About 44% are at the senior level, and less than 10% are at the manager or executive level.
Except for the engineering department, other departments are leanly staffed: the marketing/engineering ratio is 1:14, and the product/engineering ratio is 1:13
Rare exceptions: In some international teams, the ratio of product managers to engineers is as high as 1:20
Recruitment momentum across functional departments
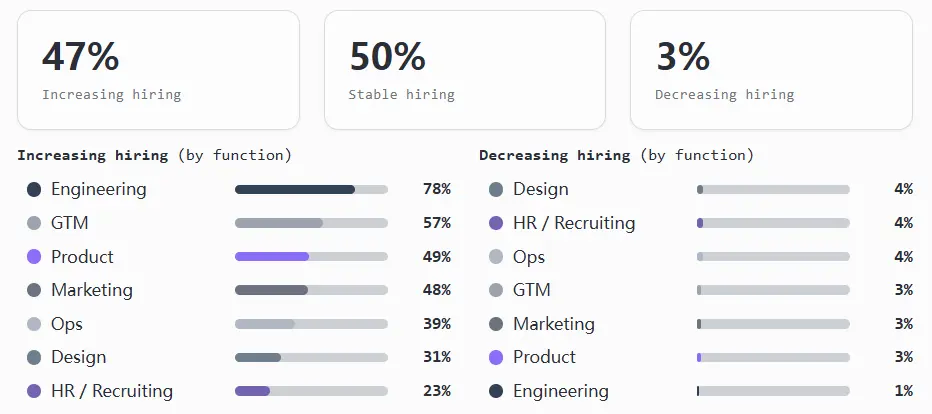
Most teams are in targeted growth mode, not hypergrowth. Overall, companies are selectively expanding their core teams while streamlining support teams. Many intend to maintain headcount, and few plan to reduce headcount overall.
Hiring momentum aligns with the team composition described above. Engineering is a clear priority, while Product and Marketing are growing steadily but cautiously. GTM (Sales, Marketing, and Operations) hiring is strong in expansion phases and in the Infrastructure and Finance sectors, but has slowed somewhat in Consumer, Gaming, and NFT companies. Design remains underdeveloped, while Operations and HR/Recruiting remain largely flat, potentially creating bottlenecks as technical teams grow faster than internal support.
Key points:
Engineering led the growth, with approximately 78% of teams expanding and only 1% reducing staff. It was also the only department with a true pipeline of junior-level hires.
GTM hiring increases with stage of development, with 57% of teams expanding and 40% remaining flat.
Product and Marketing remained stable, with about half of the teams increasing and half remaining the same.
Few teams expanded across the board; most expanded in 2-4 functions while keeping others constant, likely to simplify the hiring process.
GTM will only expand if senior and executive talent is already in place, and companies rarely expand by hiring for entry-level positions.
Slow growth often accompanies teams with a higher proportion of senior talent; once senior and executive management is in place in product, design, or engineering, those departments are more likely to remain stable and slow hiring.
Overall layoffs were small, at 3%, with slightly higher rates in design, operations, and HR/recruiting.


