

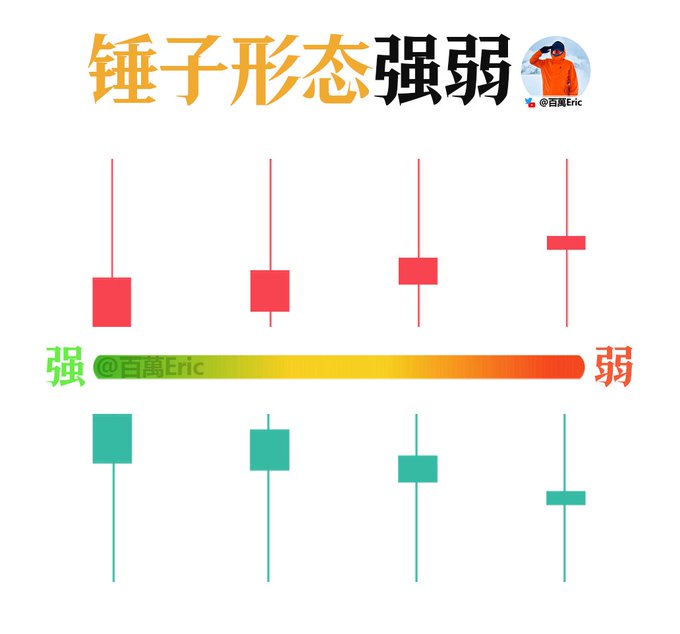
Those who see a long lower shadow and immediately shout "Hammer line, a reversal is imminent" are likely to lose money. To be honest, many of these hammers don't even count as signals. What's really interesting is that kind of green candle candlestick that crashes down but is then forcefully pulled back up, ultimately closing at the day's high. This indicates that the sell-off failed, the bulls are stronger, and it's only when it closes higher that a reversal can be considered possible. A slightly weaker result is a small positive candle with the body in the middle. This indicates that there are sellers below, but the buying pressure isn't particularly strong either, and it's barely holding on. Even weaker patterns, such as a bearish candlestick or a candlestick with an upper shadow longer than the lower shadow, are not hammer patterns at all; they indicate that the bulls' counterattack has been pushed back down. This indicates weakness. To put it more simply, the key to a hammer candlestick pattern isn't just the length of the shadow, but rather the relative relationship between the hammer candlestick and the price structure.
This article is machine translated
Show original
From Twitter
Disclaimer: The content above is only the author's opinion which does not represent any position of Followin, and is not intended as, and shall not be understood or construed as, investment advice from Followin.
Like
Add to Favorites
Comments
Share
Relevant content


