

Solana price has dropped by approximately 12% in the last 30 days. As 2026 approaches, the chart is showing both bullish and bearish signals.
Some indicators suggest a potential recovery in January, but selling pressure could persist if the upward momentum isn't clearly demonstrated.
History favors an upward trend, but ETF flows and expert opinions are Chia .
January is typically a strong month for Solana. Medium returns reach nearly 59%, with typical gains around 22%. This trend is even more pronounced if December is a month of price declines.
In 2022, SOL fell 29.6% in December, and by January 2023, SOL had rebounded by 140%. In December 2024, SOL fell 20.5%, while in January 2025 it rose 22.3%. This month, it has fallen 6.94% so far, which statistically suggests a potential recovery.
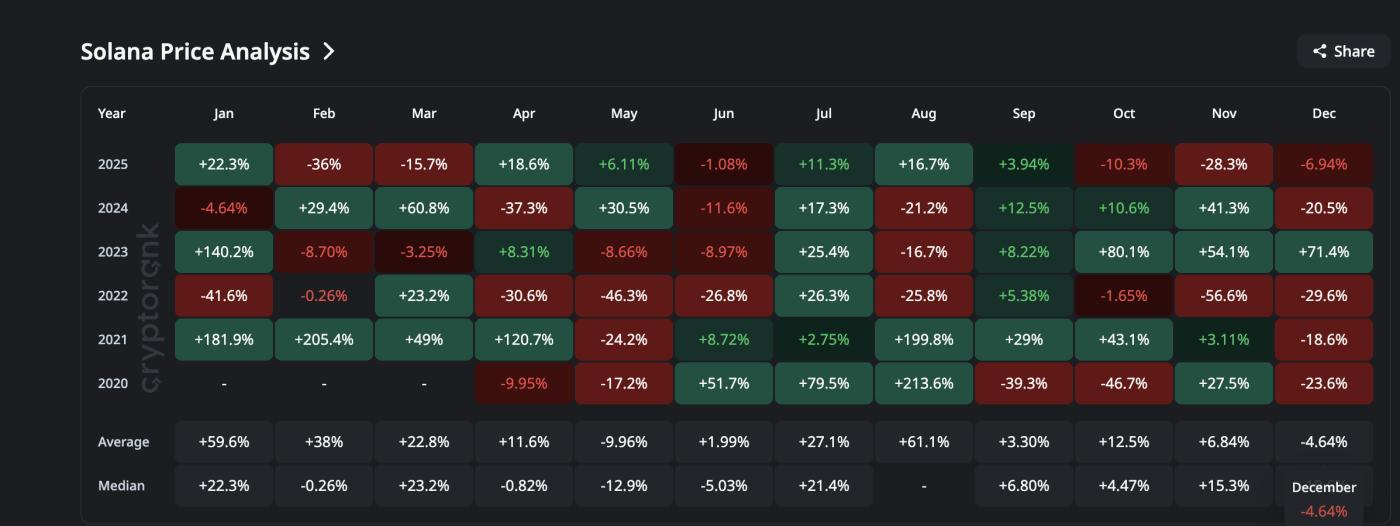 December saw a sharp drop – January rebounds: CryptoRank
Want to read more Token analysis? Sign up for Editor Harsh Notariya's daily Crypto newsletter here .
ETF data also supports this assessment. Since its launch, Solana spot ETFs have never recorded a week of net Capital . In the most recent week, inflows increased by $13.14 million (even though the week is not yet over), bringing the total ETF inflows to $755.77 million.
These stable demands demonstrate selective confidence in SOL amidst Capital outflows from other major coins.
 ETF Inflows: SoSo Value
B2BinPay's analysis team explains the significance of this Capital inflow for Solana and the market, in a discussion with BeInCrypto:
“Investors aren’t completely shifting away from Bitcoin and Ethereum to the altcoin market. They’re focusing on a small group of liquidation , well-known Token where downside risk is manageable and they can be easily sold off if needed.”
That's why only a few altcoins like Solana or XRP are attracting inflows, while the majority of the market remains quiet. The current inflow of money into Solana shouldn't be XEM as a sign of the start of a new altcoin season. These moves are very selective and limited,” they Chia .
This assessment supports SOL 's ETF Capital , but at the same time warns investors not to XEM this as a signal for a major altcoin season.
The signals on the chart suggest a potential reversal, but the EMA and Derivative are showing resistance.
On the 2-day chart, the SOL price established a new lower Dip between November 21st and December 17th, while the RSI indicator formed a higher Dip . This is a bullish divergence, which could signal an early trend reversal if buyers continue to strengthen.
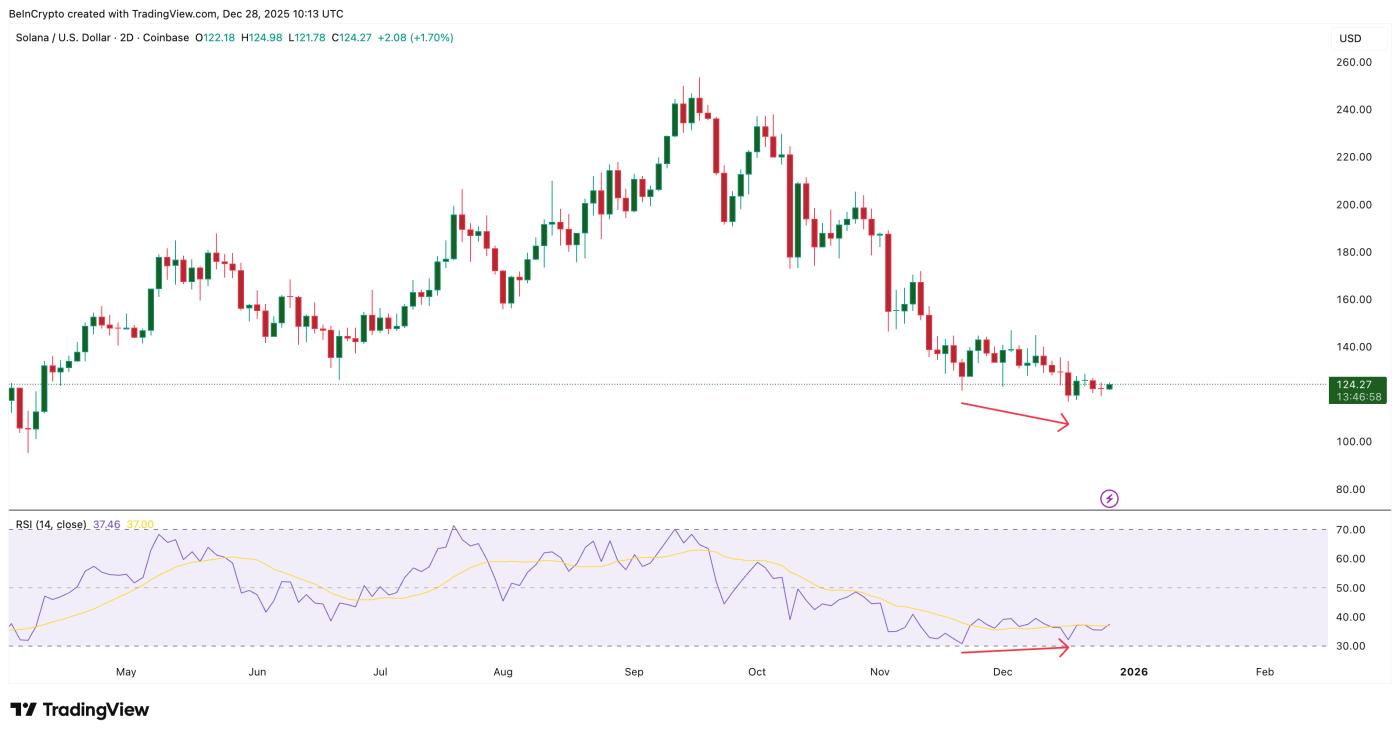 Bullish divergence: TradingView
However, there are also many signs of price declines.
In the same timeframe, the 100-period EMA is preparing to cross below the 200-period EMA (both are trend-tracking indicators, with EMA reacting more quickly to price).
If this bearish crossover signal occurs, downward pressure could continue into late December or early January before the market recovers. Until this signal is negated or reversed, technical analysis still suggests both scenarios are possible.
 Solana has several bearish indicators: TradingView
Positions in the Derivative market also show that traders are being more cautious. On Hyperliquid, almost every trading group has held a net Short position over the past 7 days.
The top 100 large wallets, smart money, and Solana whale accounts are all Short more than Longing. However, some groups (smart money, KOLs, and winners in the Derivative market) are gradually opening Longing positions. This suggests they expect positive developments in January 2026, as indicated by the data above.
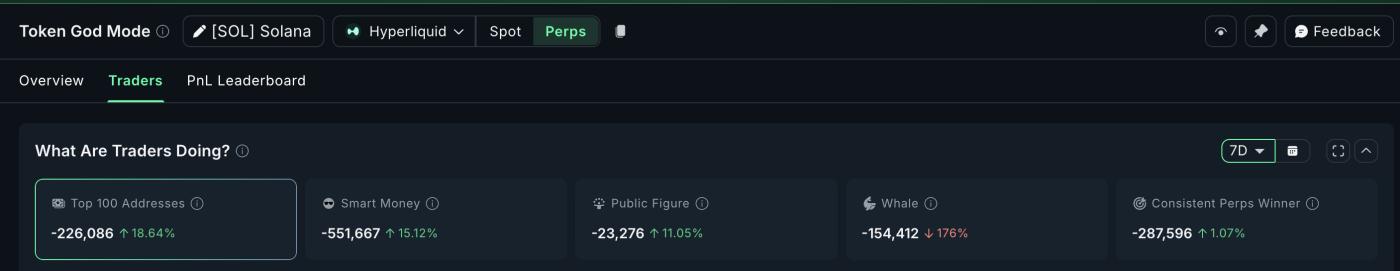 SOL Derivative : Nansen
This combination creates a balance. Current momentum suggests a potential reversal. The EMA and Derivative positions are suggesting a wait-and-see approach. If Solana wants to initiate an uptrend in January, a shift in sentiment in the Derivative market is necessary—reducing Short positions and preventing the EMA from crossing below the support level.
Key price levels for Solana: $129 is the pivot point, $116 is the final safe level.
SOL is currently trading around $124. If the candle closes above $129 for two consecutive days, it will confirm strength and open up the possibility of a rise to $150. If it breaks above $150, the next target could be $171 — provided ETF inflows remain strong and RSI momentum continues to be positive.
Heat map data based on Capital price shows why the $129 area is important. One of the strongest supply clusters is located in the $123–$124 range, and SOL is currently attempting to break through this area.
If the closing price is above $129, SOL will break through this resistance zone and eliminate the selling pressure above. After that, supply will decrease from the $165 to $167 range, increasing the likelihood of further price increases if volume also increases.
A heatmap based on Capital price helps identify areas where many Token holders are buying together, clarifying areas of concentrated supply or demand.
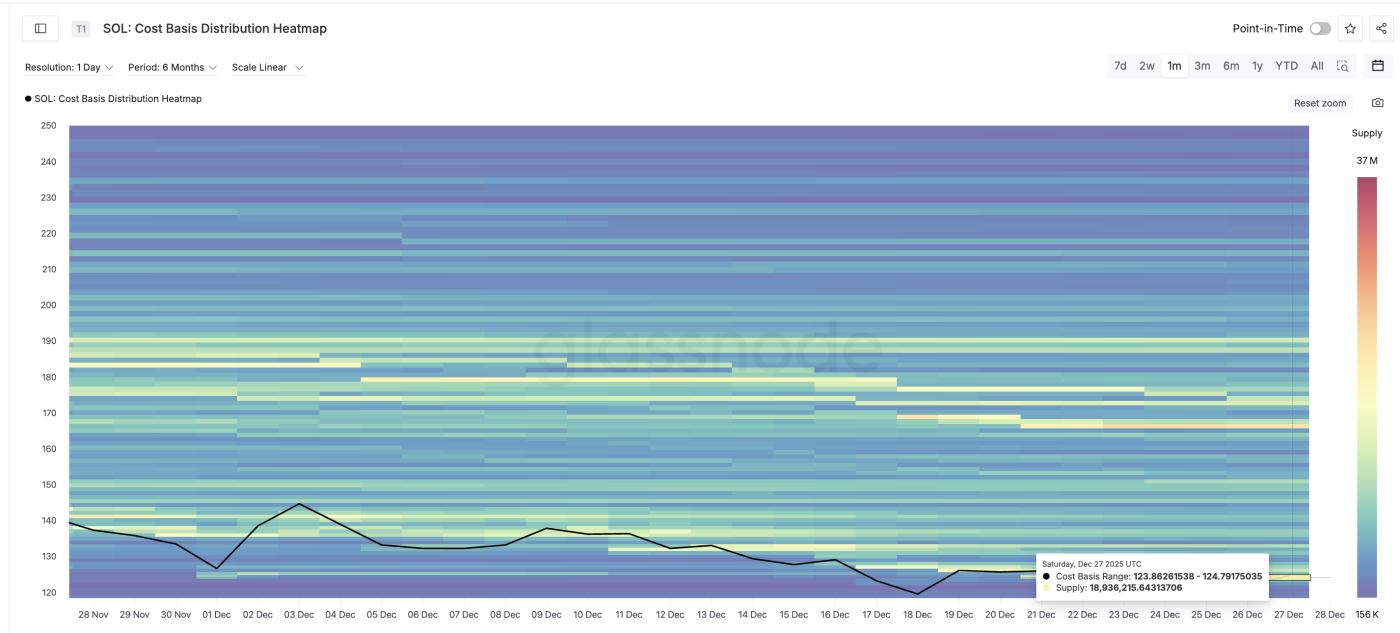 Solana Heat Map: Glassnode
Conversely, the $116 level remains a safe boundary. If this area is breached, the historical "December red, January green" trend will end, and the likelihood of further price declines will increase. If the EMA crosses downwards and simultaneously breaks below $116, the forecast for this month will need to be revised.
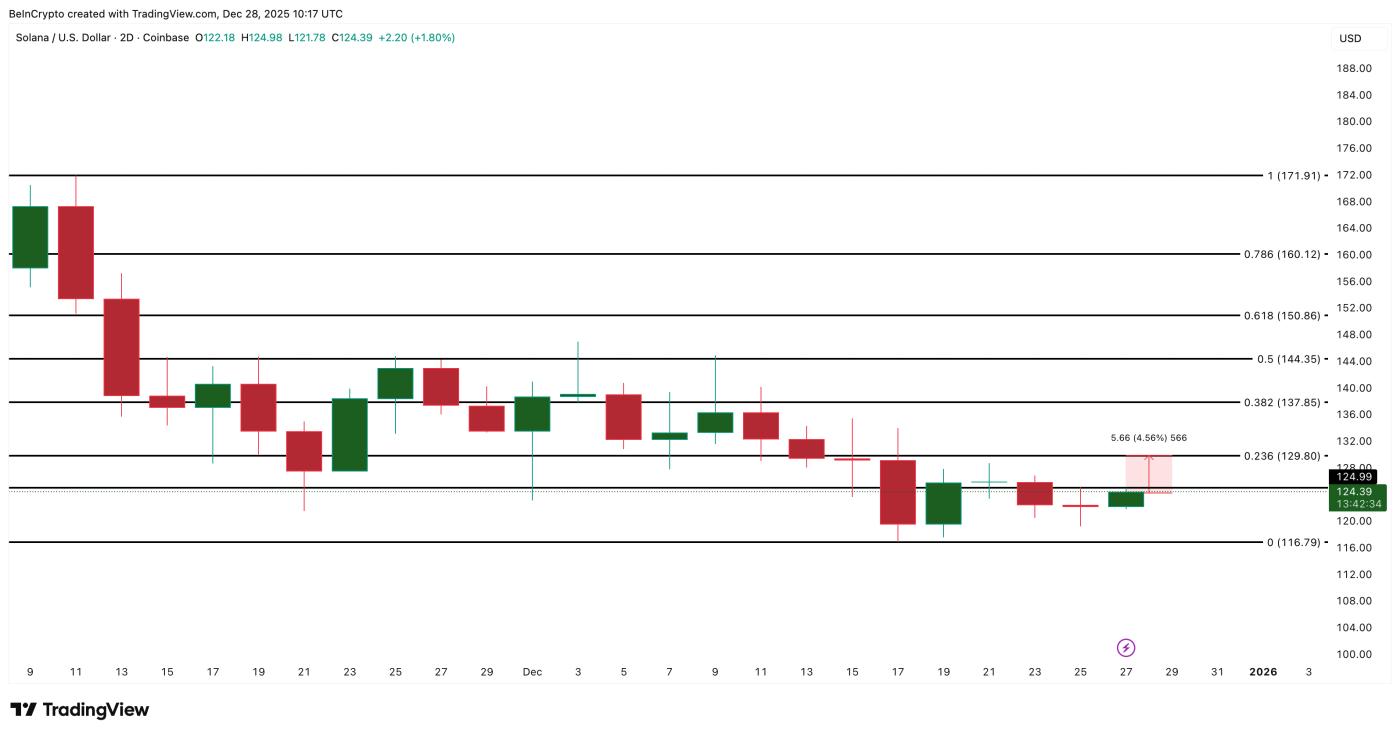 Solana price analysis: TradingView
Currently, trading will revolve around two key levels. If it stays above $129, upward momentum could push the price to $150 and then $171. If it breaks below $116, buyers will lose their advantage, and a price increase in January is unlikely to materialize.


