

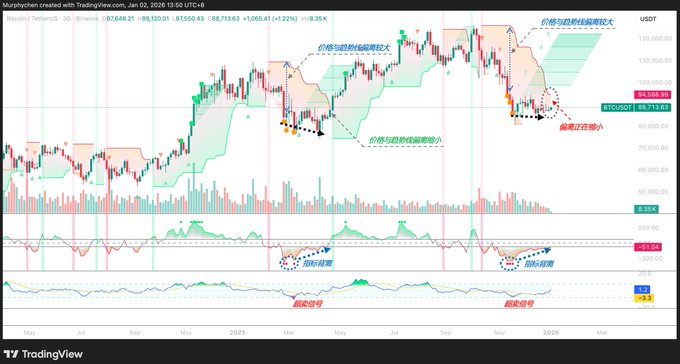
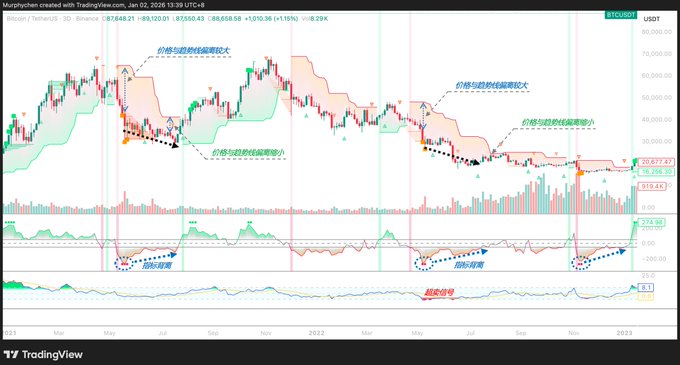
Here’s the translation in crypto-native English: The indicator I use for short-term trading provides clear signals for long/short reversals on the 10min to 1hr timeframe. What's even better, it also adds significant value when applied to higher timeframes. For example, switching to the 3-day chart: Right now, BTC’s 3D candle and trend indicator are showing a divergence—meaning the bearish momentum on this timeframe is gradually being absorbed. The first red dot marks peak selling pressure; after that, price consolidates and the indicator moves back toward the midline, creating divergence. (Chart 1) We saw similar setups from Feb to Apr 2025: The first red dot marked the biggest gap between the candle and trend line, with max momentum. After that, price continued to grind lower, but the indicator started reverting to the midline and flashed an oversold signal. This led to a strong trend reversal rally. Same thing happened in 2021-2022: When the May 19th black swan event hit, the first red dot appeared. The same pattern played out: price diverged from the trend line, the indicator reverted to midline, divergence formed, price/trend line gap narrowed, then a strong bounce followed. (Chart 2) But after the July 2022 divergence + oversold signal, price got squeezed near the trend line and failed to break out (BTC ~$23,000), until the FTX blowup triggered a second divergence and slight oversold signal (BTC ~$15,800). Then, in Jan 2023, price broke out above the trend line and kicked off a new bull run. Bottom line, two scenarios could play out next: 1. Price keeps consolidating, 3D candle/trend line gap narrows, then we see a breakout and strong rally. 2. 3D candle gets rejected by the trend line, price dips further, the indicator flashes a second divergence + oversold signal, then we get a breakout rally. Given there’s still some distance between the trend line and 3D candle, a fast breakout doesn’t look imminent. And since the first divergence already absorbed most of the downside, even if a second divergence occurs, unless we get a black swan, the next dip should be relatively limited. On-chain data (sentiment and behavior) also suggests a bounce is needed. Combined with the K-line indicator, my personal plan: start adding to positions when price approaches the trend line; add again if a second oversold + divergence signal appears; and look to take profits when the next overbought + bearish divergence signal pops up. All for educational sharing only, NOT financial advice! ----------------------------------------------- Bitget VIP—lower fees, bigger perks.
This article is machine translated
Show original

Murphy
@Murphychen888
12-30
一样的配方,一样的剧本;
你打你的原子弹,我扔我的手榴弹;
当BTC日线走成直线,小时反复画门,却无形中给了短线交易一种特殊的腾挪空间。信号明确,止损清楚。 x.com/Murphychen888/…
From Twitter
Disclaimer: The content above is only the author's opinion which does not represent any position of Followin, and is not intended as, and shall not be understood or construed as, investment advice from Followin.
Like
Add to Favorites
Comments
Share
Relevant content


