

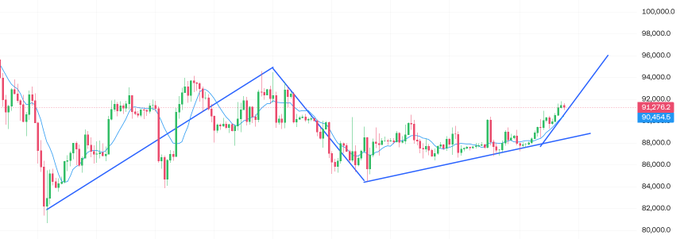
The market's candlestick chart shows a W-bottom pattern, with the bottom gradually rising, indicating a potential rebound. Currently, the price is above the 9-day moving average (MA9) at $90,451, and the blue line (MA20) is providing support, indicating short-term bullish momentum. Key support below: $85,000. A break below this level could test the $80,000 liquidity zone. Resistance above: $95,000-$100,000. A break above this level could open up upward potential to $110,000.
This article is machine translated
Show original

比特币子棋(重生版)
@cloakmk
01-04
同志们,元旦结束了
明天周一了,行情也要逐步变好了!
是时候开始好好看K线,盯机会努力搞钱了!
之前说的建群一直没有弄就是因为行情不对时机不行!
现在是时候搞个群好好交流行情了,明天把tg链接整出来,有兴趣点个赞,上半年这波行情我们一定要抓住!
From Twitter
Disclaimer: The content above is only the author's opinion which does not represent any position of Followin, and is not intended as, and shall not be understood or construed as, investment advice from Followin.
Like
Add to Favorites
Comments
Share
Relevant content


