

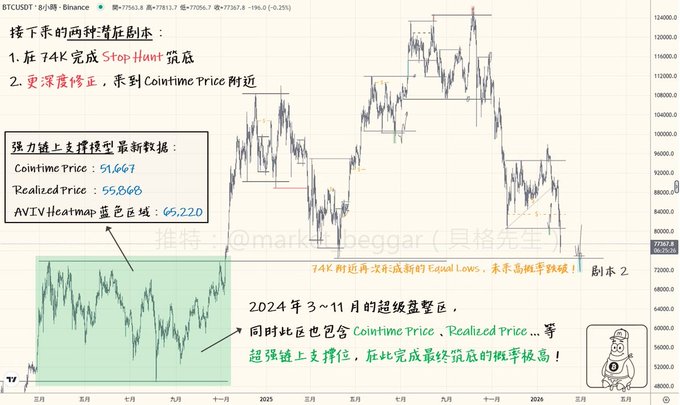
"74K Is Inevitable": A New Liquidity Magnet Zone Has Formed ⚠️ 🪧 Preface: In this thread, I’ll be combining Liquidity analysis and on-chain logic to share my bias for the coming market moves, plus my full trading plan. The weekend’s sudden dump reignited bearish sentiment across the market—but maybe you missed it: new signals are here, and hunting for 74K has now become a high-probability play...👇 // 🟡 Quick Recap Previously, I laid out my 3 main scenarios for the market: 1️⃣ Stop Hunt at 80.5K and form a bottom 2️⃣ Stop Hunt at 74K and form a bottom 3️⃣ No Stop Hunt at either level—deeper correction incoming OGs know: for a true Stop Hunt, you need 3 things: ✅ Break below the liquidity zone ✅ Recover above the liquidity zone after the break ✅ The recovery comes with strong taker buy 📖 More on Stop Hunt logic & live case studies: x.com/market_beggar/status/190...… When BTC broke 80.5K over the weekend, we didn’t see any strong taker buy. And since it was the weekend, even if taker buy showed up, odds are it’s just a fakeout—shared that live in the group. 💭 Free community link: x.com/market_beggar/status/200...… Afterwards, BTC kept nuking—zero taker buy defense. Scenario 1 is confirmed dead, and the market direction is getting clearer. // 🟡 New Risk Signals Are In Besides confirming scenario 1 is dead, that weekend dump gave us another key signal: “BTC has formed new Equal Lows at 74K‼️” Equal Lows = price wicks at almost the exact same horizontal level, but none break below the leftmost wick. This means a ton of liquidity has stacked up. Per my repeated “Liquidity Magnet” thesis, price now has a high probability to revisit those Equal Lows and sweep that zone. Check the chart: “The weekend’s low and April 2025’s low have lined up as new Equal Lows.” Meaning: no matter what happens next, odds are we revisit 74K and clear that liquidity‼️ I’ve shared many times on X how to play these liquidity clusters. My recent “Rising Downside Risk & Calm Before The Storm” post was built entirely on this liquidity concept—and it nailed BTC’s move. 📖 BTC Tech Update: x.com/market_beggar/status/201...… Still skeptical? Go back and replay BTC’s history. See if there are any Equal Lows/Highs that never got tapped. Anyone doubting will get the point after backtesting. // 🟡 Next Trading Scenarios Right now, my playbook has two main paths: 🔸 1. Stop Hunt at 74K, bottom confirmed Same rules for a real Stop Hunt: ✅ Break below 74K ✅ Recover above 74K after the break ✅ Recovery comes with strong taker buy Worth noting: just below 74K is a major support from my on-chain STH-RP deviation model📊 📖 STH-RP Support Zone Update: x.com/market_beggar/status/201...… The blue line is around 70K now. If we get a Stop Hunt, it’ll resonate perfectly with this model and build a solid base for the next leg up📈 - 🔸 2. No Stop Hunt at 74K—look for deeper support If we break 74K and there’s zero taker defense, price could nuke for real. Then we look for bottoms elsewhere. I’ve shared this before—check these threads: 📖 BTC Deep Bear Valuation Data: x.com/market_beggar/status/201...… Some key levels I’m watching: ➡️ Cointime Price: ~51,667 Details: x.com/market_beggar/status/187...… ➡️ Realized Price (market average): ~55,868 Details: x.com/market_beggar/status/186...… ➡️ AVIV Heatmap Blue Zone: ~65,220 Details: x.com/market_beggar/status/201...… So: if price nukes to these levels, I’ll call it—these are cycle-level golden pits. I’ll be deploying the rest of my stack there, maybe with leverage💰 Still doubting? Check the indicator breakdowns above—historically, every time price hit those zones, it marked the cycle bottom. No exceptions. // 🟡 2024’s Mega Consolidation Zone Let’s highlight another big support zone worth watching. Back in March 2024, after BTC’s first major distribution, we chopped sideways for over 200 days—only breaking out after Trump’s win kicked off the next rally, and another big distribution wave. 📖 2025 Top Call Thread: x.com/market_beggar/status/187...… Not many noticed: BTC rarely chops in the same wide range for 200+ days. Chopping = hands changing. The longer it lasts, the more it proves buyers in that zone can absorb old whale sell pressure. Tons of capital is willing to buy BTC in that range. Normally, chop resolves with a move—once both sides reach equilibrium, any catalyst can trigger the breakout🌾 But 200+ days is rare. This time, ETF inflows caught all the old whale sell pressure, laying a rock-solid base. So: “That consolidation zone (49~74K) is highly likely to be strong support.” You’ll notice💡: those deep bear valuation levels line up perfectly with this big chop zone. Bottom line: “BTC’s cycle bottom this round is likely somewhere between 49~74K‼️” Believe it or not, time will tell. // 🟡 TL;DR Quick summary📝: 🔺 No Taker Buy at 80.5K break—Scenario 1 dead 🔺 New Equal Lows at 74K—high odds of a sweep ahead 🔺 Scenario 1: 74K Stop Hunt, STH-RP model resonance 🔺 Scenario 2: No Stop Hunt at 74K—hunt for deeper support 🔺 2024’s mega consolidation zone (49~74K) likely marks this cycle’s bottom Many are disappointed by Scenario 1 dying, but I think things are getting much clearer—not a bad thing. That’s trading: plan, then validate. Now that Scenario 1 is out, and there’s massive support below, if you’re long-term bullish like me and believe in BTC’s revolutionary value, this dump should excite bulls everywhere. BTC is getting cheaper💎 If you thought 100K+ BTC was too pricey, shouldn’t you be happy now? Bit of a long thread, but wanted to lay it all out—thanks for reading. Hope this helps, and good luck trading this week🫡
This article is machine translated
Show original

貝格先生
@market_beggar
01-30
暴風雨如期而至:流動性引力持續發酵,Stop Hunt 近在咫尺🌪
昨晚美股時段的 BTC 慘遭血洗,很多人早已被持續的震盪磨光了性子,
在自身資產負傷的同時開始唾棄 BTC ...。
但如果你是貝格的老朋友,就知道這波下跌完全是有預兆的,
承接下方引文,今天再來快速更新一次盤面的現況👇: x.com/market_beggar/…
Sector:
From Twitter
Disclaimer: The content above is only the author's opinion which does not represent any position of Followin, and is not intended as, and shall not be understood or construed as, investment advice from Followin.
Like
Add to Favorites
Comments
Share
Relevant content


