This article is machine translated
Show original
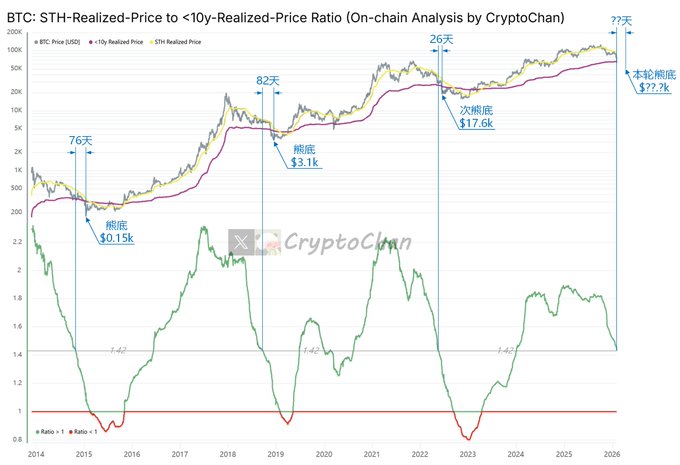
【Four-Year Cycle Series (18)】The indicator in the current chart has fallen to 1.42. In 2014, the indicator fell to 1.42 and reached the bear market bottom in 76 days ($0.15k). In 2018, the indicator fell to 1.42 and reached the bear market bottom in 82 days ($3.1k). In 2022, the indicator fell to 1.42 and reached the secondary bear market bottom in 26 days ($17.6k). The gray line at the top of the chart is the #BTC price; the yellow line is the average cost price of BTC short-term holders; the magenta line is the average cost price of BTC long-term holders (excluding those who have held the BTC for more than 10 years). The indicator at the bottom of the chart is the ratio of "average cost price of BTC short-term holders" to "average cost price of BTC long-term holders (excluding those who have held the BTC for more than 10 years)" (i.e., yellow line / magenta line). The average cost price of BTC short-term holders is defined as the average cost of investors who have held Bitcoin for less than 155 days. Meaning: Reflects the cost basis of recent buyers, who are sensitive to price fluctuations and prone to selling during downturns. Often used as a short-term market sentiment indicator—prices are higher than this average price in a bull market, and falling below it in a bear market may exacerbate selling.
BTC Long-Term Holder Average Cost Definition: The average cost of investors who have held Bitcoin for >155 days, excluding those holding >10 years (these may be lost or never moved, such as Satoshi Nakamoto's coins). Meaning: Focuses on "active" long-term holders, providing a more realistic cost basis. Often used as a reference for market support levels—may become the price bottom in a bear market.
Ratio (Short-Term Average Price / Long-Term Average Price) Meaning: Reflects market cycle stage and participant behavior:
Ratio >1: High cost of short-term buyers (new funds entering at high prices), optimistic but potentially overheated sentiment.
Ratio <1: Bear market or bottom signal, low cost of short-term buyers (entering at low prices), weak hands clearing out, market may recover.
Overall Trend: Ratio rising = continuation of the bull market; falling = bear market or distribution phase. Excluding >10-year holdings makes the ratio more accurate in capturing cycle turning points; historically, <1 often indicates a long-term buying opportunity.

CryptoChan
@0xCryptoChan
12-11
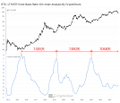
【四年周期总刻系列(17)】
15年6月该指标峰值跟19年3月该指标峰值相差 1385天
19年3月该指标峰值跟23年1月该指标峰值相差 1380天
23年1月该指标峰值距今已过去1068天
图中上方指标为 #BTC 价格;下方指标为“链上长期持币者买币均价”跟“链上短期持币者买币均价”之比 x.com/0xCryptoChan/s…
Awesome! Boss, remember to update when you get to level 1.
Sector:
From Twitter
Disclaimer: The content above is only the author's opinion which does not represent any position of Followin, and is not intended as, and shall not be understood or construed as, investment advice from Followin.
Like
Add to Favorites
Comments
Share
Relevant content