

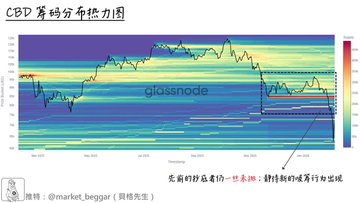
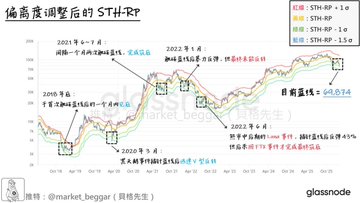
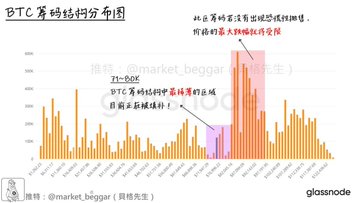
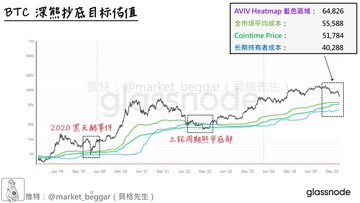
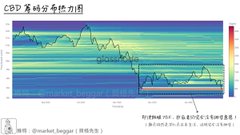
🗞 Bloomberg Chain Weekly Report (63) Special Edition: A Phase Summary After the Crash BTC has fallen by nearly 40% in the last three weeks. The market experienced its biggest drop this week, with a decline of about 24%, and quickly descended into chaos. This week's report will include a few more items, mainly: 🔺 This Week's Signal Summary 🔺 Next Week's Content Plan Here we officially begin this week's "Tragic Recap" 👇: // 🟡 Chip Distribution Chart Update As usual, here's a quick update of this week's CBD chip distribution chart: 📝 The CBD heat map has three dimensions: time, price, and number of chips; Unlike the URPD chart, the CBD Heatmap uses "address-based" statistics. Even if BTC experiences a precipitous drop, the massive amount of tokens buy the dips around 80K previously... To this day, they have absolutely no intention of selling off their shares. To be honest, I'm becoming more and more curious about their identities. In addition, because the price has now left the trading range that lasted for more than two months, Therefore, in the following weekly report, we can use the CBD heat map to... This is to monitor whether there are any large investors accumulating shares in the following period. At this stage, due to the short time frame, no new accumulation of shares has been observed. // 🟡 This week's key signals may have already been noticed by some: the amount of information contained in my posts this week has increased. This is because as a trend emerges, more information gradually comes to light in the market. The script we had previously planned is gradually becoming clearer. Below, I will quickly summarize the key points of this week's posts for you: 1️⃣ STH-RP model blue line with deviation adjustment: a strong support zone 🔗 Original link: x.com/market_beggar/status/201...… During the sharp drop on Thursday and Friday this week, BTC immediately reached the area indicated by the blue line. As shown in the image below (image taken from the original text), historically, whenever the price reaches the blue line, Without exception, they all experienced a strong rebound, or even a reversal of the trend. - 2️⃣ Filling the URPD thinning zone is underway 🔗 Original link: x.com/market_beggar/status/201...… The "vacuum-like region (rare region)" that originally existed at 71~80K, After more than a year, the market has finally begun to recover due to this sharp drop. If the previous lack of upward momentum was due to the drag from the vacuum gap, This filling of gaps may be precisely to resolve potential risks and make ample preparations for a new bull market. - 3️⃣ Latest data on extreme valuations in the BTC bear market 🔗 Original link: x.com/market_beggar/status/201...… The magnitude of the decline has forced us to start paying attention to these buy the dips models with a 100% historical success rate. The data for the four indicators in the original text (02/06) are as follows: 🔸 AVIV Heatmap (Blue area): 64.826 🔸 Realized Price: 55,588 🔸 Cointime Price: 51,784 🔸 LTH-RP: 40,288 The latest values for these models haven't changed much since only two days have passed. You can still use the above values as a reference. To reiterate, these models can be said to have accurately captured every bear market bottom in BTC's history. For those interested in delving deeper, I've included detailed explanations in the original article link above. 📝 / / 🟡 Mid-term summary & next week's post plan: This week's BTC market witnessed an epic spectacle: It plummeted 15% in a single day, then rebounded nearly 20% the following day. During this period, many signals were actually triggered, including the PSIP buy the dips signal I mentioned yesterday. This sharp drop has already approached the threshold.⚠️ Another classic sentiment indicator, the Fear & Greed Index, also plummeted to 5 🚨 It's worth noting that the last time it fell this low was back in 2019... Starting tomorrow, I will mainly be sharing the following content with you: ➡️ Detailed Analysis of the Current Status of PSIP Deep Bear Buy the dips Signal ➡️ Important Notes During the Bottom-Building and Consolidation Phase & Mid-Term Technical Strategic Framework ➡️ Data Updates for Various Buy the dips Models & Other Special Signals Because we are currently in a relatively critical phase, The amount of information in my future posts may increase, so please bear with me. The familiar era of mad dog Crypto seems to be back; 2026 is something to look forward to ⚡️ That concludes this week's report. Have a wonderful weekend! 🚊
This article is machine translated
Show original

貝格先生
@market_beggar
02-01
🗞 貝格鏈上週報(六十二):週末屠城
本該平靜的週末,Crypto 市場卻在無預警的情況下,
硬是上演了一齣屠城,急遽的陰 K 血洗了市場,
BTC 跌破了 77K,ETH 的單日跌幅甚至超過 10%。
明天,我會專門發布篇帖子,和各位報告我對於此波暴跌的 bias,
今天先按照慣例,和各位更新籌碼分布的狀況: x.com/market_beggar/…
Sector:
From Twitter
Disclaimer: The content above is only the author's opinion which does not represent any position of Followin, and is not intended as, and shall not be understood or construed as, investment advice from Followin.
Like
Add to Favorites
Comments
Share
Relevant content


