

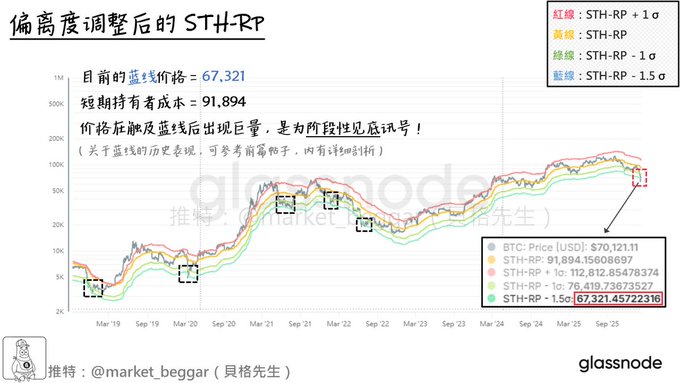
First time since 2022: BTC is back at the Blue Line support zone ☄️ Picking up from my previous post last week on “the magic of the Blue Line,” BTC was still above 73K at that time. But just two days after that post, the price crashed straight down to 60K, landing directly in the Blue Line area. Even though a few days have passed, I think it’s still necessary to make an official update. I’ll also share the latest model data 👇: The indicator in the attached chart is the “Deviation-Adjusted STH-RP.” Here’s a quick recap of the logic: ➡️ Calculate the average and standard deviation of STH-MVRV since 2018. ➡️ Multiply STH-RP by the “STH-MVRV average ± n standard deviations.” ➡️ We use post-2018 data because STH-MVRV has a clear mean reversion characteristic since then. 🟥 Red line = STH-RP * (STH-MVRV average + 1 std dev) 🟨 Yellow line = STH-RP 🟩 Green line = STH-RP * (STH-MVRV average - 1 std dev) 🟦 Blue line = STH-RP * (STH-MVRV average - 1.5 std dev) 📖 Full model explanation: x.com/market_beggar/status/190...… // 📊 Current Blue Line price ≈ $67,321 In my last analysis post (see quoted tweet below), I explained the Blue Line model in detail: since late 2018, BTC has touched the Blue Line five times, and each time it signaled a bottom—sometimes a local low, sometimes a macro cycle bottom. Sometimes it’s a sharp V-shaped bounce, other times there’s a period of bottoming before a move up. If you want to dive deeper into these historical cases, I strongly recommend reading the quoted thread below—I’ve included detailed breakdowns there 📝 💬 To be honest: If you haven’t read the quoted thread below, I highly recommend you take 3 minutes to check it out before reading today’s update. You’ll get a much more complete understanding of the current market context. // In yesterday’s analysis (x.com/market_beggar/status/202...…), I shared my outlook for the market. Here are the main takeaways: ➡️ On 2/05, we saw extreme volume, and the Fear & Greed Index dropped to ultra-low levels. ➡️ Combined with the Blue Line support, the odds are high for a period of wide-range chop ahead. In short, I believe the Blue Line’s support effect was basically confirmed after the massive 2/05 volume. The coming chop zone will determine whether BTC bounces or fully reverses. // One more thing 💬: A lot of people still don’t get what “on-chain support” really means. I explained this in detail in the quoted thread below, but people keep asking, so here’s a refresher: On-chain “support” is not the same as TA support. Price can easily dip below or pop above these levels in the short term. For “support,” it’s not about “this level cannot be broken,” but rather “when price hits this level, there’s a high probability of a bounce or even a reversal.” The same logic applies to the Deviation-Adjusted STH-RP Blue Line model 🔵. Here’s a direct quote from the previous thread: “Although price usually sees a strong bounce after reaching the Blue Line, it doesn’t mean it happens immediately—sometimes it chops around the Blue Line for 1-2 months.” // Lastly, we can see both the Blue Line and STH-RP are trending down steadily. As time goes on, more short-term holders will rotate, so the longer price grinds in this zone, the lower both STH-RP and the Blue Line will go. Here’s a fun hypothesis 💡: Deep bear valuation models like Realized Price and Cointime Price are gradually moving up over time (even if slowly), while the Blue Line is trending down. If the chop lasts long enough, could we see Cointime Price or Realized Price converge with the Blue Line at some point? If that happens, it could be a rare, high-conviction buying window 👀 But for now, it’s still early—the chop is just starting. Patience is key. That’s it for today—hope this helps! 🫡 // 📚 Further Reading: “The Golden Pit Is Just One Step Away”: PSIP cyclical bottom signals are close x.com/market_beggar/status/202...… Extreme volume: The start of a new chop battle x.com/market_beggar/status/202...…
This article is machine translated
Show original

貝格先生
@market_beggar
02-03
「藍線的神威」:聊 BTC 下方的強力支撐位 & 歷史覆盤📊
誠如昨日的分析帖所言(下方引文),BTC 現已在下方約 74.5K 的位置,
再次形成了新的 Equal Lows,也就是 liquidity 聚集區,
我也因此判定未來有高概率重返 74.5K。
接著此話題,今天再來和深入聊聊目前最接近現價的模型強支撐位👇: x.com/market_beggar/…
Sector:
From Twitter
Disclaimer: The content above is only the author's opinion which does not represent any position of Followin, and is not intended as, and shall not be understood or construed as, investment advice from Followin.
Like
Add to Favorites
Comments
Share
Relevant content


