This article is machine translated
Show original
MVRV Extreme Deviation: Probability Boundaries for Bear Market Rallies
When it comes to daily-level bear market rallies, aside from tracking BRS signals, I pay close attention to the “MVRV Extreme Deviation Pricing Range” — a high-efficiency indicator validated by historical data.
Extreme deviation here refers to statistical dispersion; under the normal distribution assumption, the standard deviation maps to probability ranges. Looking at the past 10 years of data:
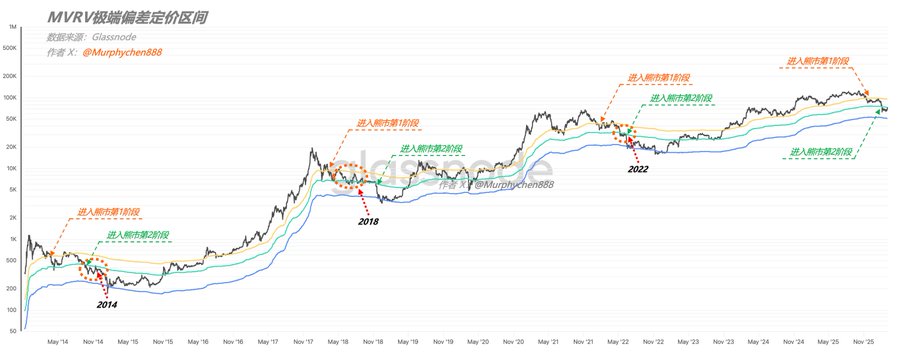
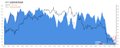
(Fig 1 – MVRV Extreme Deviation Pricing Range – Overview)
1. When BTC breaks below the yellow line, it signals entry into Phase 1 of a bear market. After this point, daily-level rallies rarely reclaim the yellow line; even if there’s a slight reclaim, it usually fails soon after — this confirms the signal (see 2018 on the chart).
2. When BTC breaks below the green line, it marks Phase 2 of the bear market. Similarly, rallies struggle to break above the green line until the bear bottom is fully formed (see 2014 and 2022 on the chart).
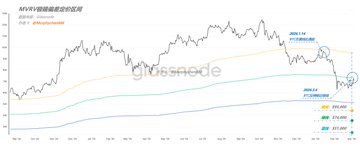
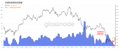
(Fig 2 – MVRV Extreme Deviation Pricing Range – 2026)
On Jan 14, 2026, BTC rallied to $97,000, hitting resistance at the yellow line. At that time, the BRS signal had already reset to zero, giving us more confidence that this was the rally top.
Related post: x.com/Murphychen888/status/201...
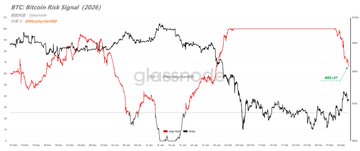
(Fig 3 – Bitcoin Risk Signal)
This time, the rally peaked at $72,691 on March 4th, almost touching the green line, while the BRS signal hadn’t reset to zero yet.
🚩 My personal take:
1. Even if this rally isn’t over, it’s likely already near the top.
2. My estimated range for the local top is around $74,000–$78,000.
But there’s a unique scenario to consider:
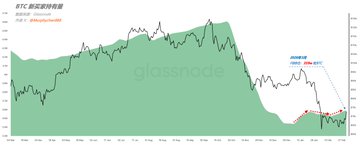
BTC still hasn’t broken below the “< 10y_RP” level, which is closer to BTC’s true historical average on-chain cost basis.
Related post: x.com/Murphychen888/status/202...
In other words, as long as BTC doesn’t break below the “< 10y_RP” extreme, there’s still a chance for a “shallow bear” path. So, the special case to watch for:
If BTC manages to break above the green line ($74,000) in the MVRV extreme deviation range and holds above it on retests, the probability increases that the bear bottom is in.
Of course, I still see scenarios 1 and 2 as most likely, while scenario 3 is less probable. (Disclaimer: This is just my personal view, not financial advice. Stay rational, frens!)

Murphy
@Murphychen888
我个人更倾向于看反弹,或者说BTC在6.3-6.8w的磨底时间还不够。时间太短,就无法完成从分歧到共识的底部重构,也无法修复被击溃的市场信心。
比如,很多老OG还在预测本轮熊底会跌至2-3w美元,那么此时资金对抄底是谨慎的,消极的,而持有者对价格回升选择获利了结却是坚定的,积极的。 x.com/0xGummyBear/st…
Headaches are just a matter of probability. Dollar-cost averaging is the only thing that suits my temperament.
Sector:
From Twitter
Disclaimer: The content above is only the author's opinion which does not represent any position of Followin, and is not intended as, and shall not be understood or construed as, investment advice from Followin.
Like
Add to Favorites
Comments
Share
Relevant content