Author: Louis Wang, Biteye
Edit: Biteye core contributor Crush
With the development of blockchain technology, the prosperity of the ecology on the chain, and rich interactive behaviors have brought massive data, data analysis has become an important part of blockchain applications.
These on-chain data correspond to the flow of value on the chain, and the analysis of these data and the insights and insights derived from the analysis become extremely valuable.
Emerging Web3 data products provide rich data visualization functions and powerful analysis tools, and help users make better use of data in the blockchain through real-time monitoring, data mining and analysis functions.
Data product classification
From the perspective of the data stack, blockchain data products can be divided into three categories: data sources, data development tools, and data apps.
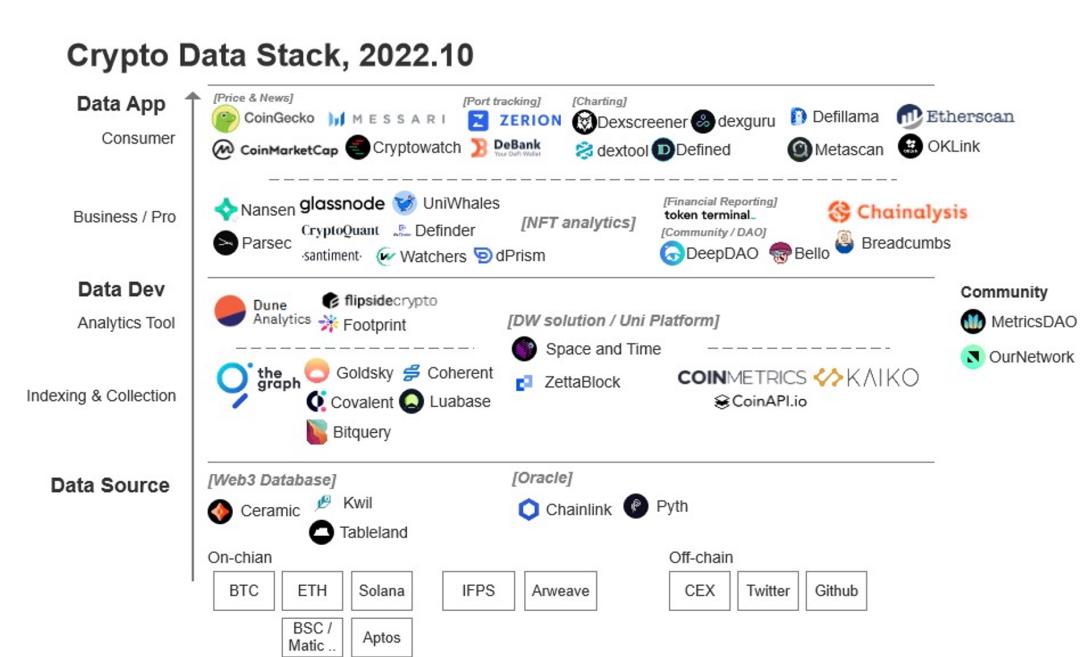
Among them, data development tools and data apps have the widest audience. Mature data products such as Nansen and Messari, after data analysis, package the finished product results to users, such as hot project tracking, capital flow on the chain, etc.
The characteristics of this type of product are easy to see and understand, low learning threshold, and easy to use. The disadvantage is that it cannot meet the needs of customization, which is a passive research, and those with detailed functions are often paid.
Highly customized data development tools, such as Dune Analytics, Flipside, Footprint, are means of active research.
This type of tool is characterized by a high degree of freedom and an extremely high upper limit. The sea is wide enough to allow fish to leap, and the sky is high for birds to fly. However, it requires a deep understanding of the blockchain data structure, a basic grasp of the database language and a little knowledge of smart contracts. The learning threshold is relatively high, which is easy to read but difficult to learn.
Although there are mature products in the subdivision track of the data category, as people continue to expand the territory of the blockchain technology, the data on the chain is also exploding, and the user's demand for data analysis is increasing day by day. A group of emerging Data tools and products appear in the sight of users.
The rest of this article introduces seven emerging data products (in alphabetical order):
01 0xScope
product background
The blockchain data is real and transparent, but due to the decentralized production relationship, it brings about the problem of information fragmentation. The data is fragmented, and each piece is valid and usable, but fragmented and decentralized, it is difficult to produce relevant and in-depth analysis.
At the same time, for the premise that Ethereum EOA accounts are easy to "open more", the analysis of only addresses is single and one-sided. What the user portrait wants to portray is the operating entity behind the account.
Aiming at the pain points of these web3 data, 0xScope uses a pair of invisible hands to pick up blockchain data fragments, making it possible to piece together a complete user portrait. The team proposed an innovative solution: Entity analysis.
0xScope has established a set of weight collection algorithms based on graph calculations to identify other addresses of users by assigning different weights to dozens of different types of rules. These rules have been tested and improved through deep learning to improve the efficiency of address collection. Accuracy, and reconstruct the information unit from the perspective of Entity.
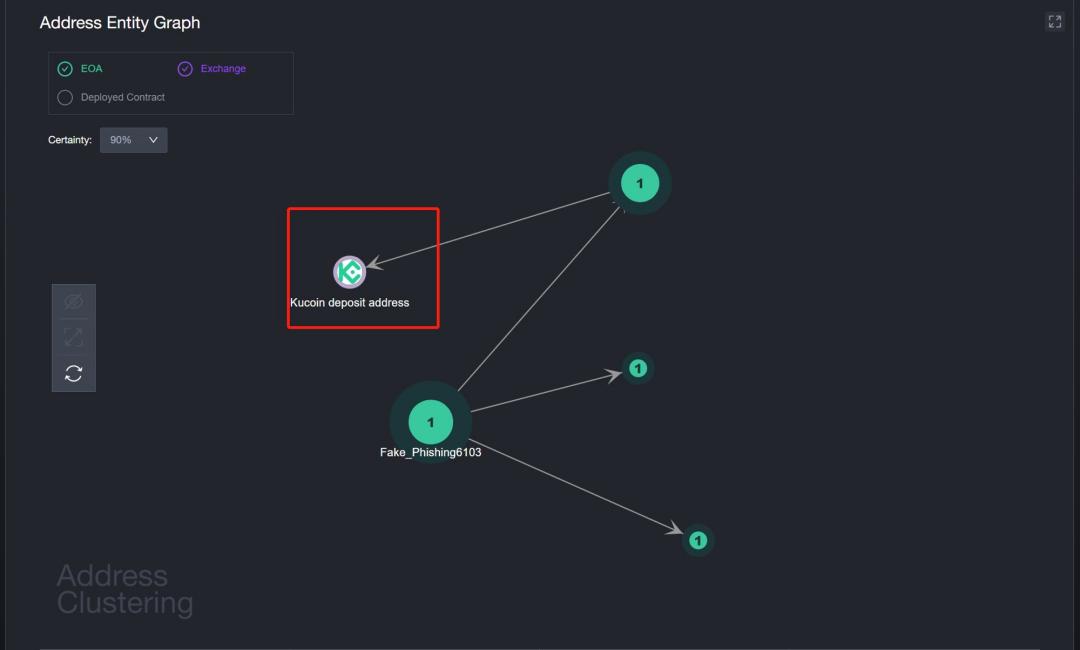
As shown in the figure below, these four seemingly unrelated on-chain addresses are found to be the same entity through 0xScope's imputation algorithm, which means that the possibility that these accounts are controlled by the same person is very high! And through the clues it leaves in different interactions, it is even possible to speculate on the time zone and web2 information of the person behind the screen.
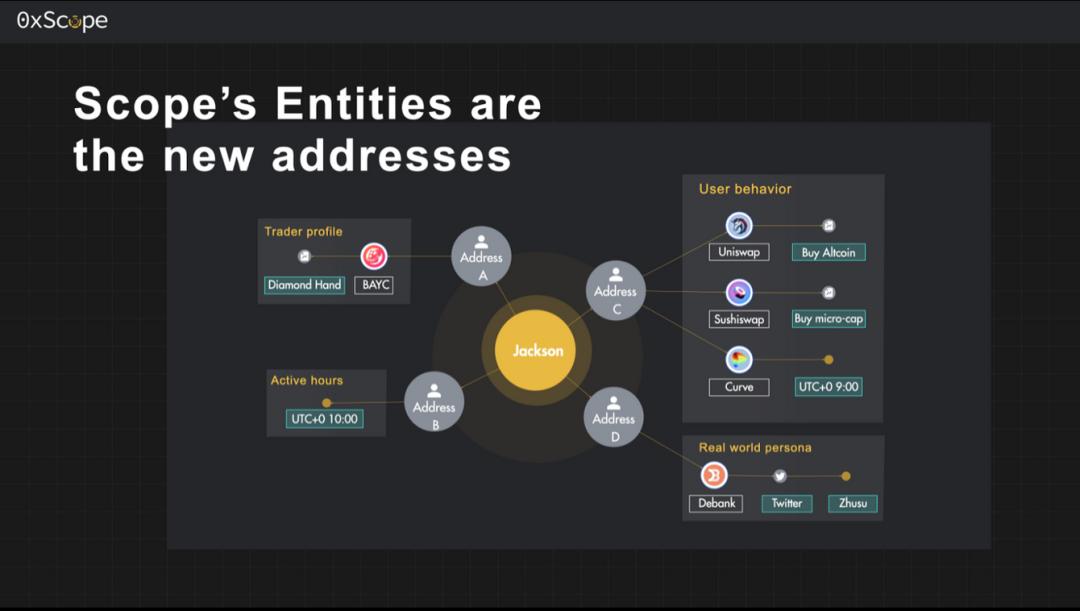
The emergence of Entity means that the dimension of analysis on the chain is no longer single, the image of each entity on the chain becomes full and rich, and the angle of analysis is no longer limited to the thin EOA address; If you change your EOA account, you can escape. Tianyancha will follow you to the ends of the earth, and there is nowhere to hide...
Product Features
Watcher has just been updated to version 2.0, making adaptive adjustments in page logic. Three main functional modules:
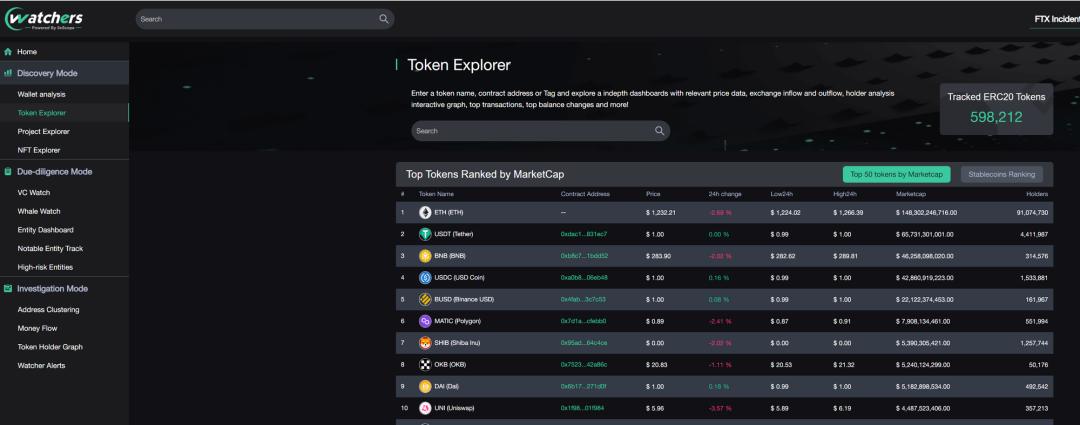
1. Discovery Module
This part belongs to the data walking area, which is for users to wander aimlessly. You can look at the distribution of large holders of each token; rank by market value, and check the price of each currency and changes in holders;
Rank based on TVL and daily user data to discover hot projects on the chain; or take a look at the latest blue-chip rankings.
2. DD module
Wather is great for due diligence. In VC Watch, you can view the VC positions and changes of the specified token, and it is clear who ran away;
You can also view the dynamics of each VC, narrowing the distance between the small leek and the big leek.
When using giant whale tracking or wallet tracking, you can set an alarm reminder to know the dynamics on the chain in real time. In order to avoid data rollback, the delay is about 12 Ethereum blocks, within five minutes.
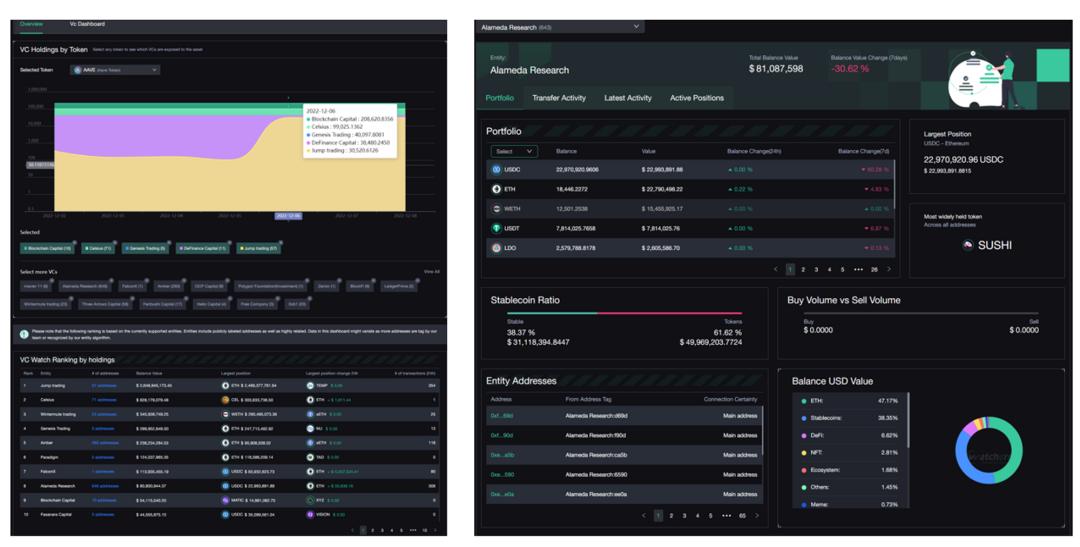
Notable Entity Tracker provides tracking of well-known institutions/market makers/celebrities, a collection of multiple accounts controlled by one entity, the trend is clear at a glance, and one-click follow.
3. Research Module
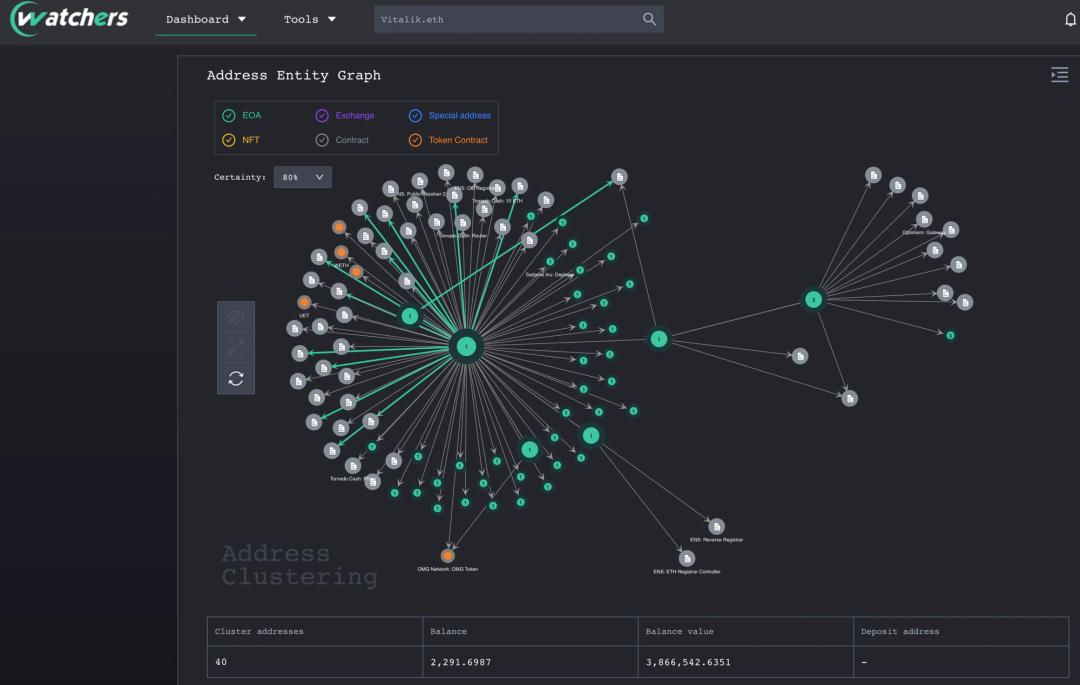
This part should be the part that best represents the technical strength of 0xScope, focusing on address collection and visualizing the flow of funds.
Through the address collection function, you can filter out an address with a high degree of association with other addresses, such as locking a phishing account or a hacker account, you can check whether the address is associated with an exchange, and request the exchange to assist in arresting the hacker together, in order to recover the loss of funds Bring new hope.
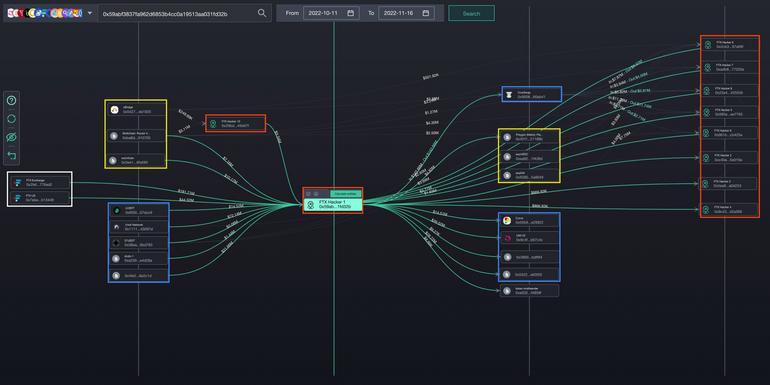
The fund flow function clearly shows the dynamics on the chain through visual charts, as shown in the figure below, how the "FTX hacker" steals assets and how they follow up on the chain, and where they are transferred after being converted into BNB and other assets.
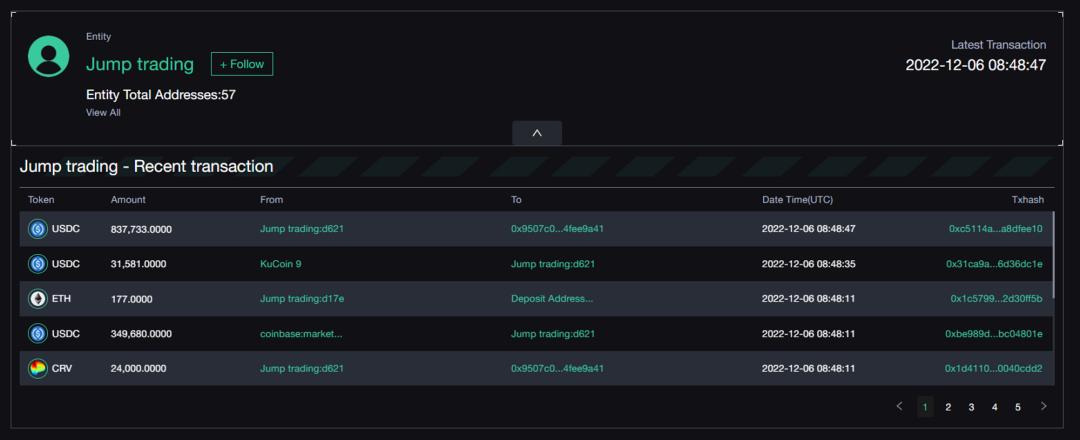
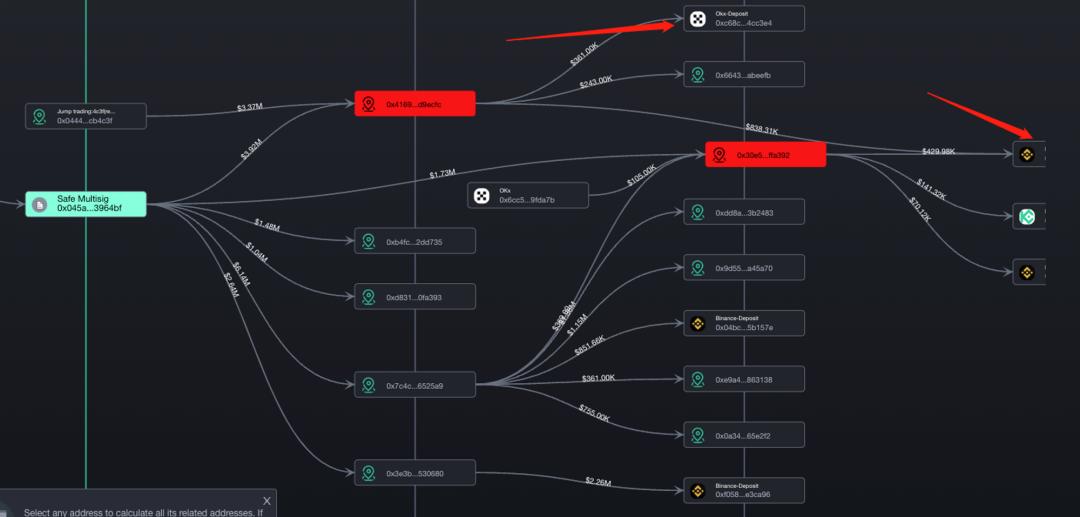
You can also guess that Jump Trading is the market maker of mask by observing the transfer of mask tokens combined with 0xScope’s labeling system, so paying attention to the deposit and withdrawal of these two red addresses is more meaningful for investment decisions.
When assisting investment decisions, it will be more effective to combine giant whale tracking and alarm functions. In the whale watch function, you can view the whale content of each token, and enter the corresponding token whale analysis panel through the Entity Dashboard to view the latest developments of whales.
Someone used this method before and observed a large number of YFII whales withdrawing coins, found the whale that attracted the most funds and had the most relevant behavior and price, set an alarm to track the operation, and finally harvested 700% of the income by whaling. The specific operation can be Check out this tweet.
one sentence summary
0xscope's Watcher has powerful technological innovations. Through entity analysis and address collection, it can help users sort out the relationship between intricate on-chain addresses and on-chain behaviors, which is especially useful for due diligence;
It is also possible to visually analyze the capital flow of tokens, select tracking targets to set early warnings, watch to earn, and turn smart ass into smart money.
02 Arkham
product background
Arkham is a data analysis app, focusing on address collection and tracking. The product is active in the on-chain tracking and analysis of various hot events, such as the FTX burst and the CRV short sale in November, which have attracted widespread attention.

The product is currently in the closed beta stage, and you can apply for a place for the beta on the official website.
Product Features
1. Asset information
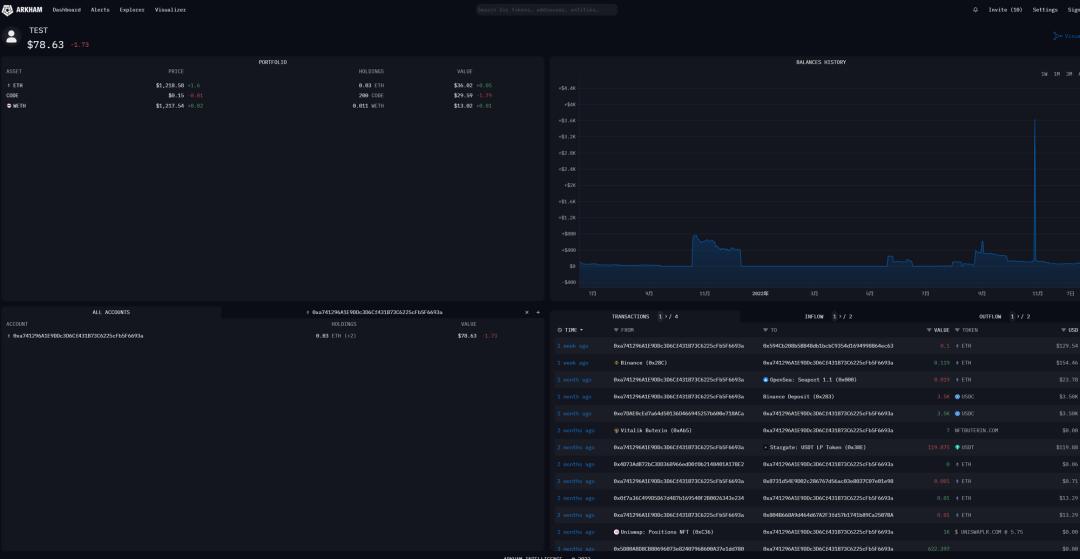
Once connected to the wallet, you can see your asset information. This is actually the simplest instantiation of Arkham's dashboard, including: asset table, historical asset level, asset portfolio, and transaction records. Holding assets will also display real-time 24 Hours change.
2. Data Tracking Dashboard (Dashboard)
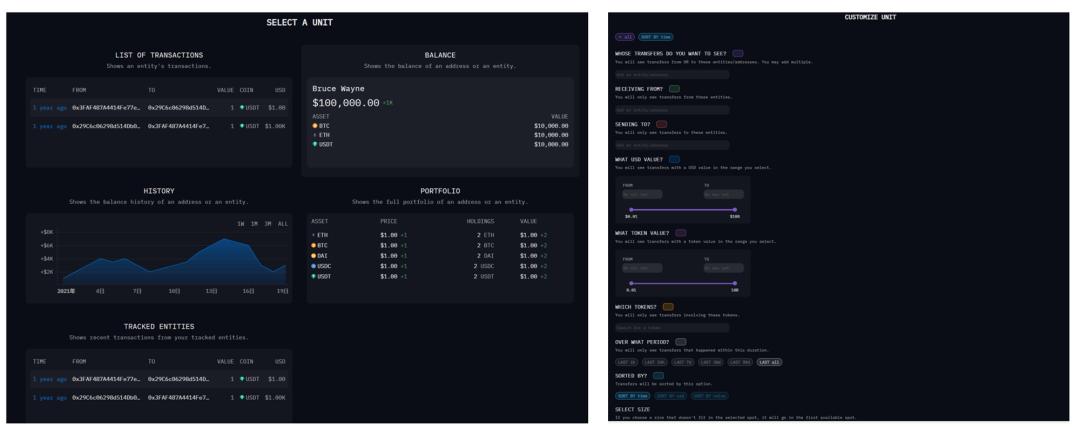
Dashboard is the most important function of Arkham, and the production method is very simple, no programming is required, just input and check the conditions to output, the speed is very fast. This can be either entity analysis-oriented or token analysis-oriented.
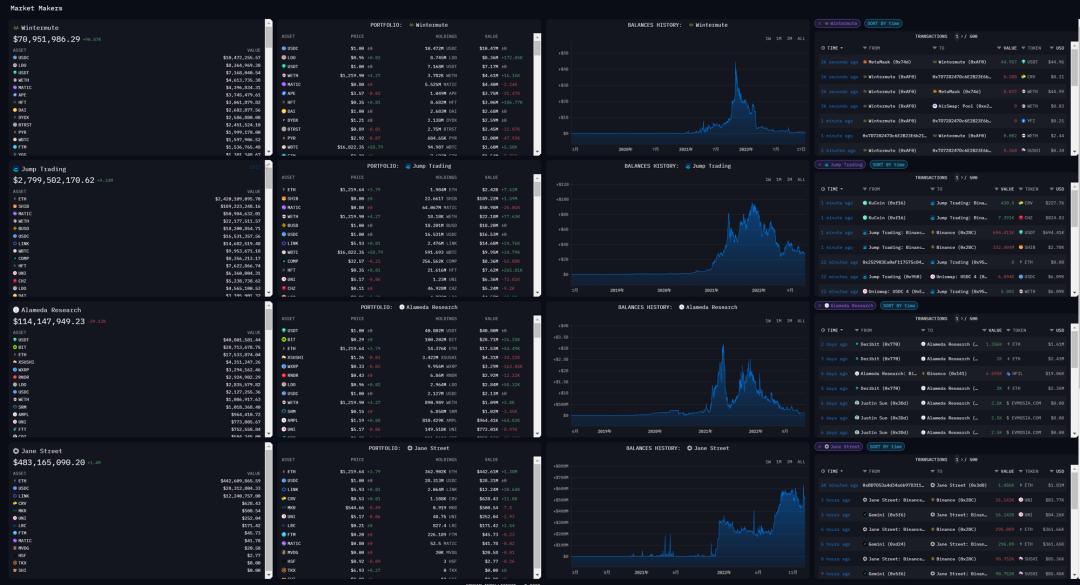
Arkham has collected the addresses of mainstream market makers in the market and grouped them into entities, which is convenient for users to query. Taking entity analysis as an example, as shown in the figure below, I made a Kanban for market maker comparison. The Kanban content includes the assets, asset composition, asset history curve and recent operations of four market makers, Wintermute, Jump Trading, Alameda and Jane Street.
You can see what tokens powerful market makers hold and what tokens they are operating, so as to provide guidance for following and avoiding.
Take the token analysis as an example to look at the event of AAVE borrowing $CRV to short in November. Select the large amount of CRV tokens deposited in OKX in the filter condition, and you can see that it is all Eisenberg (this time borrowing crv to short and the previous attack What makes Mango lose 100 million is this) in the output.
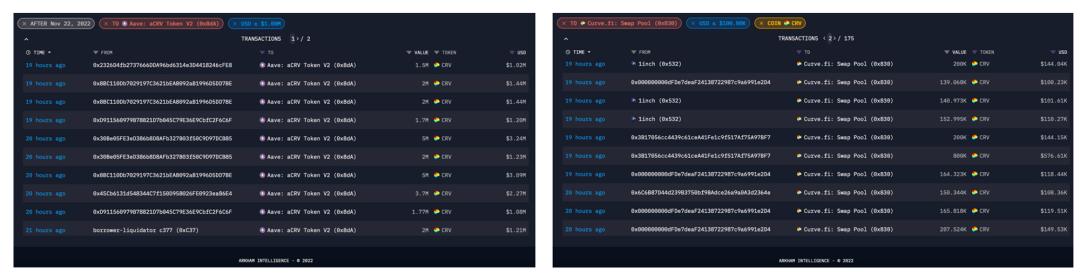
Subsequent $CRV burst short, and the position in AAVE was liquidated. In the Kanban, the conditions were selected to be sent to CRV in AAVE. It showed that due to insufficient liquidity, the position to be liquidated was too large. The entire liquidation process lasted for 40 minutes, and finally gave AAVE is left with seven-figure bad debts.
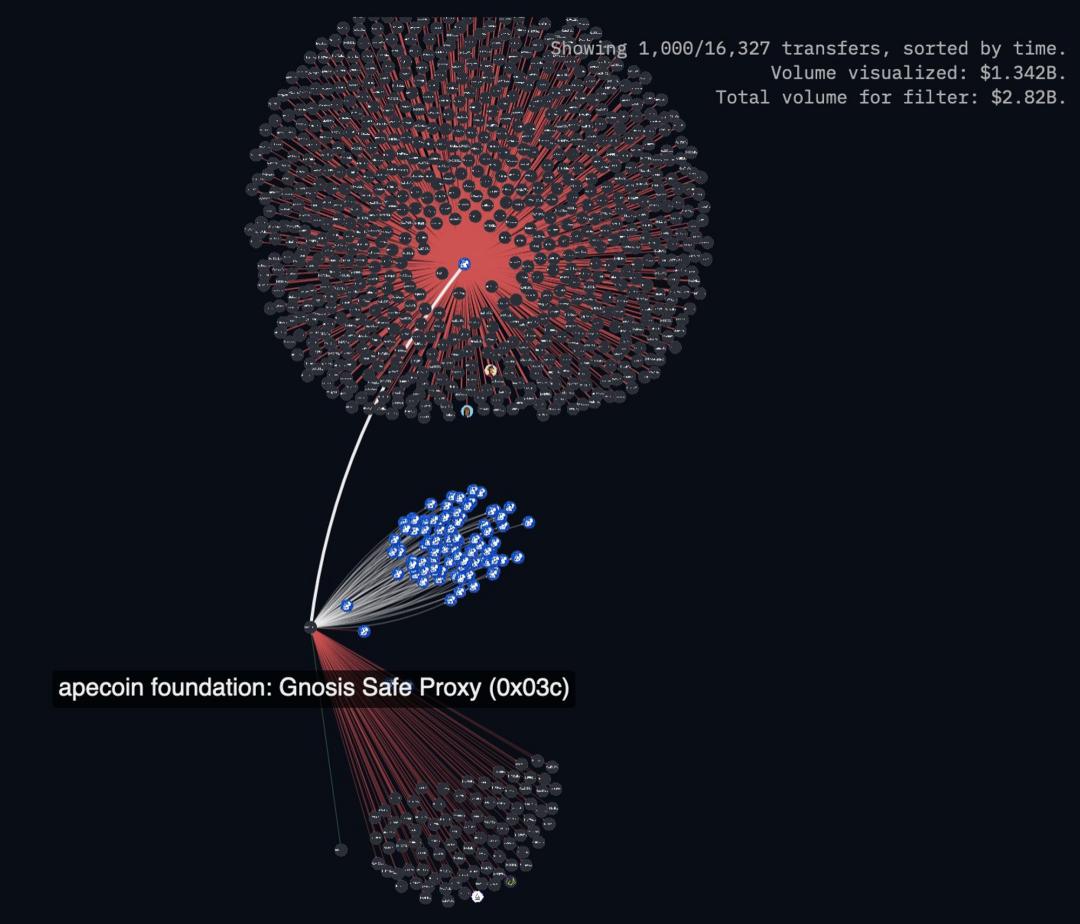
3. Atlas (Visualizer)
Graph is a visual tool that associates addresses on the chain. Similar to inputting addresses or entity names, graphs can be automatically generated. For example, I want to track the initial distribution of APEcoin, as shown in the figure below, the upper part is the AirDrop address, the middle part is the foundation wallet managed by Coinbase, and the lower part is some unmarked addresses.
one sentence summary
Arkham's simple and easy-to-use on-chain data tracking app, only needs flexible filtering conditions to create information-rich Kanban, whether it is entity-oriented analysis, or token-oriented, protocol-oriented analysis, it is flexible and easy to use.
At present, the product is still in internal testing, and more functions, such as large-value transfer warnings, are under development.
03 Chaineye
product background
With the growing Web3 ecology, each track has unique projects emerging one after another. A rich ecology is of course a good thing for users, but it will also cause some troubles. Which one is better, or what options are there for me to choose?
After all, not every ordinary user has the time and energy to study various projects. Chaineye is a data product for users to assist in daily choices. It aims to play the role of an aggregator from a practical point of view to solve problems such as the selection of multi-currency cross-chain solutions with less friction.
Product Features
1. Asset cross-chain aggregation
While the multi-chain structure brings the ecological diversity of the blockchain, it also causes the problem of fragmented liquidity.
Which bridge supports the specified two chains to cross-chain, and what is the wear and tear, users cannot know one by one, which has caused troubles for users to a certain extent.
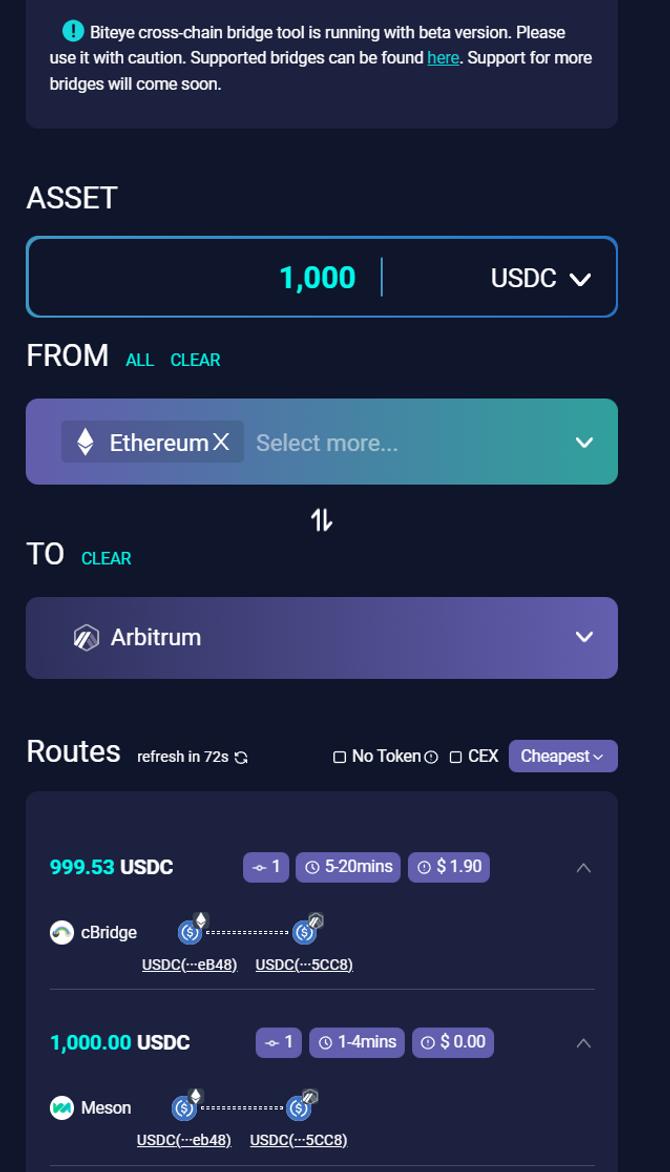
Chaineye aggregates the cross-chain information of various assets, and lists the real-time cross-chain options based on user screening, including the time spent on cross-chain and handling fees. Users can directly link to the cross-chain bridge after selecting the most suitable one according to their needs. It is very convenient to operate.
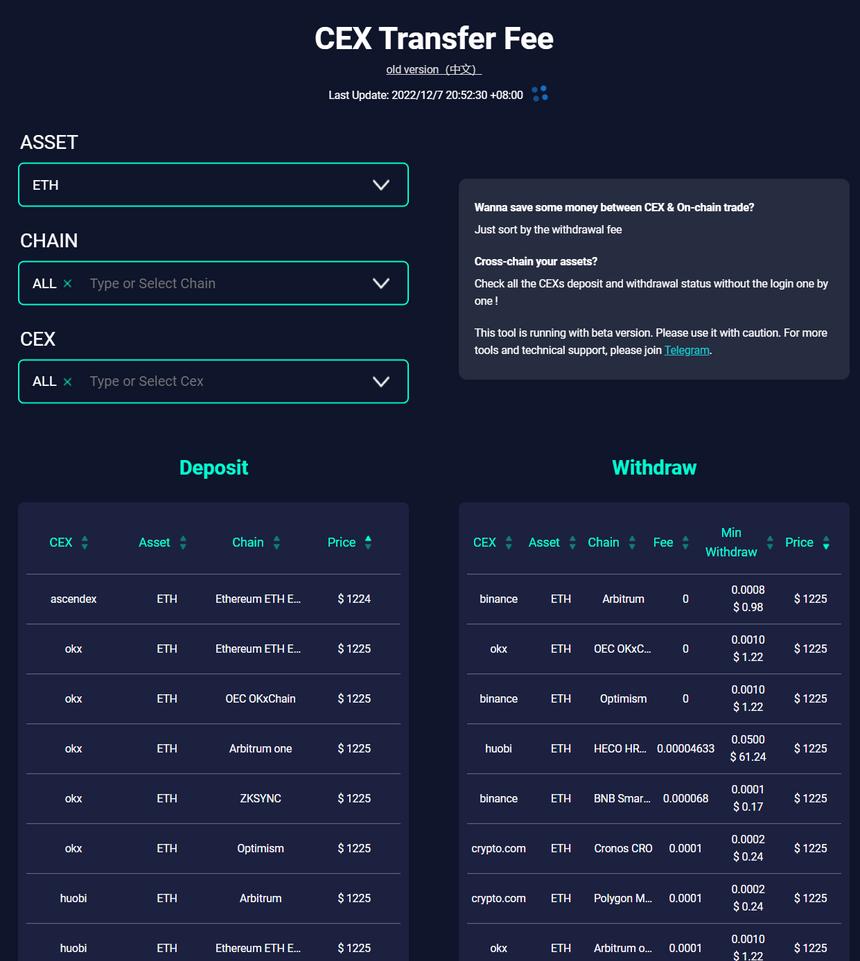
2. Centralized exchange token deposit and withdrawal
If users are worried that the decentralized cross-chain bridge is not safe, it is no problem to use the centralized exchange to deposit and withdraw assets across the chain. The CEX Transfer Fee function supports hundreds of commonly used tokens and mainstream exchanges, and lists each chain in detail. , currency and exchange wear and tear, users can choose the appropriate method according to their needs.
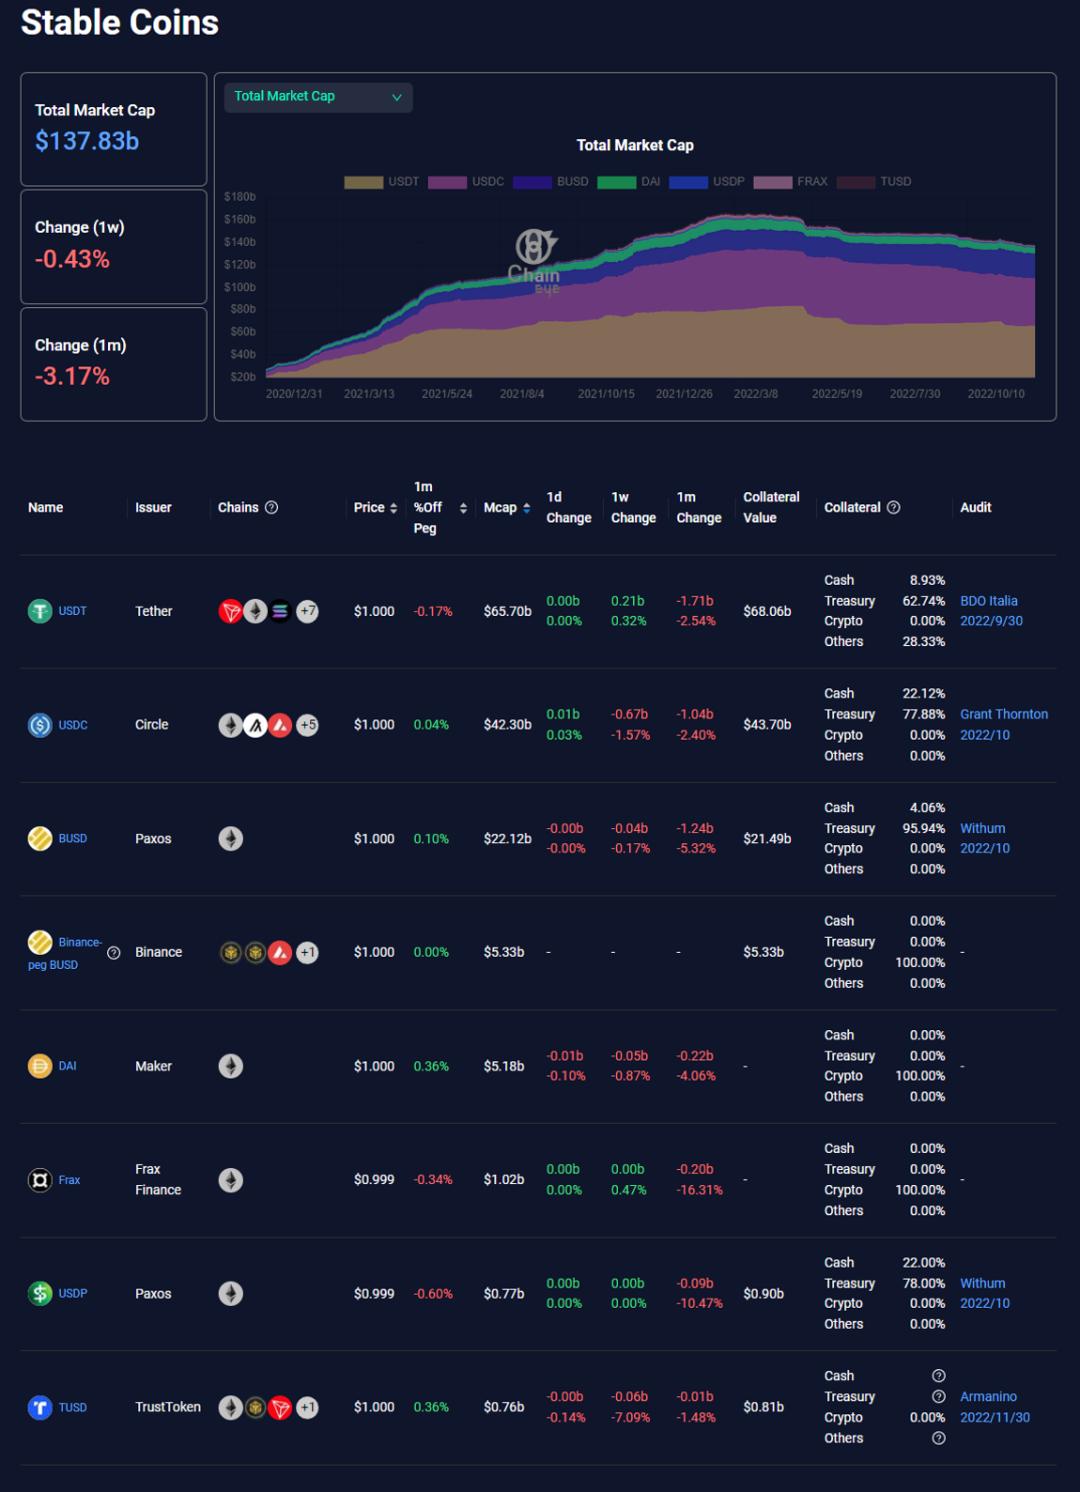
3. Stablecoin Kanban
For the mainstream stablecoins on the market, Chaineye provides the most comprehensive comparison board on the market. The content includes the total market value of stablecoins, the issuers of various stablecoins, deployment chains, whether there is any unanchoring, the collateral composition of stablecoins, whether they have been audited, and detailed audit reports are listed.
It also distinguishes between native stablecoins and non-native stablecoins (such as Ethereum's BUSD and BNB chain's Binance-Peg BUSD) , helping everyone to better understand the risks associated with stablecoins, without having to be FUD every day.
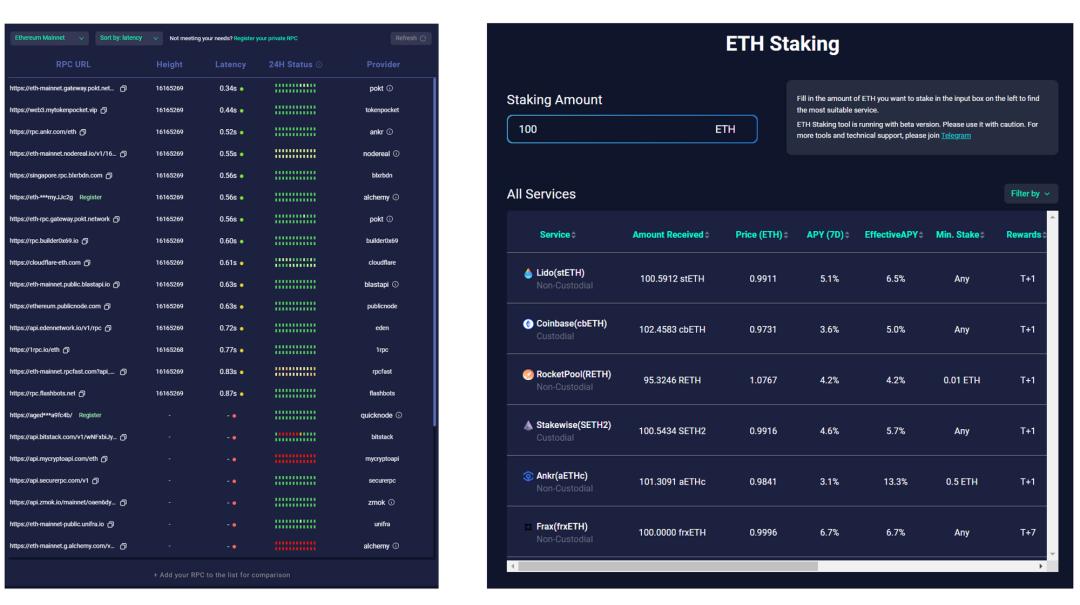
4. Comparison of ETH2.0 pledge income
After Ethereum officially converted to POS, ETH2.0 pledge has become a financial choice for many people, especially V God recently predicted that the upgrade of Ethereum Shanghai will be carried out in early 2023. At that time, the pledged ETH can be redeemed, and 2.0 pledge will no longer be " Deadly financial management”, how do retail investors choose pledgers to maximize returns?
Chaineye aggregates and compares information such as staking income, scale, and withdrawal and redemption standards of mainstream staking service providers, and enters the amount of pre-invested ETH to get a rough return result, which is very convenient.
5. RPC List
If you want to get rid of the situation where IP is monitored by Infura, Chaineye also provides RPC List, and users can choose to replace RPC according to delay and provider.
one sentence summary
To put it simply, Chaineye is an information aggregator, focusing on hotspots such as stablecoins and cross-chains, providing users with the most comprehensive information comparison, saving users time and improving user experience.
04 EigenPhi
product background
As the research on MEV has gradually become a science, more and more people have begun to pay attention to this corner of the dark forest.
EigenPhi is a research platform for MEV data in DeFi. Its feature is that it can identify and track MEV captures on the chain, such as arbitrage, sandwich attacks, liquidation, etc. While showing the MEV market, it also has detailed information on each MEV transaction. For reference.
Product Features
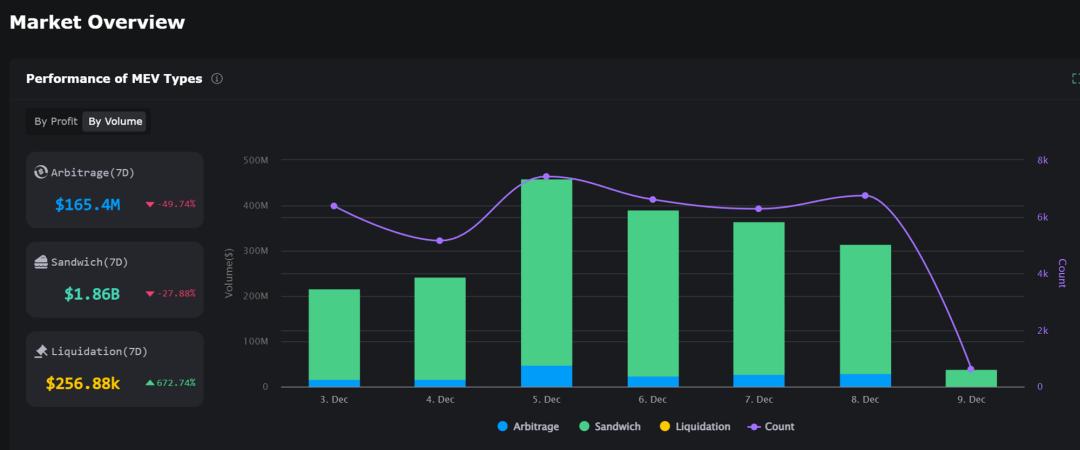
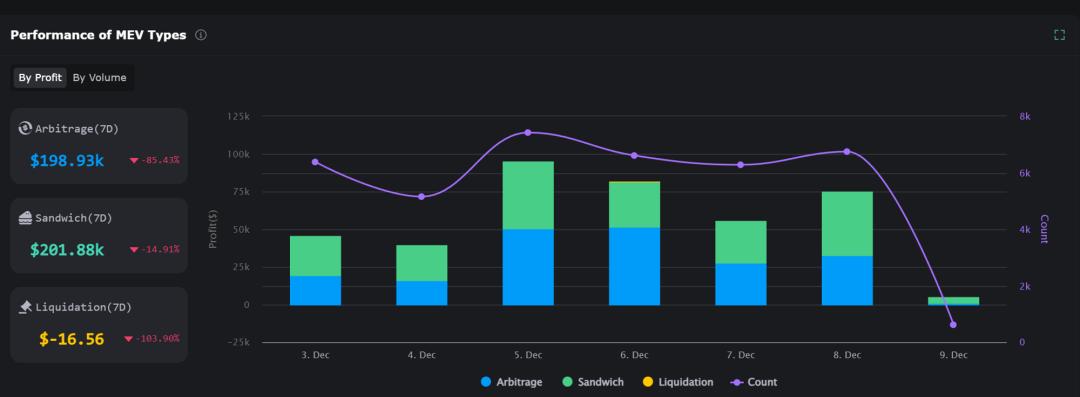
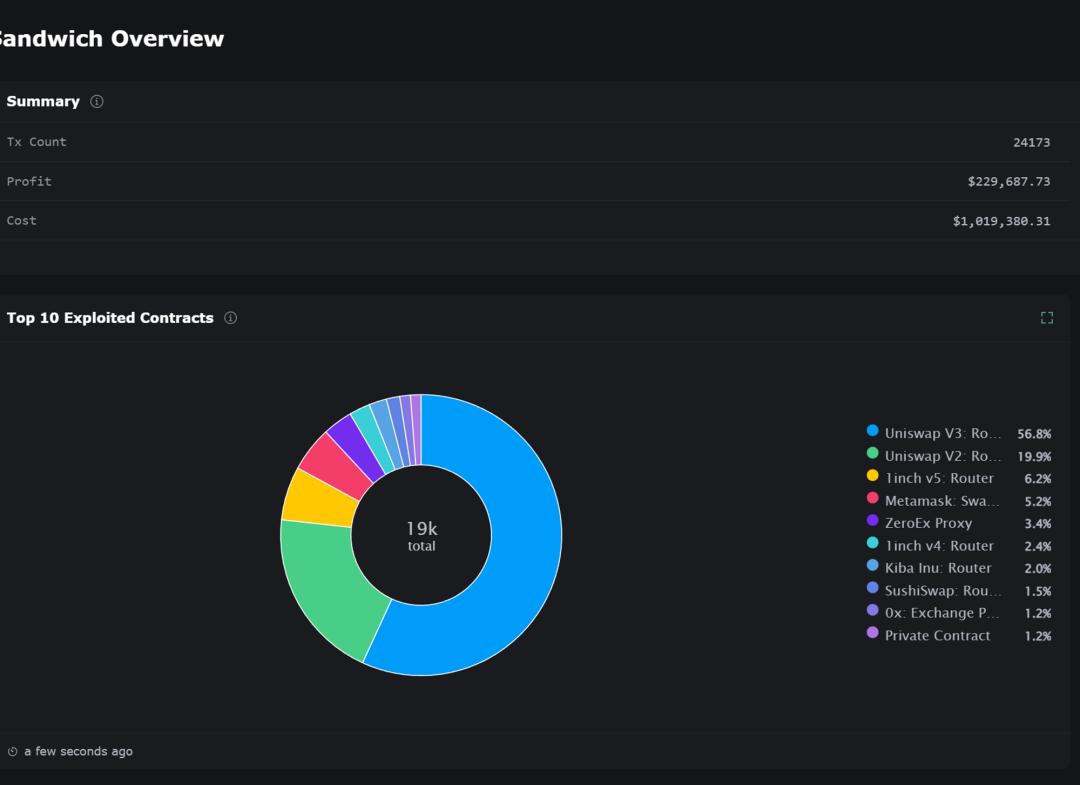
On the Overview page, EigenPhi can tell you the actual transaction volume and actual profit (gross profit - miner's fee) of each type of MEV, their respective proportions and growth conditions, which can give users a comprehensive current MEV market very clearly overview.
Observing the transaction volume and income of various MEVs, it can be found that the overall income of arbitrage accounts for about 1% of the arbitrage transaction volume, and the sandwich attack accounts for about 1/1000.
At present, sandwich attacks account for more than 80% of the total MEV transaction volume, and the most profitable ones are arbitrage attacks, which account for more than half of the actual MEV market revenue .
In other words, sandwich attacks, which we believe are bad MEVs that damage user experience, are flooding the entire MEV market. However, in fact, the benefits it can bring are not as large as good MEVs that promote market price stability through arbitrage.
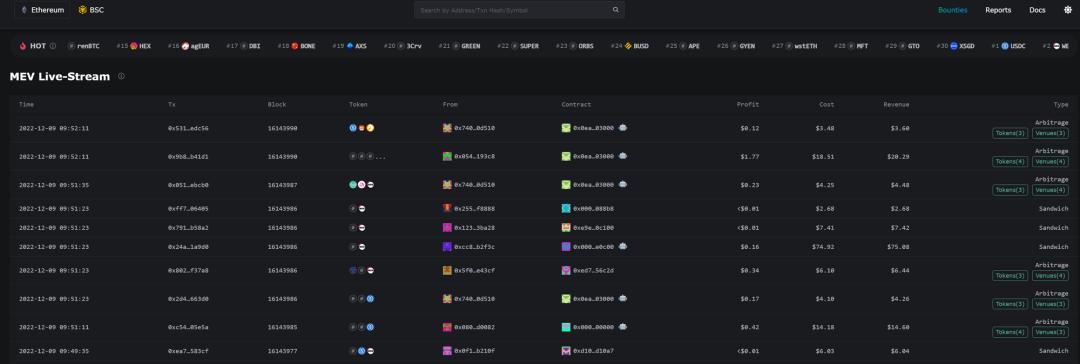
MEV Live-Stream is a very interesting function. Just like watching the stock market keep flipping in the past, it will monitor and capture the latest MEV-related transactions in real time and send them to this scrolling panel.
Users can clearly see the MEV type involved in the transaction, the contract address that initiated the MEV transaction, actual income and expenses, and other data.
Interestingly, we can often see transactions with almost zero or negative returns, such as failed arbitrage, sandwich attacks with extremely low profits, etc.
For friends who are not familiar with MEV or feel discouraged by the high technical threshold of MEV, you may wish to take a look at this panel more, and you will be glad that you have lost a way to lose money.
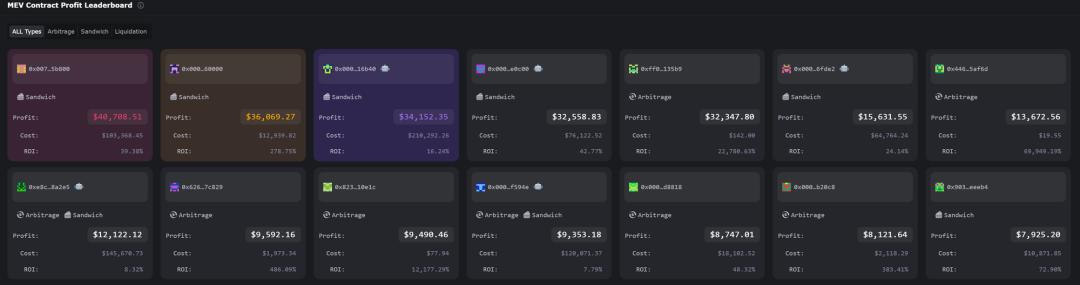
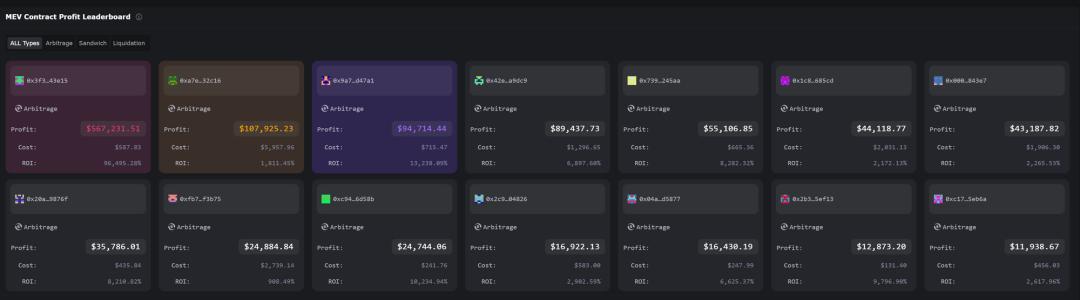
Of course, there are also many powerful MEV players. From the perspective of the leaderboard, it is interesting that the MEV income on BSC is much higher than that on Ethereum. The number one player on BSC earned $567k at a cost of $587, and the return on investment is as high as 90,000%. beyond reach.
The first profit on ETH is $41k, the cost is $103k, and the return on investment is only 39.7%; half of the top gainers on MEV on Ethereum are from sandwich attacks, and half are arbitrage. The return on investment of arbitrage Tend to be larger, sandwich attacks are less profitable and cost more.
Users can view details according to MEV profit methods, for example, view the transaction distribution of sandwich attacks. UniswapV3 is the hardest hit area, accounting for more than half. You can also see when the most recent attack occurred, the tokens involved, and the profit situation.
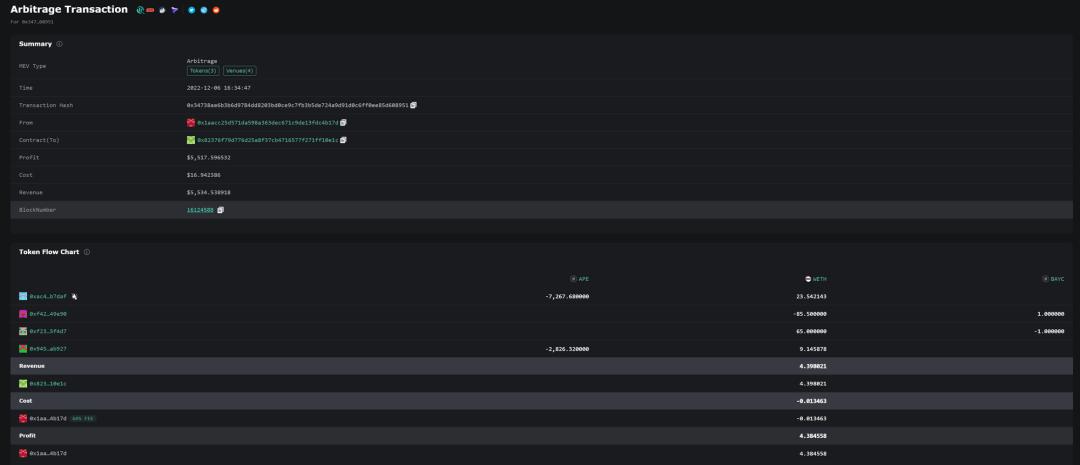
In EigenPhi, each MEV transaction can clearly see the entire operation behavior and logic, simplifying and revealing details such as complex interaction process, transaction cost, profit, etc., which is easy for users to understand.
Share an interesting arbitrage: the arbitrage contract (0x8) lent 90 ETH from DYDX Flash Loan, purchased #1633BAYC, and obtained 10,000 Ape pledged under the NFT at the same time, after converting Ape into 32.68 ETH, and The NFT was sold at a price of 65ETH with a profit of 4ETH. The record in EigenPhi is shown in the figure below:
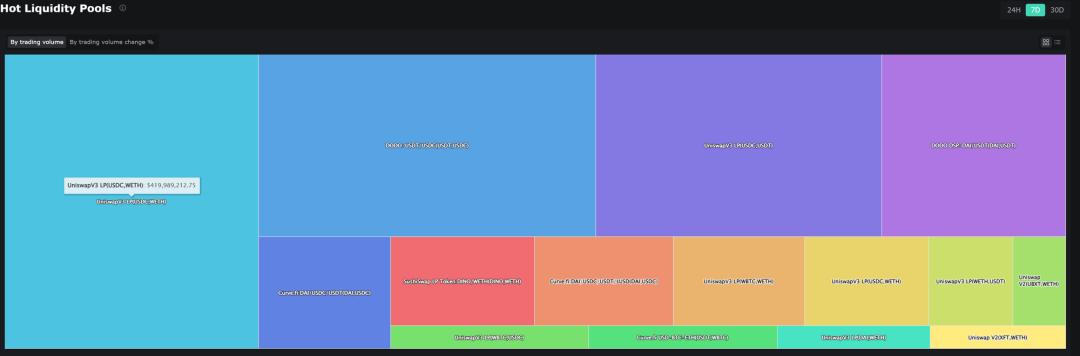
Currently in the MEV part, EigenPhi's data supports the Ethereum and BSC chain parts. In addition to MEV, EigenPhi also provides liquidity pool distribution monitoring, specifically which pool of which protocol has the largest transaction volume;
Malicious Token (Malicious Token) identification function. Malicious Tokens refer to tokens that charge transfer fees or transaction fees without notifying users, helping users avoid risks.
At the same time, EigenPhi also has a Research section, which provides their latest research reports, which are worth reading.
one sentence summary
EigenPhi is a data analysis platform focused on the MEV market. It can identify and track various MEVs, analyze the MEV market with visual charts, and disassemble each transaction.
Provide researchers with MEV research data, and provide ideas and references for MEV enthusiasts.
05 Genii Data
product background
GeniiData is positioned as a data analysis platform focusing on cross-chain data analysis and API factories, featuring high performance, high data reliability and wide coverage.
It provides professional tools for personal data studios to discover, verify and build Web3 by conducting blockchain analysis. For enterprises, GeniiData is an incubator for decentralized applications, providing access to a comprehensive on-chain data API.
GeniiData is an open platform driven by its community, allowing users to share complex data insights and collaborate on applications in the Web3 ecosystem.
Product Features
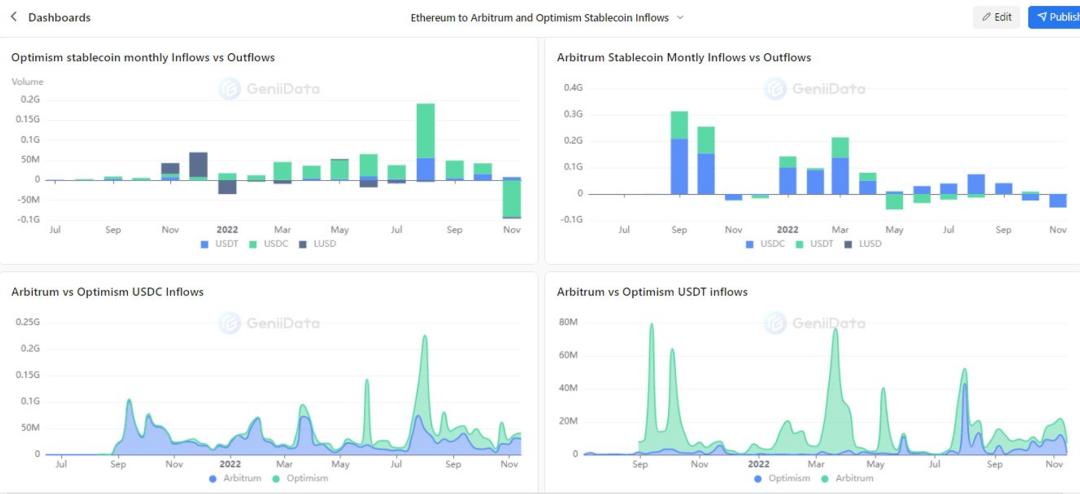
1. High granularity multi-chain analysis + powerful cross-chain analysis function + excellent user experience
GeniiData currently analyzes more than ten chains, including BTC (most data platforms do not have BTC data) and some new public chains, layer2, such as Aptos, StarkNet, more analysis chains bring richer analysis content.

With the development of blockchain, the new pattern of multi-chain parallelism will be the general trend. Many giant protocols, such as Uniswap and Aave, will be deployed across chains, and even Aave V3 has new functions for cross-chain access. The analysis on the chain will become more and more one-sided.
GeniiData provides a powerful cross-chain analysis function. Users can summarize and compare data on each chain to obtain more comprehensive and higher-dimensional insights.
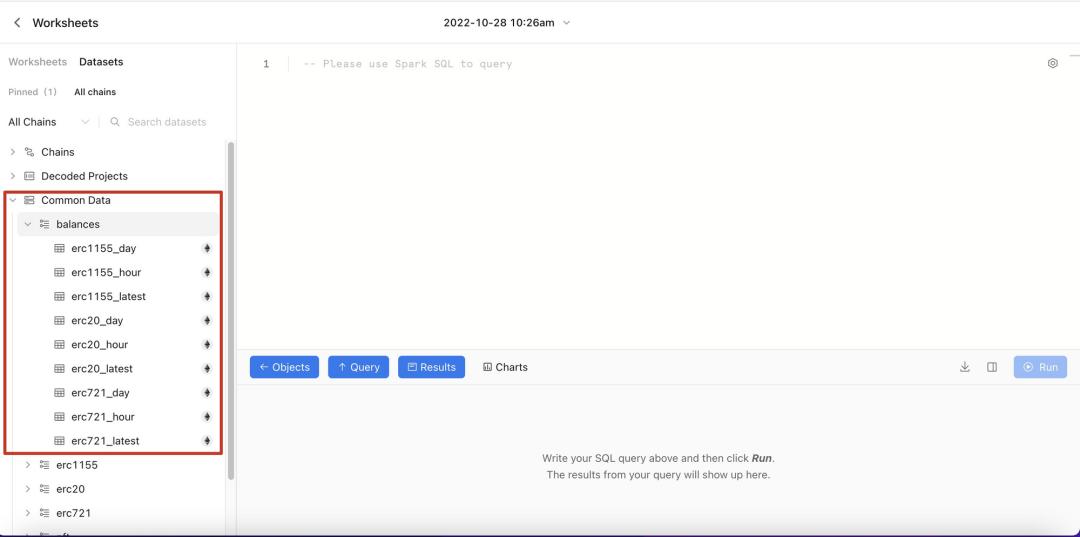
In terms of user experience for data query boards, GeniiData is one of the best in the market. The page is simple, the structure logic is clear, and there are many commonly used abstract tables, such as various standard tokens. Great convenience.
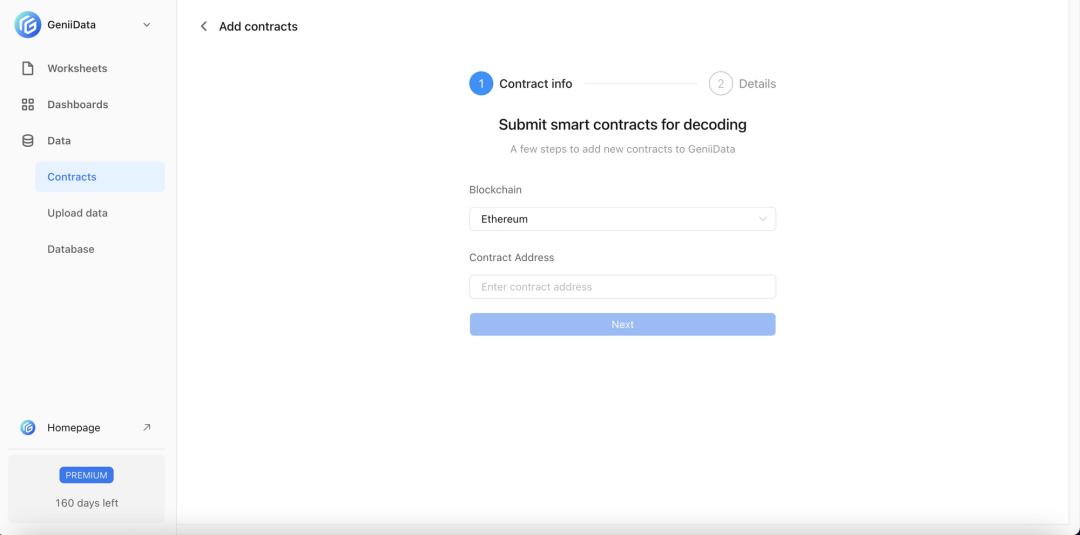
2. Smart contract automatic decoding function
On most data analysis platforms, the analysis of a smart contract for a certain project is often labor-intensive. It is necessary to submit an application, and the staff will manually analyze it after manual review. It will take 2-3 days at the fastest, and a week or two at the slowest.
GeniiData provides automatic decoding of smart contracts without verification, and the decoding can be completed within a few hours after the contract is submitted. This is very helpful for the research of focused projects. After decoding, the complete event data is obtained, which is more convenient for analysis.
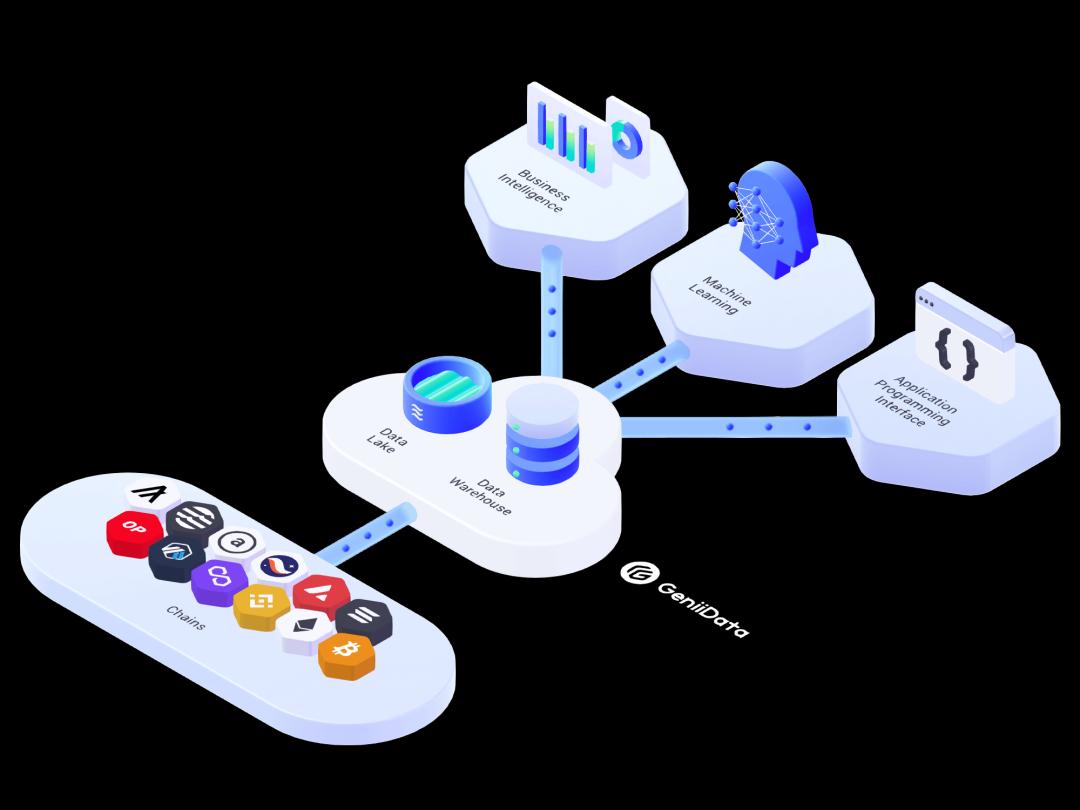
3. Data product drivers
The competition in the data platform API market is becoming increasingly fierce. GeniiData plans to build an API factory, taking into account the historical integrity and timeliness of data query, and becoming the driver of Web3 data products. It uses easy-to-build APIs to provide stable and efficient services and supports access amount of toC business.
At the same time, GeniiData also supports machine learning, opening up a new pattern for training data on the chain and exploring Web3 with artificial intelligence.
one sentence summary
GeniiData is industry-leading in the diversity of resolution chains, historical data integrity and user experience. The innovative smart contract automatic analysis function improves research efficiency, and the API factory provides assistance for data products.
06 MetaDock
product background
MetaDock is different from several other data platform products. It works in the form of a browser plug-in, aiming to optimize the user's blockchain browser experience.
Product Features
1. Aggregated various EVM blockchain browsers, omitting the step of searching the blockchain browser, and directly querying in the plug-in, but only part of the EVM chain is supported.
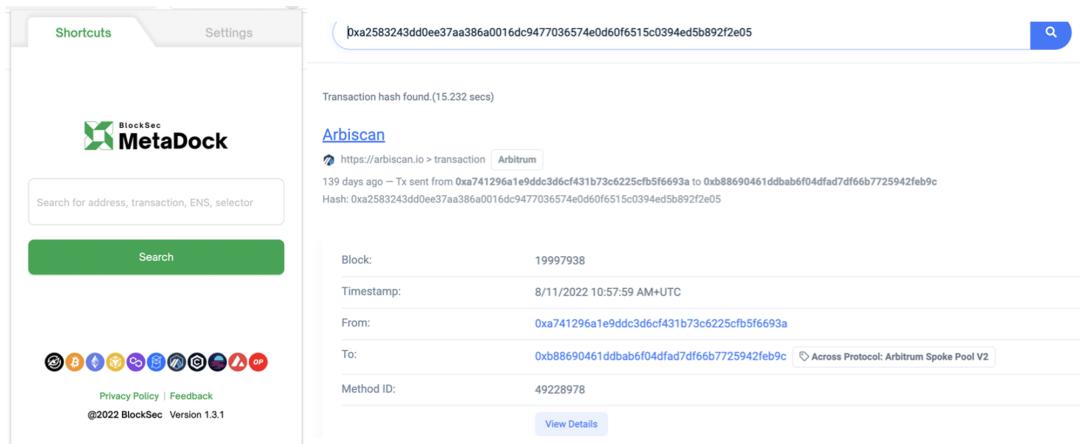
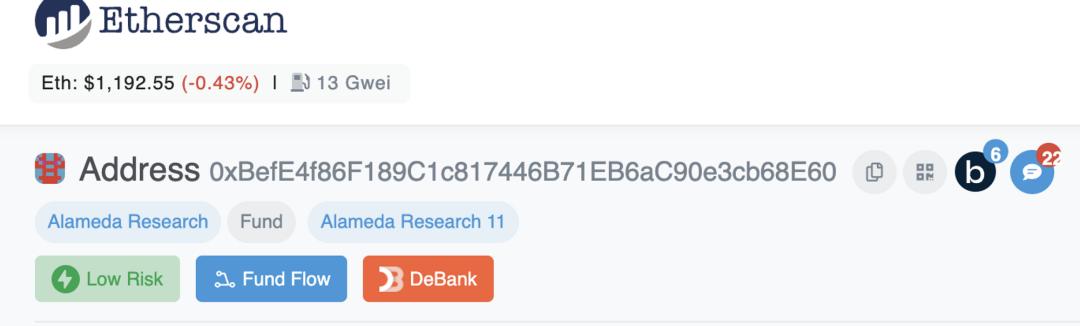
2. As a webpage plug-in, some label functions will be added when linking to the blockchain browser, such as account risk warning low/high risk, and hyperlinks to some commonly used tools, such as DeBank.
3. Money flow. Click on Fund Flow in the tab bar, and you can visually see the associated account of the query account and the fund flow diagram. Through the filter in the upper right corner, you can choose to display the specified transfer address/entity, or currency.
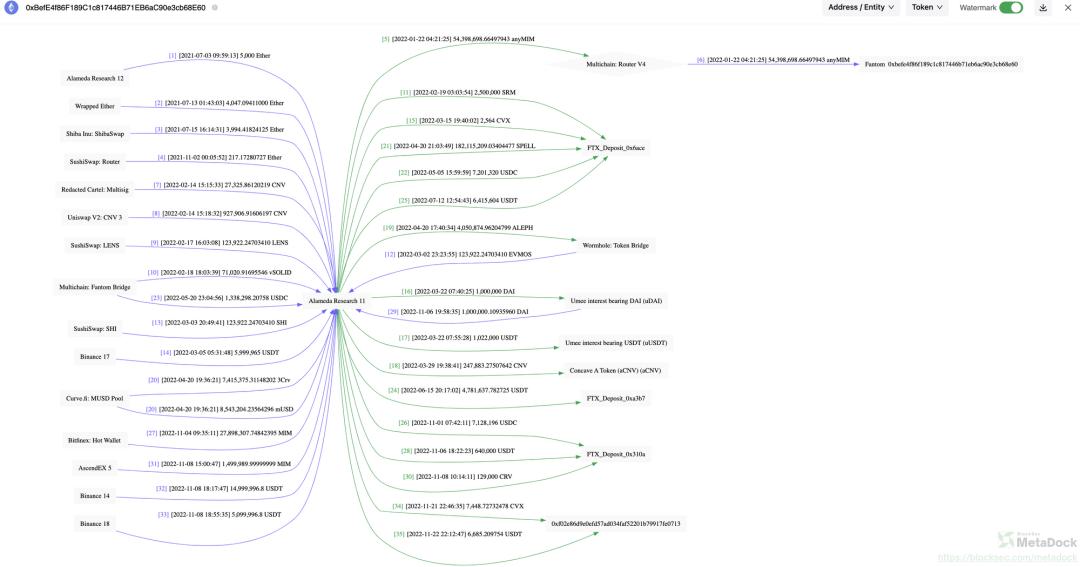
one sentence summary
MetaDock is a Chrome extension to improve the user experience of blockchain browsers. On the one hand, it aggregates multiple evm-compatible blockchain browsers and adds address tags;
On the one hand, it provides fund flow tracking, which is a practical gadget.
07 Zettablock
product background
ZettaBlock is an enterprise-grade full-stack Web3 infrastructure for indexing and analytics, connecting on-chain and off-chain data.
ZettaBlock is mainly aimed at enterprise teams and developers. On the platform built by Zettablock, they can quickly build real-time, public-facing, and reliable GraphQL APIs through SQL.
Applications built on top of ZettaBlock only need to interact with a small number of general-purpose and user-friendly APIs that provide efficient access to a large number of isolated data sources, and developers can easily customize the APIs to suit their own business logic.
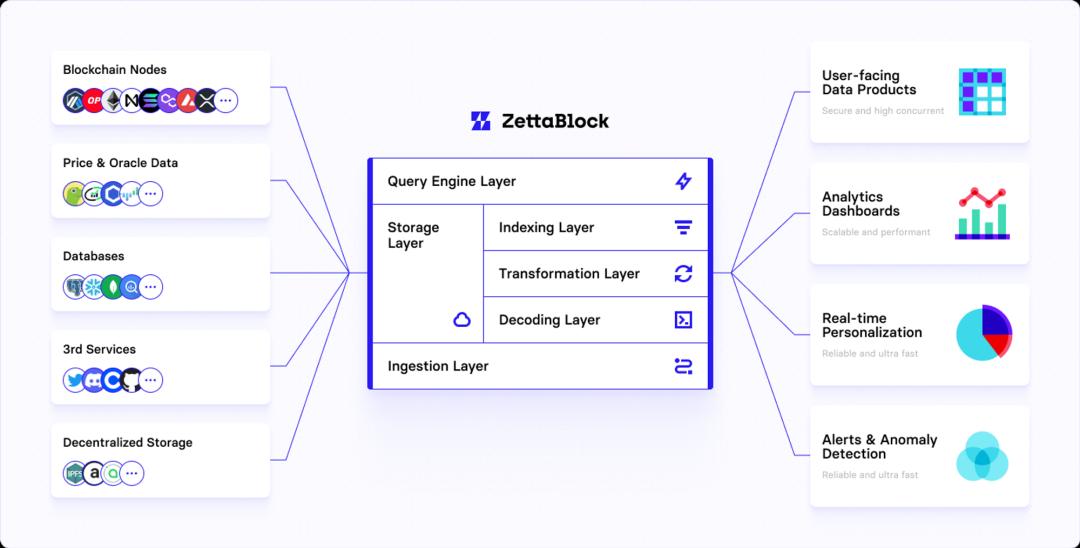
Features of Zettablocks
full stack. Provides a unified data platform with streaming, OLTP indexing, OLAP analysis and visualization architecture, and hundreds of ready-to-use blockchain datasets;
flexibility. Build your own GraphQL API and SQL based on custom transformation logic needs;
real time. Customized API with 10 millisecond response time and sub-second data freshness and high throughput of processing;
Data unification. Seamlessly obtain any decoded on-chain data and combine it with your own off-chain data;
Scalable. Use SQL to easily connect PB-level data;
reliable. Ensure near-perfect system uptime (99.99%) to support real-time, data-intensive applications.
ZettaBlock currently supports Ethereum, Polygon, Arbitrum, Aptos, Solana, Ripple XRP, IoTex, and Aptos. The technical team has very strong engineering capabilities. In just a few months, they built a powerful data platform from scratch, and now they can experience the public beta version.
Product Features
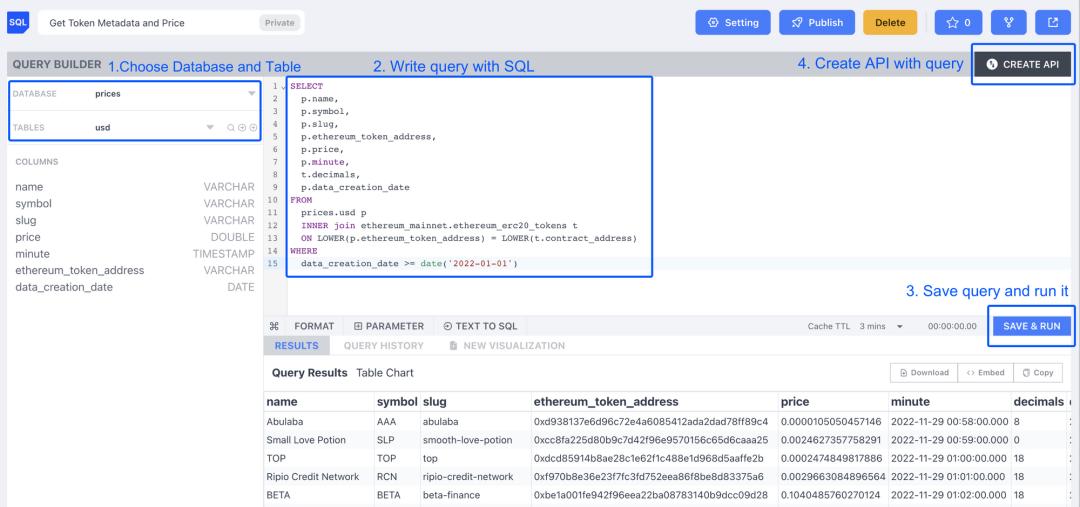
1. Zettablock provides a fast, efficient and highly customized on-chain data analysis platform
The use process is almost the same as most customized data query platforms (such as Dune, Flipside). It is the same to get started with SQL query, visualize data, integrate and make Kanban, and the query speed is fast.
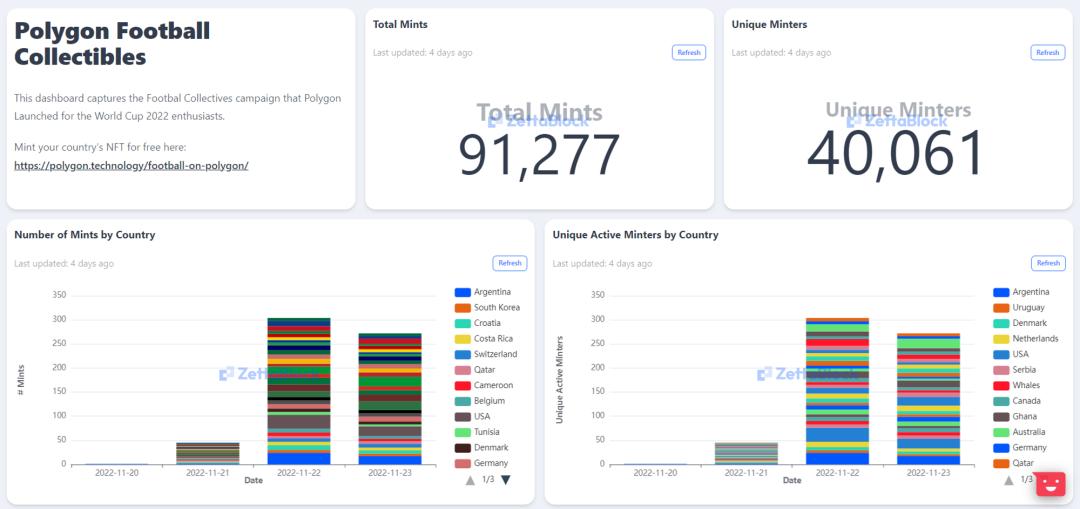
The difference is that after the query is completed, the automatic API generation function can be used to package it into an API that can be called flexibly. This greatly expands the application scenarios of data analysis and provides a hotbed for entrepreneurship of data analysis products.
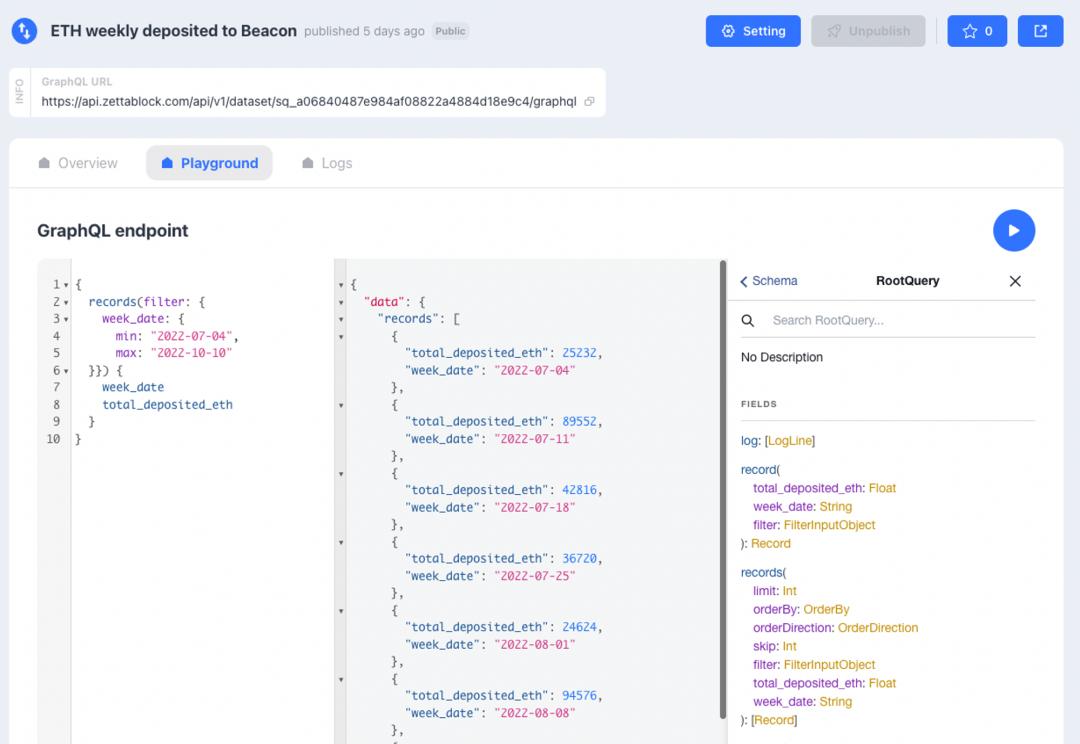
2. Rich and flexible API services are the characteristics of ZettaBlock. Currently, the platform provides three types of APIs
Custom API (Custom API)
The custom API is a GraphQL API endpoint. Users can write SQL queries and build them easily through ZettaBlock's API builder. The custom GrahQL API is real-time (100ms latency), cost-effective (1000x cheaper than analytics APIs), and can handle high QPS, making it ideal for API support for consumer-facing dApps.
Data Lake API (Data Lake API)
Data Lake API is an analytics API for interacting with ZettaBlocks' data lake. Users can use it to submit arbitrary SQL queries to the data lake and get results accordingly. For large numbers of results, it is also possible to access and write files using streaming mode.
Pre-built API (Pre-built API)
The pre-built API is a collection of GraphQL APIs built by the ZettaBlock team and the community. The pre-built API is designed to meet common query and indicator needs, somewhat similar to Dune's Spellbook, avoiding reinventing the wheel.
3. On-chain data + off-chain data
When doing data analysis, a problem that is often encountered is that the on-chain and on-chain data are fragmented and cannot be integrated to form a comprehensive analysis. Zettablcok has made a breakthrough on this point, supporting the aggregation of off-chain data, on the one hand through community contributions.
For example, the protocol_mappings table from the Polygon team, and on the other hand some well-recognized data sources such as CoinGecko (eg prices.usd table).
At the same time, various teams and analysts can also upload data to their independent data lakes in Zettablock, which is convenient for combining on-chain and off-chain data for more comprehensive and complete analysis without losing the privacy of the data.
In the future, Zettablock will also launch an API market, so that developers can benefit from it. The basic process will be: developers use the data set provided by Zettablock to use SQL to query, for example, "users who have held BYAC for more than one year and How many people actively purchased this NFT?" After the query is completed, the API is automatically generated through the API generator and placed in Zettablock's API market.
Other users who are interested in this query can directly use the API and pay, and the creator will automatically receive a rebate, making it possible for individual developers to realize their good ideas, knowledge and skills.
one sentence summary
ZettaBlock is a full-stack real-time web3 data infrastructure for indexing, analyzing, and connecting on-chain and off-chain data. Developers can use ZettaBlock to easily build real-time, reliable, and data-intensive applications as the cornerstone of data products.
08 Summary of seven data products
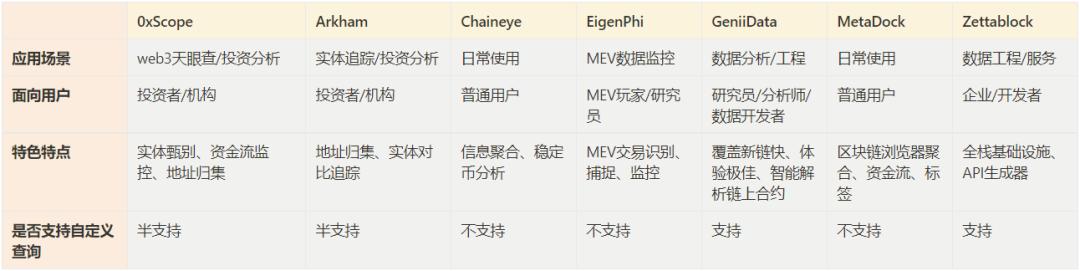
Through the above introduction, it is not difficult to find that the development of emerging data products mainly revolves around three functions:
Entity screening
Cash flow
APIs
The entity abstracts multiple associated addresses together, which is of great help to improve the quality of data analysis, which is much more valuable than the analysis of a single address.
In addition to publicly disclosed addresses such as institutions and exchanges, more hidden addresses must be discovered by the data platform itself. This area depends on the skill of each company. The depth of mining through their respective algorithms and the breadth of entity screening are all points of competition.
Obviously, there will be some discrepancies in the address collection and entity screening of each company, which will also bring doubts to users. There is no way to compare and verify a piece of data, and it seems that they can only choose to "blindly" choose to believe.
In fact, this is really the case, and only a vague correctness can be obtained. To borrow Kofi's words, it is difficult to say which data is correct.
The visualization of capital flow is convenient for investors to analyze investment, especially combined with the functions of entity identification and address collection, it can basically analyze the addresses worth tracking, and then give early warning.
The API service of the data analysis platform is another major point of competition, and everyone is vying to be an API factory. With the growing demand of users for data on the chain, more data-based Dapps and gadgets will appear. The flexible features of API are very suitable for these Dapps to be built on the basis of data analysis platforms, and further let data analysis platforms act as infrastructure role, and can also absorb the traffic brought by data products.
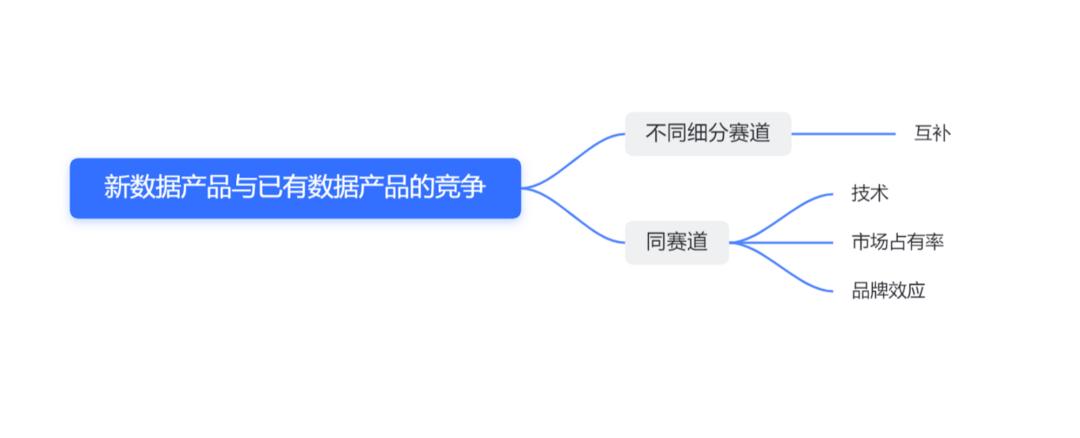
The relationship between emerging data products and existing products is complementarity and competition . On the one hand, due to the increase in the market, the coverage of existing products is not enough, and new products fill the gaps in the new subdivision track; on the other hand, if new products and existing products are on the same track, the competition between them mainly revolves around the following several aspects:
technology. Whether the new product has more advanced technologies, such as faster data processing capabilities, more powerful analysis functions, simpler development interfaces, etc. These advantages can make new products more competitive and attract users to use;
market share. Existing products may already have a certain share in the market, have more users and customers, and form a stable profit model; how to develop new products through special functions, better user experience, and more aggressive marketing? The market is the key to the success of the product;
brand effect. Existing products may have established a good brand reputation with high popularity and reputation. These advantages can make it easier for existing products to gain users' favor and attention, bringing about network effects.
The importance of data on the chain comes from the gradual maturity of blockchain technology and the vigorous development of applications. The flexible use and combination of various data products will provide us with a new perspective in the crypto world.
By analyzing the data on the chain, users can obtain more comprehensive and accurate information to assist in research or investment; through the transparent and non-lying data on the chain, they can also raise a bright light for themselves when they are moving forward in the dark forest , Light up the front to protect yourself.
References
[1] Become an on-chain data analyst
https://sixdegreelab.gitbook.io/mastering-chain-analytics/00_introduction
[2] My take on the Crypto Data Landscape 2022
https://twitter.com/zk7hao/status/1576492616715116547
[3] Detailed explanation of 0xScope Protocol: How to become a Web3 user portrait "engraver"?
https://www.panewslab.com/zh/articledetails/5e5ep35r.html
[4] 0xScope—Innovating Web3 data analysis paradigm with knowledge graph https://mirror.xyz/0xB134928B00c6c76b939D8715a6dc1e1dAe5B5b6e/q8lWLYL0Ei4CL3sTvdbhldZNoNp-FkbMw8QP0lvai3M
[5] The EigenPhi Way
https://eigenphi-1.gitbook.io/classroom/eigenphis-methodologies/the-eigenphi-way
[6] Welcome to Zetta Block
https://zettablock.readme.io/docs
[7] GeniiData Documentation
https://geniidata.notion.site