Author: Changan I Biteye Content Team
Weather isn't like an election; it doesn't have a particular stance. It's not like the NBA; it doesn't have a favorite team. But it's precisely this market that attracts a flood of domestic users. The reason is simple: everyone has their own experience, and everyone thinks they understand Shanghai's weather.
But "feeling like you understand" and "being able to make money" are two different things.
Biteye is sharing three things today:
Understanding the settlement rules
Establish weather forecasting methods
Use the system to find trading opportunities that others can't see.
First, we need to figure out how the weather market actually settles its accounts.
1. The temperature at which the liquid is settled is not what you think.
Many people make a mistake when participating for the first time: they use a weather app on their phone to bet on the highest temperature. However, the app displays the temperature in downtown Shanghai, while Polymarket uses the actual measured data from Shanghai Pudong Airport (ZSPD weather station) for settlement. This data is publicly available through Wunderground, an American weather platform. PM directly reads the records on WU as the basis for settlement.
Two locations, two figures. Pudong Airport is located on the east side of the city, adjacent to the mouth of the Yangtze River. Influenced by sea breezes, its temperature is usually lower than that of the city center. This difference is not usually noticeable, but at the critical juncture of a bet, it can be the difference between betting correctly and betting incorrectly.
That's why you see this kind of confusion in the weather market comments section: "It feels warmer today than yesterday, so why is the displayed high temperature lower?"
2. The numbers are correct, but the unit is not what you expect.
WU's data comes directly from the hourly METAR reports (a weather telegram format used in global civil aviation) submitted by the airport.
Here's a detail: METAR records Fahrenheit integers, while WU directly displays the number without conversion or correction.
Most weather forecasting systems and meteorological models output temperatures with decimal points. The more precise your model's calculations, the easier it is to overlook this coarsest detail.
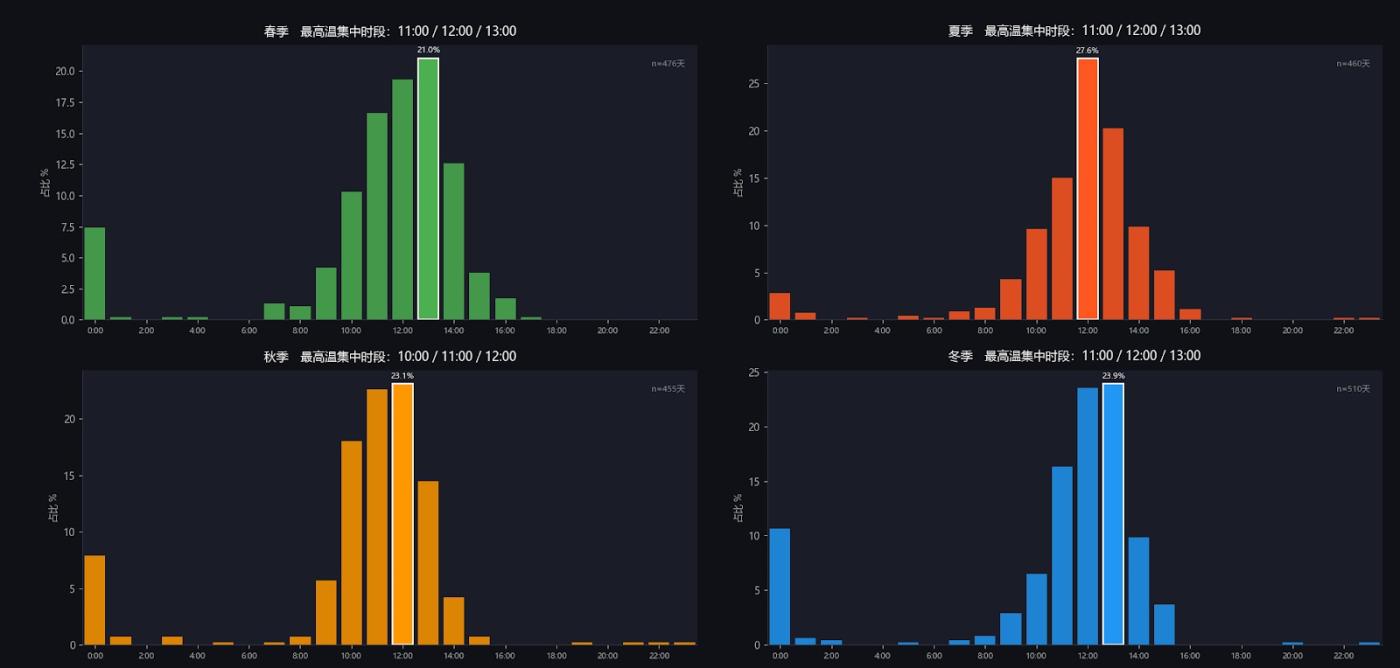
3. Shanghai Temperature Pattern
After analyzing nearly 1900 days of data from the ZSPD station, it was found that the periods of highest temperatures in Shanghai were more concentrated than expected:
All four seasons are highly concentrated between 11:00 and 13:00.
The concentration is highest at 12:00 in summer, accounting for 27.6% of the total for the entire season in a single hour.
The peak time in autumn is slightly earlier, with 10:00 being one of the high-frequency times.
Knowing the patterns is the first step, but patterns don't operate on their own. It's about knowing when the daily high temperature will occur, whether it has been surpassed, and how far it is from reaching its target.
So I built this system: before each day's settlement, it predicts as accurately as possible which Celsius level the day's highest temperature will fall.
Two out of five methods, three of which worked.
Once the market rules are clear, the next question is: how do we predict the day's highest temperature?
As a complete novice in meteorology, my first step was to ask ChatGPT: how exactly does the meteorological industry calculate the day's highest temperature, and what are some established methods? ChatGPT provided a theoretical framework, and Claude translated that framework into code. Working together, the two AIs got the system up and running in a weekend.
I tried five methods in total, but only three of them worked.
It ran successfully:
1️⃣ Integrated forecast of WC + ECMWF
Predicting the highest temperature first requires data. Two sources were used:
Weather Company (WC) is a commercial weather API that provides highly accurate hourly forecast data.
ECMWF is the European Centre for Medium-Range Weather Forecasts' global weather model, which is more sensitive to large-scale weather systems.
Both sources have their advantages and disadvantages, so they are weighted and voted on. The weights are dynamically adjusted based on the weather type of the day: WC is more reliable on sunny days, while ECMWF is more reliable on cloudy days with high wind speeds.
2️⃣ Real-time correction: Calculate peak values using temperature rise data
The forecast was calculated last night, but the weather has been changing all day. So what this module does is: use the actual measurement data that has already occurred this morning to estimate the highest possible temperature today.
The logic isn't complicated. We discovered that Shanghai's temperature rises fastest between 8 and 9 AM. After obtaining the measured temperature at this time, the system checks historical data: how many degrees Celsius it could rise on average at the same time and season in the past.
Then add two corrections:
More clouds mean a discount; the thicker the cloud cover, the more hindered the warming process.
The wind is also multiplied by a discount, as strong winds accelerate heat loss. An "extrapolation estimate" is calculated.
Air pressure, dew point, and humidity were also included in the calculation, but they were removed because backtesting revealed that these factors had a small impact and low correlation.
However, extrapolation alone is not stable enough. Here, we use the concept of Kalman gain, which is simply a weighted average between the extrapolated result and the original forecast. Moreover, this weight will automatically change over time.
At 6 a.m., extrapolation only accounted for 20%; the majority was still based on forecasts.
By noon, external referrals accounted for 72%.
After 1 PM, almost all actual measurements were accepted, accounting for 85%.
The later it is, the more important the events happening in the present moment; the earlier it is, the greater the reference value of historical forecasts.
After 2 PM, the system judges that the peak has most likely passed, and directly takes today's highest temperature from the historical records to lock the result, without further calculation.
3️⃣ Is today a day with rising temperatures?
This is the most satisfying module in the entire system. Every morning at dawn, it makes a judgment: Will today's highest temperature be higher than yesterday's?
Every day between 2 and 4 a.m., the system collects a batch of meteorological data and feeds it into this model.
Changes in air pressure over the past 3 hours and 12 hours
Wind direction and speed, cloud cover at dawn
Yesterday's temperature fluctuations, the temperature trend over the past three days, and whether yesterday's temperature was higher or lower than average.
Add the month, season, day of the year, and whether it rained yesterday.
The model output is divided into five levels: warming days, slightly warming days, stable days, slightly cooling days, and cooling days, along with the confidence level.
However, the accuracy of this method varies greatly in different seasons.
Most accurate in winter: When cold air arrives, air pressure rises sharply and northerly winds strengthen, the signal is extremely clear, and the model can tell at a glance.
Autumn is the worst season: cold and warm air masses repeatedly clashed, temperatures rose today and fell tomorrow, and historical patterns broke down the fastest in this season.
Methods of elimination:
Fourier numerical prediction
The earliest attempt was to use Fourier analysis to fit the periodic patterns of historical temperatures to see if it could directly predict the day's highest temperature.
The results showed that it could only tell you "the historical average temperature for this season." Shanghai's weather is too random; the Fourier fit produced a smooth average curve, not the true daily fluctuations. The error was 3.6°C, and it was a 100% systematic underestimation, so it was directly deleted.
ERA5 Peak Prediction
ERA5 is a global historical reanalysis dataset from the European Climate Centre, used to predict what time the day's highest temperature will occur.
Backtesting
Accuracy rate of 59.6% within 1 hour.
Accuracy rate of 81.3% within ≤2 hours
It sounds okay, but the problem is that PM is more accurate, and the time window for traders to make judgments is very short. If you can't make peak judgments within half an hour, it's better to look at Polymarket's data. So this method was eliminated.
III. System Practice: Two Case Studies and Reflections on Shortcomings
Polymarket's weather market opens for trading four days in advance, and popular temperature ranges are usually fully priced in early on. Buying directly at high-probability ranges has a poor risk-reward ratio.
Therefore, the strategy I adopted was to wait for the signal and the time window after the market heated up before entering.
Therefore, based on the self-built weather system, the following two operations were performed:
Case 1:
Early on the 16th, the Telegram channel pushed out a nighttime report: tomorrow will be a cooling day. The reason given was that the cloud cover that night was relatively thick, and both seasonal and yearly date characteristics pointed to a cooling trend.
At this point, I didn't place a bet immediately. The signal from the early morning was only the first layer of reference.
At 11 a.m., the system pushed out a real-time report on the warming period. At that time, the actual measured high temperature had reached 12°C, and the +1°C probability score gave the result: the probability of a further 1°C increase today was 42%, leaning towards no further warming.
Combining the cooling signal from the early morning logistic regression, and with both modules moving in the same direction, the signal was much clearer than it was in the early morning. Therefore, I bet that the highest temperature on the 16th would not exceed 13°C.
Daily temperature: 12°C. The temperature was 15°C the day before, on the 15th, so it dropped by a full 3 degrees.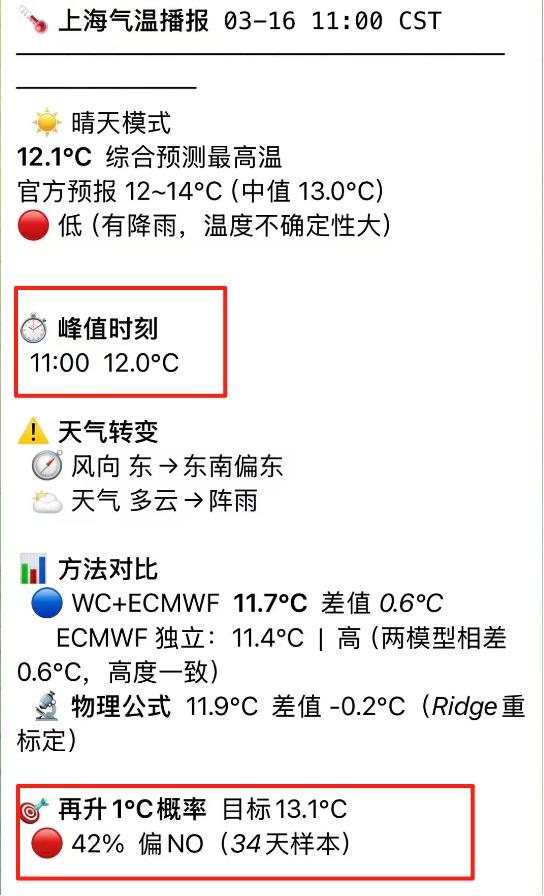
Case 2:
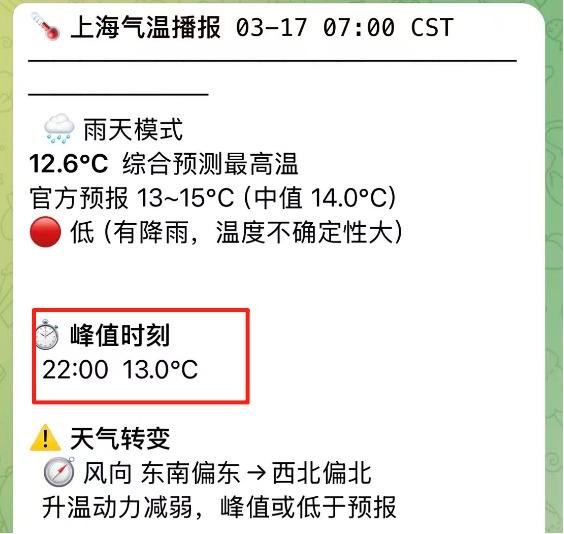
For example, regarding Shanghai's weather today, the 17th, the weather system even served as an early warning system: the push notification received at 7:00 AM indicated an abnormal peak time: 22:00.
Normally, the highest temperature on a sunny day occurs between 1 and 3 pm, but today the peak was at 10 pm, indicating that this was not due to sunshine warming the air, but rather the transport of warm and humid air overnight. It rained all day, with 97-100% cloud cover and almost no sunshine.
At this point, opening Polymarket revealed that the 12°C was still priced at 53%. Some in the community were puzzled: "It's already afternoon, the temperature is only 11°C, the normal peak hours have long passed, why are people still buying the 12°C?"
Behind this confusion is that people are still using the logic of sunny days to judge the market on rainy days.
The system won't get confused. It identified today's weather type this morning, noting an unusual peak time and a significant discrepancy between current temperature and market expectations. This is an information gap, and information gaps are trading opportunities.
This is precisely the significance of building this system: it makes it easier to identify opportunities and provides faster warnings of risks.
What other shortcomings does the system have?
It's impossible for a system that's been built over a weekend to be without vulnerabilities.
The accuracy rate for autumn weather forecasts is only 63.7%, almost like flipping a coin. Cold and warm air masses repeatedly clashed during this season, with temperatures rising one day and falling the next; historical patterns break down most quickly in autumn.
Barometric pressure features are not available in live trading. Barometric pressure changes were used as features during model training, and backtesting results were good. The signal of cold air passage is very clear. However, during live trading, the current interface cannot obtain real-time barometric pressure data.
Coastal correction is still awaiting data activation. The sea breeze effect at Pudong Airport is real, and the system has built a corresponding correction module, but the backtesting sample size is still insufficient.
Finding these issues on a system that's only been running for a weekend is already a success. We'll continue fixing them as we run the system.
Conclusion
Meteorology has developed for centuries, utilizing satellites, supercomputers, and global models, yet weather forecasts still cannot guarantee 100% accuracy for tomorrow. This isn't because scientists haven't worked hard enough; it's because the atmospheric system itself is chaotic, and a difference of even one degree in initial conditions can lead to completely different results.
This system, which ran for a weekend, was bound to make mistakes. Its accuracy in autumn is close to that of a coin toss; if cold air arrives early, the system might not have reacted in time; and the sea breeze effect hasn't been fully captured yet.
But that's not important. You don't need to be right every time you predict the market; you just need to have one more layer of information than the market when the odds are in your favor.
The Shanghai weather market is still in its early stages, and we will continue to monitor and refine the system as it develops. If you are also working on the Polymarket weather market, feel free to discuss in the comments section: What methods do you use to determine entry points? What unexpected settlement results have you encountered?