This article covers all the top data tools and how to use them from a data analyst perspective.
Written by: Andrew Hong , Dune Analytics Headmaster
Compilation: The Way of DeFi

Image Credit: Generated by Maze AI
Another year has passed, but it feels like ten years! Before reading this article, I recommend checking out my 2022 guide , as most concepts are still relevant for context. This year’s Tool Guide also covers the same three pillars, but with a new perspective compared to previous years:
- Tools : Organize Data Tools by Utility
- Thoughts : About Composability and Noise in Encrypted Data
- Teams Analyst : Building the image of the web3 wizard
As this field gets more complicated, I've divided the guide into three parts. This section only covers web3 data tools, especially in the context of data analysis.
About data tools:
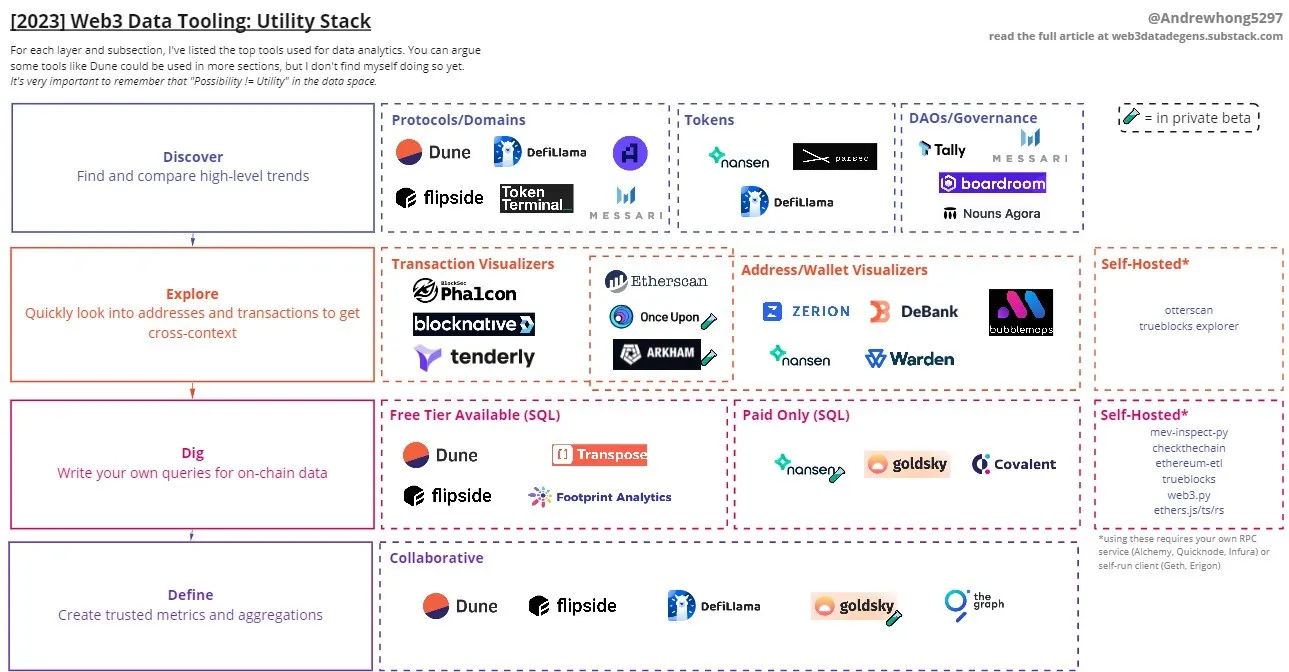
Every tool -- whether they started out as indexers, browsers, scorers, query engines, etc. -- now includes raw and aggregated queries with some API support. So instead of thinking of data tools as a technology stack, I think of it as a utility stack.
This means that all tools have some "use case" in the analysis process for which they fit, thus forming a stack. I've listed the top tools I know of in the image below! Then I will briefly explain each tool on a utility layer basis.
Some disclaimers:
- I am currently working full time at Dune .
- 🧪 indicates that this part of the product is still in the internal testing stage. Therefore, you need to request access from Teams.
- I chose not to include pure API products in this part of the analysis because every tool now has an API with a mix of raw/decoded/aggregated data. I cannot reasonably cover all products here. If you want to see where some of the enhanced APIs are headed, check out this article .
- In fact, query dashboard providers such as Dune can support all parts of this functionality. However, query-based dashboards are not yet comparable to the UX (function loops and low latency) of specific parts of dedicated applications, so they are not included in this article.
Discovery: Find and compare high-level trends
All journeys begin somewhere. I use several of the tools in this section to research a topic and discover trends that I want to explore further. Finding the right questions to analyze is one of the hardest parts of web3, and using these tools can make it a lot easier.
💡 OurNetwork and Dune Digest are two of the best news aggregators for on-chain analytics Alpha . Many of my journeys of discovery about the various tools in this section begin with their articles.
protocol/domain
To understand how a protocol (or domain) is performing against various metrics, you can refer to one of these tools.
- Dune can be used to find granular dashboards for erc20s , NFTs , staking , AirDrop , auctions , and more. It has a native search feature that ranks dashboards, wizards, and queries.
- Flipside can be used to discover data science articles and research such as Liquidity Pools PnL , Wallet Rank, and more. They are currently beta testing newer dashboard features.
- DefiLlama has advanced trends in TVL, volume and yield. You can find some top examples in their 2022 review .
- The Messari protocol/pool board is a great alternative to DefiLlama and is growing fast.
- Token Terminal makes the traditional analysis of protocol (dapps) or chain's revenue, earnings and fees easy.
- Artemis has the best charts for chain development/social activity and includes overview chain metrics. And they integrate nicely with google sheets.
Token
While you can use more customized query dashboards (such as those linked before) to drill down into coins, you may need a more optimized product interface to make the discovery and comparison process faster and easier.
- Nansen's Token God model and token (defi/NFT) paradise provide insight into distribution, transaction and wallet trends.
- DefiLlama allows you to closely analyze the trading volume and Liquidity depth of token pairs .
- Parsec conducts Bloomberg-style analysis of tokens through a customizable terminal .
DAO/Governance
Governance is increasingly important to track trends as protocol changes/updates become more frequent and treasuries need to invest or spend funds.
- Messari: Provides insights into proposals by flagging discussions, importance, governance processes, and sub-DAOS in their governance browser .
- Tally : Voting Rights is a good starting overview of DAOs over time, and they have a filter by chain feature for finding DAOs.
- Boardroom : Has a nice filterable feed of all DAO proposals , although I wish there were more parameters to filter on (ie proposals worth over $20,000).
- Agora : Currently it only works for Nouns, but is very useful for understanding voter profiles and representation goals .
Explore: Quickly view addresses and transactions for detailed context
Once you spot some interesting trends, you might want to figure out what common transactions look like and what wallets/addresses are behind all the transactions.
This is the step where you widen the scope to make sure you don't miss any contextual clues that would help your analysis. And in this one step, you might have 20 different tabs open.
💚 I built a dashboard that makes it easy to drill down to any contract address and understand how the protocol works.
Transaction Visualizer
Transactions can be anything from simple ETH transfers to slightly more complex leveraged curve stETH/ ETH vaults. During this process, we usually need to skip transactions, traces, logs, contract code, state data.
- Blocksec/Phalcon is great for studying traces and logs in transactions. They clearly illustrate the order in which all internal calls and events are emitted . Its latest update adds code snippets and balance flowcharts to the tool.
- Tenderly Multichain explorer includes the fastest track<> code snippet detection, among other features. It has the smoothest UX/UI of any tool, but it could do better with event log traces and code snippets.
- Blocknative is a professional browser for mempool (transaction queue). Here you can listen to transactions submitted to any contract in real time.
Address/Wallet Visualizer
For these tools, easy and fast searching, cross-analysis, combining and sharing of wallet balances and activity is key. While there are more "portfolio" style applications such as zapper.fi and rotki , none of these are conducive to data analysis work and are therefore not directly covered in this section.
- Nansen beefed up the tabs and launched a wallet analyzer that perfectly matches their coin analysis page.
- Zerion and Debank are the best free alternatives to Nansen when it comes to analyzing wallets on multiple chains.
- Warden allows for DeFi-specific analytics (liquidations, lending, etc.) of wallets in an easily searchable format. They support AAVE and will soon support Euler, Notional and Compound. I guess this tool will need its own section next year as it will spark a wave of heavy DeFi analytics explorers.
- Once you have some coins memorized, Bubblemaps will help you identify interesting wallet clusters and connections.
Mixed (transaction + address/wallet)
These are all-in-one solutions for exploration. It's going to be an even more crowded field that will spawn some of the strongest general-purpose products in the space -- and it's likely that the next Google will start here.
- Etherscan is great for quickly getting an overview of a single address. I usually use it for tabs and to quickly check balances and historical transfers for a specific coin (for a given wallet). They also have the most basic yet easy to understand transaction overview .
- 🧪 Onceupon.gg is an analyst's dream . They support infinite horizontally scrolling mini-windows and quickly filter all transactions by method and origin (including tracking) in the context of specific tokens and entities. Every transaction is labeled and described in a human-readable way before you click into it. Wallet and window groupings can be easily shared and digested. On top of that all addresses have a "Neighbours" tab for quickly identifying top counterparties and complementing your analysis with a graphical network visualization.
- 🧪 Arkham is the most dedicated network and counterparty analysis tool . You can easily view counterparties/exchanges and balances between individuals/groups, and easily break down transfer inflows/outflows by transaction. Their graphical network tools make zachxbt-style reconnaissance easier than ever - you can easily adjust the timescale to see the relationships of specific wallets over a specific period of time.
self hosting
These options allow you to run an open source block explorer locally, also a hybrid solution.
- Otterscan: The basic functions are equivalent (roughly) to etherscan .
- Trueblocks Explorer : The fastest account history grabber (probably). The core projects are in the next section.
Mining: write your own queries for on-chain data
All SQL engines are cloud-based, so you can use an in-browser IDE to query raw and aggregated data (eg nft.trades/dex.trades). These also allow for well-defined forms such as NFT wash trading filters .
The best protocol, community and token analysis starts here! Some engines have more specialized tables, I'll list them.
Free tier available (SQL)
Access to these engines is free.
- Transpose (25 seconds free limit, up to 10 minutes longer on top plans).
- Flipside (15 minute free limit, no plan). Currently the only one with a storage/state table, provided by TokenFlow .
- Footprint (20 minutes free limit, paid plans with scalable computing). The only gamefi-centric aggregation I've seen.
- Dune (30 minutes free limit, paid plans with scalable computing). The only tool that has decode tables so you don't have to deal with raw hex/bytea conversions, function/subject signature filtering or proxy/factory patterns.
Paid Only (SQL)
Access to these engines is only available if you are on a paid plan and approved for access.
- 🧪 Nansen is currently testing their new query engine. You can finally query their entity/address tag tables!
- Goldsky allows migrating subgraphs from theGraph (or creating new subgraphs) to their hosting service. You can easily compose subgraphs, solving one of the Graph's major shortcomings (despite losing decentralization).
- Covalent Increment has a huge table from which all raw data is queried and has recently started adding aggregated data.
self hosting
These are packages of code that allow you to quickly fetch raw data, decode data, and aggregate data (using some RPC provider for a given chain ). The upside is that if you run more efficient clients ( Erigon in particular), you can explore more data faster.
Note that Erigon takes a week to sync and you need to have >2TB of space on your drive; it may be faster in the future .
Python:
- web3.py: One of the first packages to easily use contract ABI and node providers (clients) on Ethereum .
- ethereum-etl : used by Nansen and google Bigquery to get the chain for a specific block range. Can easily export to different databases or file types.
- checkthechain : The only package with domain aggregation (like uniswap pools) on top of the basic functionality of web3.py. Customized for data scientists.
- Ape used to be this way before it became the more secure vyper solution.
- mev-inspect-py: Query MEV data by block (i.e. miner payments/profits, swaps, arbitrage, etc.). This flashbots data can also be found in Dune .
Golang:
- trueblocks-core: This tool fetches the transaction history of any address very quickly. Visualized in the explorer above .
Javascript/Typescript:
- web3.js : The original web3 script package. Many of the methods/patterns here are now considered too verbose compared to ether.
- ethers.js/ts: A more efficient/lean web3 script package, widely used in front-end and smart contract test suites, such as truffle and hardhat.
Rust
- ethers-rs: I believe primarily created to work with foundry (like ethers.js <> hardhat).
Definition: Create trusted metrics and aggregations
Raw data is fine, but to get better metrics you need to be able to normalize and aggregate data across contracts of different protocols. Once you have aggregations, you can create new metrics and tags to enhance the analysis for each individual.
This tier of the community has the deepest combination of web3 domain, technology, and background knowledge.
cooperation
All defined views are open source and you can contribute your own code/collaborate with other analysts.
- Dune allows to create any model you need, where all chains are in one repo (repository) . There are already 300 contributors (combination of community + team members).
- Flipside allows creating any model you need, where each chain has its own repo .
- DefiLlama allows any contribution to a set of predefined indicators and is usually built based on subgraphs .
- theGraph allows anyone to create graphQL schemas and mappings , restricted to a specific network, typically only one protocol (ie defined contract) at a time. Messari builds on top of them in a more organized way (i.e. like the Dune/Flipside/DefiLlama repo).
- 🧪 Goldsky is basically theGraph, but only for private/paying customers , and written in SQL.
There are some query providers from the previous section that define their own aggregations, but they are not open source and you cannot add to them yourself.
look forward to the future
All in all, Web3 data tools are becoming cleaner, more trustworthy, more social and collaborative. The infrastructure is evolving so that we can all query and define better metrics faster, improving what we can discover and explore in our products. The entire ecosystem is like a "big flywheel", and this small community is eventually built together to make the data flow. It should be emphasized that web3 data is all social in nature!
This is just the first part of my 2023 guide, other parts will be more analyst specific and more technical.