The April meme coin price surge continues to explode as Pudgy Penguins (PENGU), MemeCore (M), and SPX6900 (SPX) all recorded gains of 19% to 32% this week, with each Token currently testing key Fibonacci levels.
These three Token are leading the meme coin rankings this week, but their technical charts show different trends. One Token is in an overbought RSI, Token has just broken through a new resistance zone, and the third is attempting a breakout but the volume is unclear.
Memecore (M) stalled near $4.86 after touching a Fibonacci extension level.
MemeCore (M) is currently trading around $4.19 after a 23% increase this week, within the high Fibonacci range of 0.786 to 1.0. The Token just hit a new high of $4.86 on April 24, 2024.
The Fibonacci structure was drawn from the November Dip and retested that Dip on February 1, 2024. After correcting to the 0.618 (golden pocket) area around $3.46, buying pressure returned to the market.
This recovery coincides with a retest of the upward exponential curve and the green box support zone near $3.00.
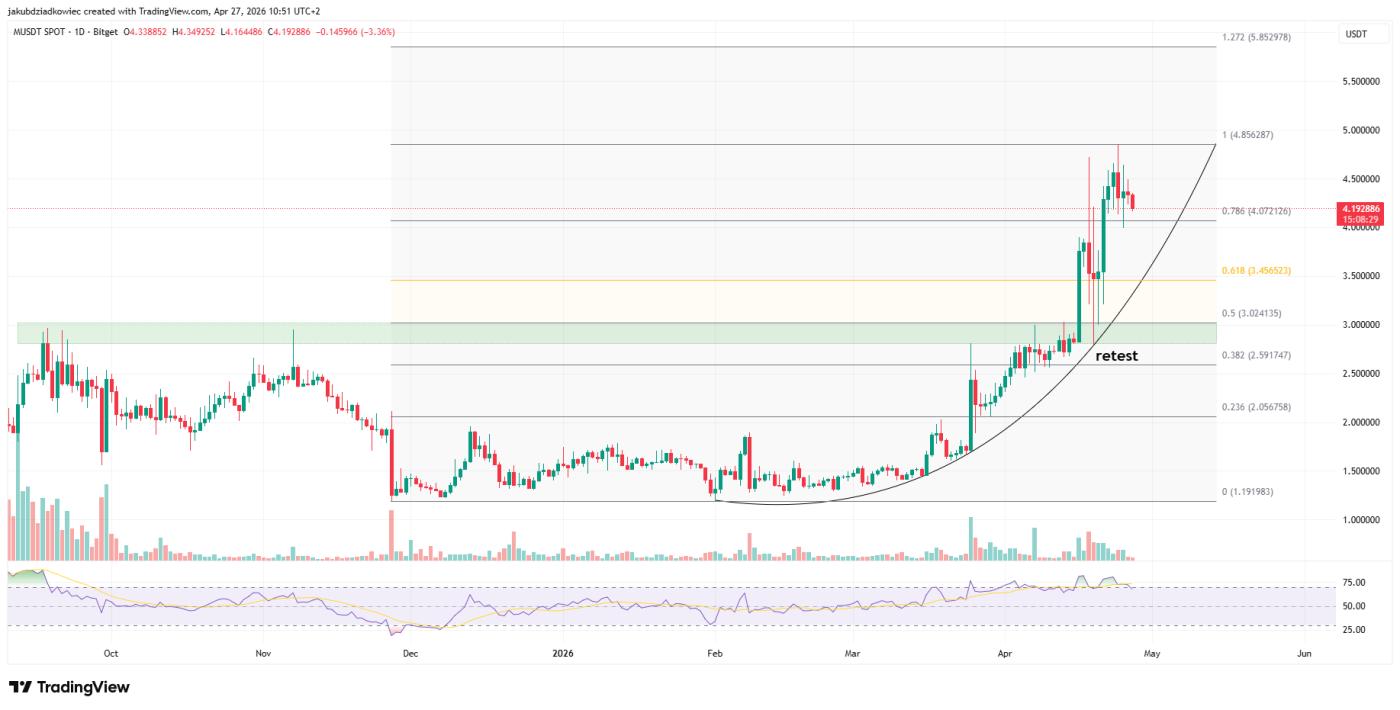 Daily chart M / Source: Tradingview
Momentum indicators are warning investors to exercise caution. The Relative Strength Index (RSI) is nearing the overbought zone and shows a bearish divergence from the most recent price peak. Additionally, volume is trending downward, reducing the likelihood of an immediate price increase.
If MemeCore (M) clearly breaks above $4.86, it will aim for the next target, the 1.272 Fibonacci extension at $5.85. Conversely, if it fails to break this high, M will continue to move in the high price range and may have to retest the deeper $3.46 golden pocket.
Pudgy penguins (PENGU) fuel meme coin wave with strong breakout.
PENGU is currently trading at around $0.0096 after surging 32% over the past week. The Token has clearly broken through the $0.008 resistance level – which had been holding back the price since early February 2024 – and has now turned it into a support zone.
This breakout helped PENGU escape its months-long consolidation range of $0.006 to $0.008. Volume increased sharply during the price climb, further reinforcing the credibility of this breakout. The RSI is approaching the overbought zone but still has room to rise before showing signs of weakness.
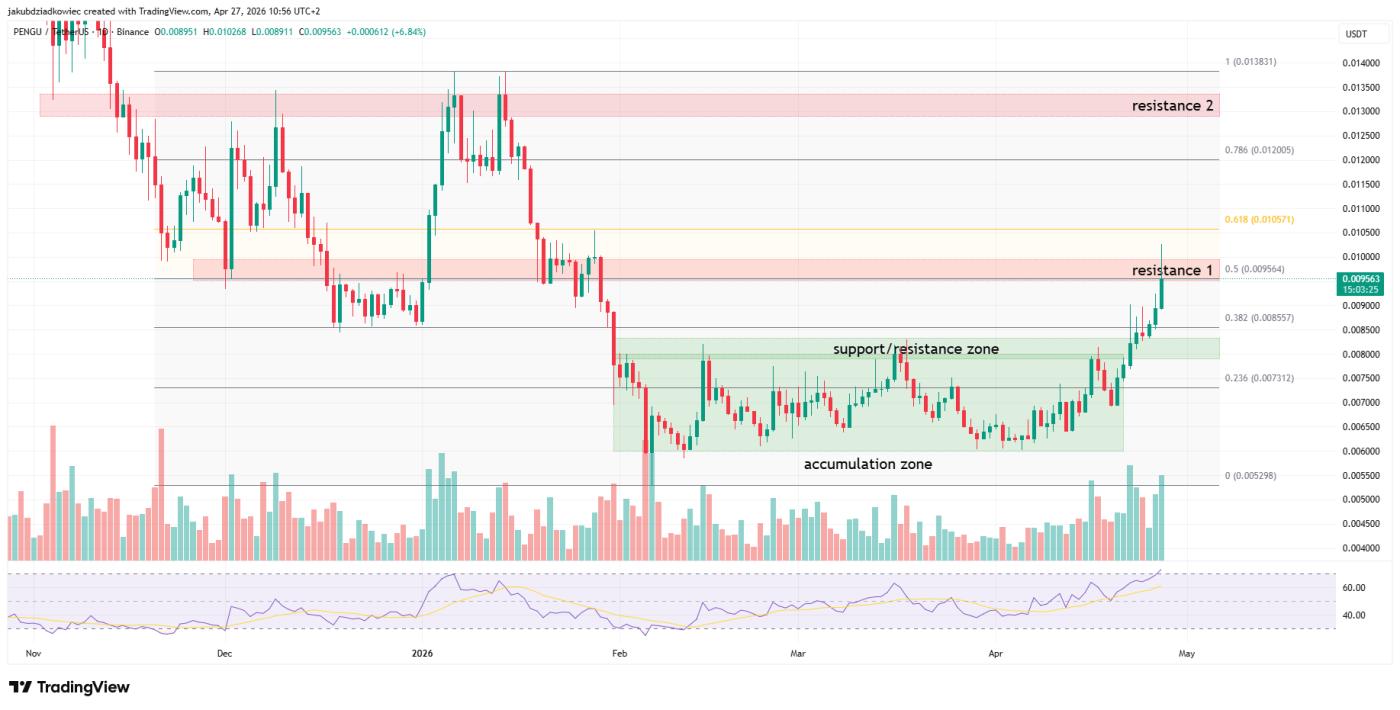 PENGU daily chart / Source: Tradingview
Currently, the price is testing the 0.5 Fibonacci level at $0.0096, which is a short-term resistance level on the chart. The long upper wick indicates that sellers are still aggressively defending this area. If it holds above $0.008, the bullish structure remains valid.
If the day closes above $0.0096, PENGU could head towards the golden pocket of $0.618 around $0.0106. Further down, the $0.013 area is XEM a strong resistance level and coincides with the Fibonacci 1.0 level. A loss below $0.008 would invalidate the breakout signal.
The SPX6900 (SPX) has broken out, but lacks confirmation from volume.
SPX6900 (SPX) is currently stable at $0.3839 after a 19% increase this week, repeating a pattern seen earlier this year. The price has just broken out of the consolidation zone of $0.27 to $0.35 – the price range that held SPX captive throughout February, March, and the first half of April 2024.
Looking ahead, the SPX is facing resistance at the 0.382 Fibonacci level around $0.426, a zone where many sellers have prevented price increases in the past. The RSI is currently hovering around 60, with a slightly upward slant, suggesting that the uptrend remains strong rather than overheating.
Bollinger Bands have widened, with price moving along the upper band, confirming increased volatility and a short-term bullish trend. However, the signal from volume is contradictory; this breakout is not supported by large trading volumes, so its reliability remains low.
If supported by high volume and closing above $0.426, the SPX will target the next Fibonacci 0.5 level around $0.489, then continue to the golden pocket of 0.618 at $0.55.
Conversely, if there is a lack of buying pressure, SPX could return to the upper region of the accumulation channel near $0.35, and the $0.22 level would Vai as a strong support level at the Dip of the structure. The shift of funds from other Meme token could also drive further volume increases for SPX.