1 Introduction
This article provides an overview of the current state of cryptocurrency exchanges, from centralized exchanges to decentralized ones. It compares trading volume between the largest exchanges, and the massive value capture that one exchange can bring. We then focus on dYdX, a particular decentralized futures (“perpetual” and “futures” will be used interchangeably in this article) exchange, and speculate on how it could increase trading volume and revenue generation in this lucrative cryptocurrency space.
There are five main unrelated drivers of this thesis:
1. The number of cryptocurrencies will increase.
2. Compared with the centralized transaction volume, the decentralized transaction volume will increase.
3. Relative to the decentralized spot volume, the decentralized perp volume will increase.
4. Exchanges are natural monopolies, and dYdX is the current king of decentralized Derivatives.
5. The upcoming upgrade of dYdX will enable it to maintain and increase its dominance in this space by running a full stack of borrow/loan, spot and options, while returning value to dYdX token holders.
In the first chapter (Cryptocurrency Exchanges), a brief introduction to the industry will be given and the paper points (1), (2), (3) and (4) will be touched. The next chapter (dYdX) will give a nod to the current state of dYdX and focus on the last point (5).
2 Cryptocurrency exchanges
Exchanges are one of the best product markets for cryptocurrencies (strongly considered the best). Coingecko's top 100 list mainly consists of three categories L1 (25), Stablecoin(10) and exchanges (16) ( categories taken from coingecko). There is overlap here, as BNB is both L1 and an exchange). Of the three subcategories, exchanges make the most money, especially in terms of returning value to token holders (no incentives. You can't actually buy a Stablecoin to add value).
Here, we will further differentiate exchanges and group them into 4 subcategories: centralized spot exchanges, centralized futures exchanges, decentralized spot exchanges, and decentralized futures exchanges. Many centralized exchanges have both perpetual and spot trading operations, but this is not common among decentralized exchanges, which tend to only focus on one or the other.
Centralized exchange
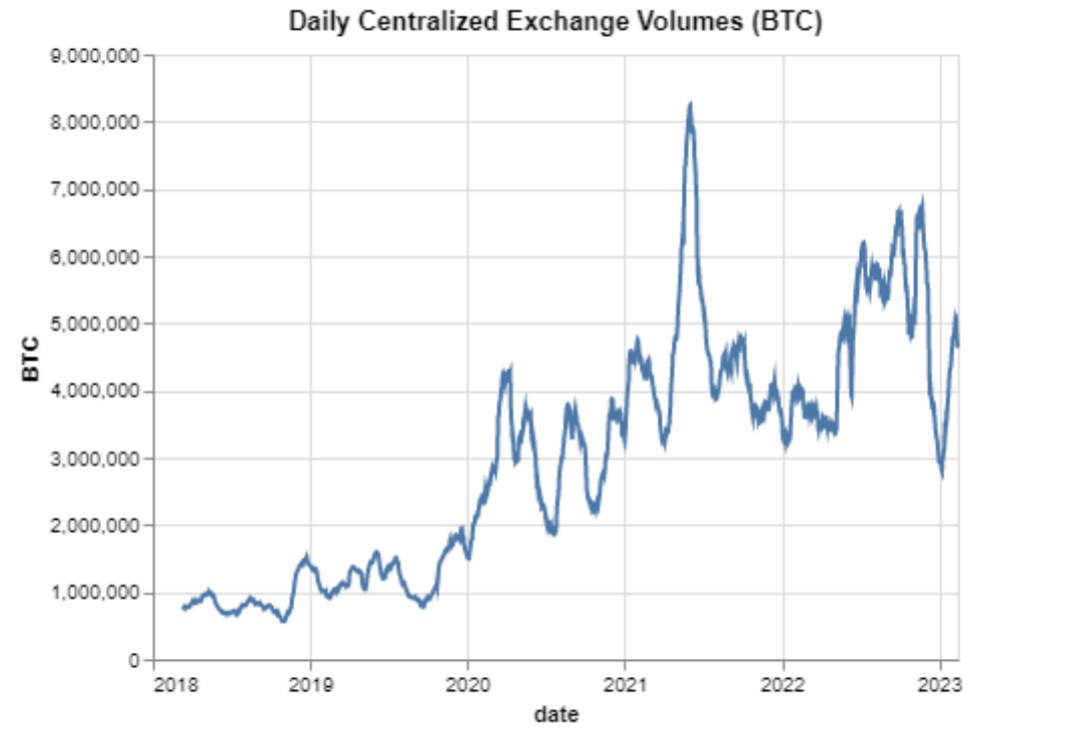
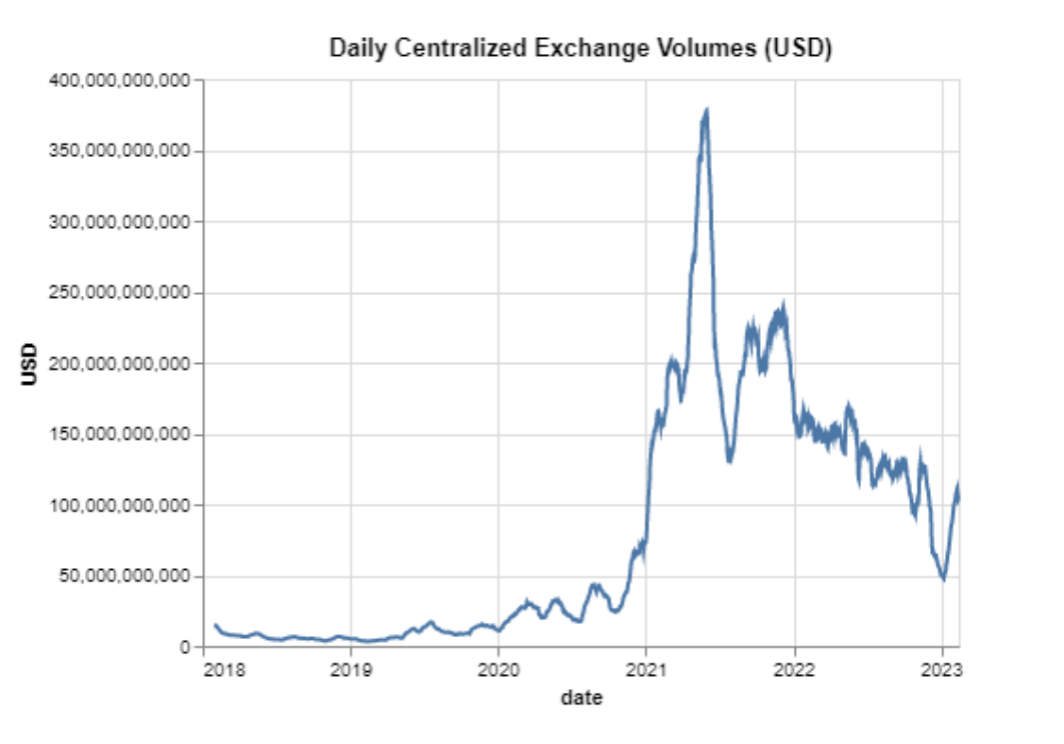
At present, the daily trading volume of centralized exchanges is about 100 billion (the data comes from the top 10 exchanges in terms of trading volume), which is lower than the peak of 300 billion in 2021 and about 150 billion in 2022. This decline is mainly due to the sharp decline in the price of the asset during the recent market regime. If we calculate the transaction volume in BTC , the transaction volume in the past year and a half has remained basically stable, a sharp increase compared to the 2018-2020 era. Volume will continue to increase as the market matures, but the climb will not be linear. Instead, we can envision a sharding function where each new cycle increases the average daily transaction volume several times over the previous regime.
decentralized exchange
Uniswap ushers in a new era of decentralized exchanges with a simple and intuitive Liquidity formula, clean user interface, and ETH base pairs. At the same time, Curve is also thriving as a stable exchange with its centralized Liquidity formula. These two decentralized exchanges kicked off the summer of defi and created viable alternatives to centralized exchanges.
Demand for decentralized exchanges has never been greater since the FTX debacle, since they don’t hold user funds, their smart contracts have proof-of-reserve. Additionally, there is no KYC and no geo-blocking, making them easily accessible to all.
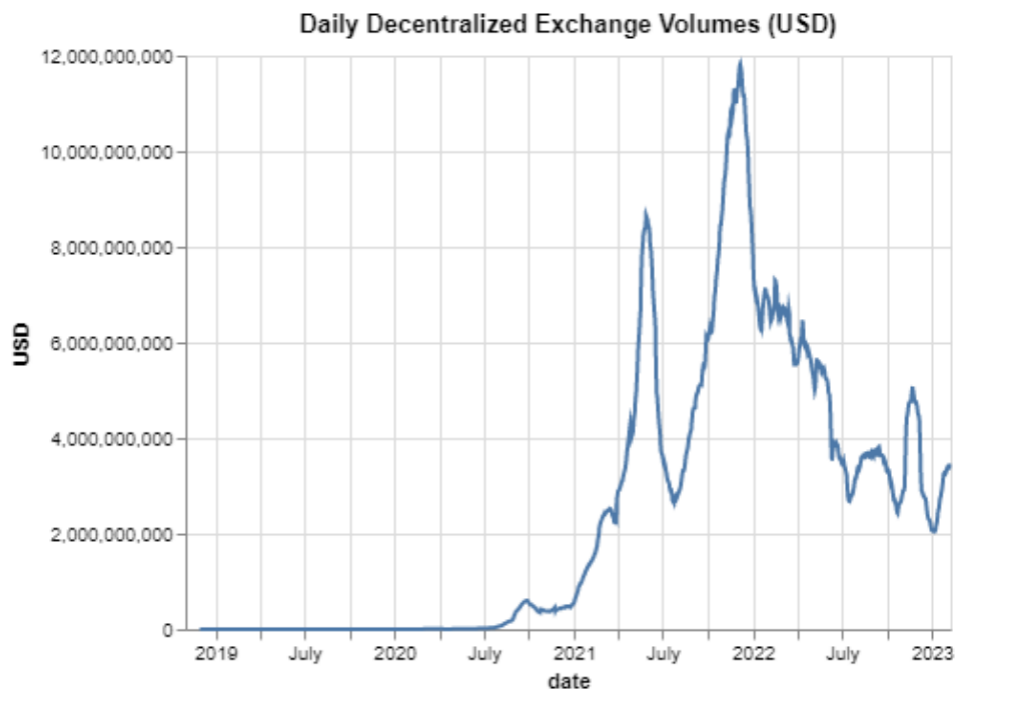
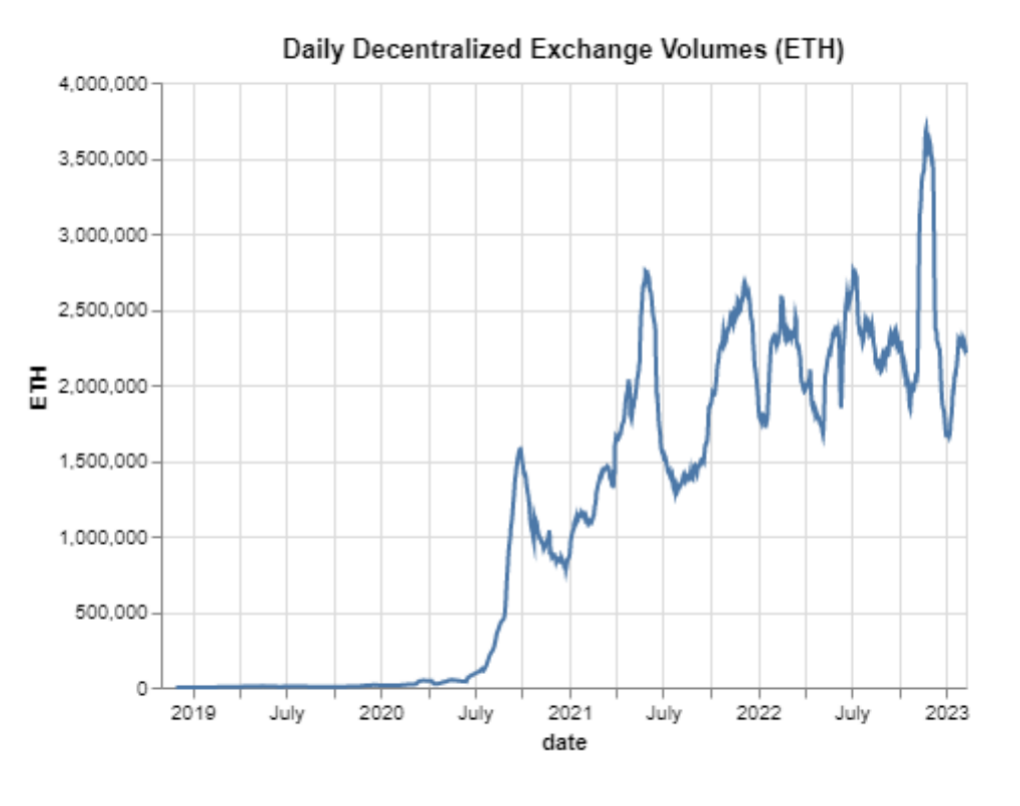
Looking at trading volumes, we can see that trading volumes on decentralized exchanges have also been trending upwards, especially when looking at most assets based on ETH . For the past half year, we've been hovering just below 4 billion daily transactions. Like their centralized counterparts, transaction volume growth has been flaky and exponential, and will continue to expand for years to come.
Decentralized Exchange vs Centralized Exchange
An interesting observation from the chart above is that due to myriad issues of MEV, higher fees, gas costs, and poor UI, decentralized transaction volumes are nowhere near comparable to centralized transaction volumes. That said, these issues are being addressed, with each generation of decentralized exchanges getting closer to competing with their centralized counterparts.
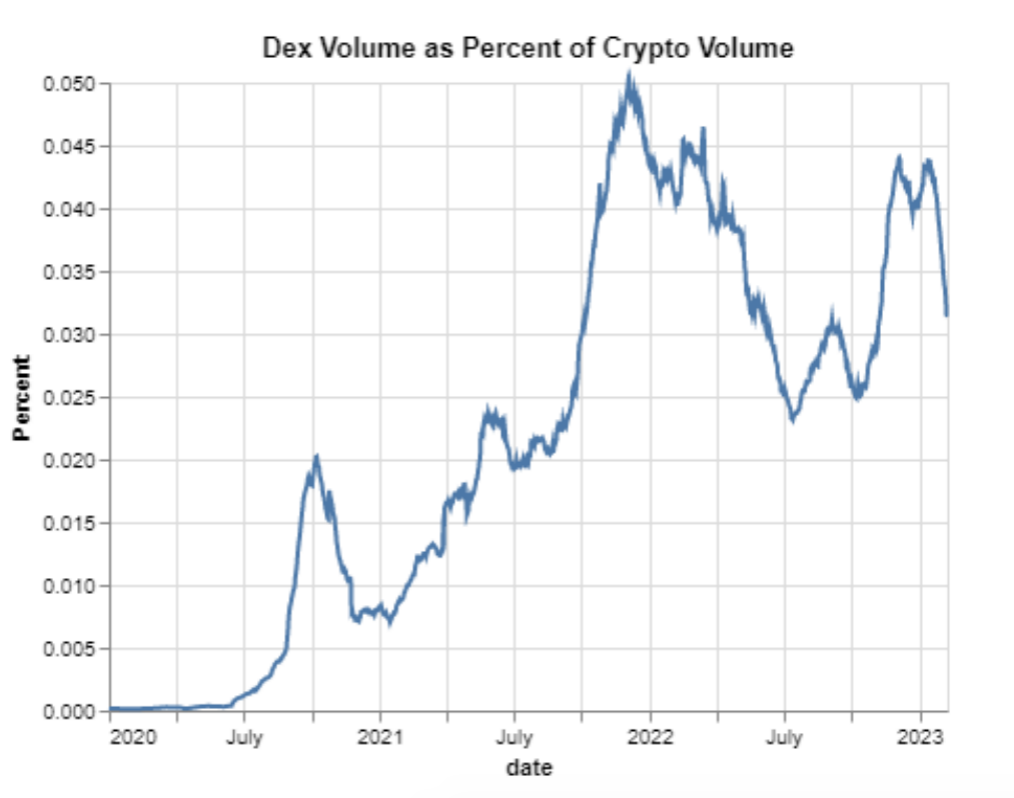
Below we can see a chart from the summer of Defi to the present, comparing the trading volume of decentralized exchanges (decentralized spot and perp) with the entire cryptocurrency trading volume (including centralized spot and perp). Defi currently accounts for about 3-3.5% of the entire cryptocurrency trading volume, but the graph is upward sloping. This is a theme that will continue to trend over the next few years, with the potential to reach north of double digits once the aforementioned issues are resolved.
Spot Decentralized Exchange and Futures Decentralized Exchange
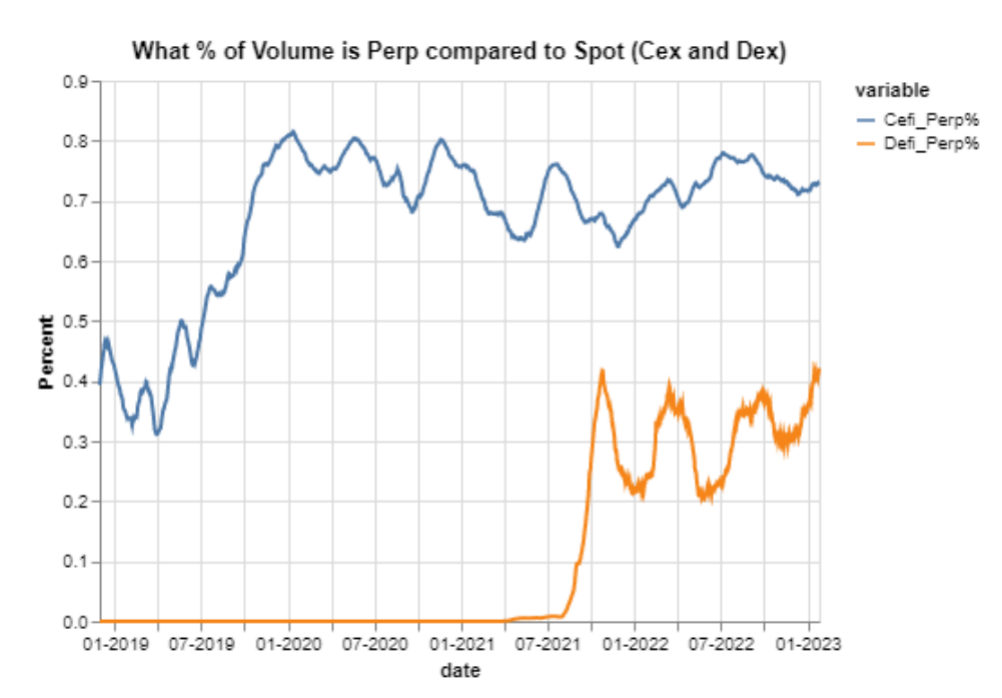
Previous analyzes lumped centralized and decentralized exchanges together, but now we split them into futures and spot. Perhaps one of the most interesting aspects of decentralized exchanges is how much volume is traded on spot exchanges versus futures exchanges. From the beginning, spot trading volume has been greater than futures trading volume on decentralized exchanges, which is in sharp contrast to the exponential growth of futures trading volume on centralized exchanges. This doesn't really make sense, since futures have lower transaction fees, less slippage, and higher efficiency, so the difference is peculiar.
Below we have a chart that plots the percentage of trading volume perpetual on centralized exchanges vs. decentralized exchanges. We can see that after the initial surge in 2019, when FTX popularized cross margin and USD margin contracts, centralized venues have consistently hovered around 70-80%.
Granted, the Uniswap model makes providing Liquidity on long-tail assets trivial (especially with Liquidity incentives) and creates a different market microstructure. However, centralized exchanges actually have a higher percentage of altcoins traded. Looking at several snapshots of Binance data, around 70% of volume is short-tailed. ETH to Stablecoin, BTC to Stablecoin, ETH to BTC, or Stablecoin to Stablecoin. The same standard of Uniswap is more than 80%.
A simpler explanation is that decentralized perpetual markets are not yet mature enough. For the beginning of cryptocurrencies, there have always been spot exchanges, but futures only started to take off when Bitmex launched their perpetual exchange. Even so, in 2019, three years later, FTX changed everything from coin profits to dollar profits, and futures really took off compared to spot. Admittedly, decentralized perp exchanges are still much less Liquidity, coin-wise than their centralized counterparts, and charge higher fees. A few more iterations will fix these issues and we will see decentralized perpetual exchanges replace decentralized spot and gradually approach 70-80% of total transaction volume.
Exchange Microstructure
Centralized spot, centralized futures, and decentralized spot exchanges are all more mature than decentralized futures exchanges, and they present a monopolistic market microstructure. This makes a lot of sense intuitively, because Liquidity begets more Liquidity. All traders want to trade on the exchange with the most Liquidity, so all else being equal, the exchange with the least slippage is a more attractive starting point.
When economies of scale bring huge benefits, monopolies tend to form, which is exactly the case with exchanges. Binance is the leading exchange for centralized spot and futures trading, they were able to overcome fixed costs and reduce fees to maintain/increase market share. Last year, Binance enabled no fees for some BTC and ETH pairs. Also, they have the largest insurance fund (nearly 1B), protecting consumers in case of a black swan.
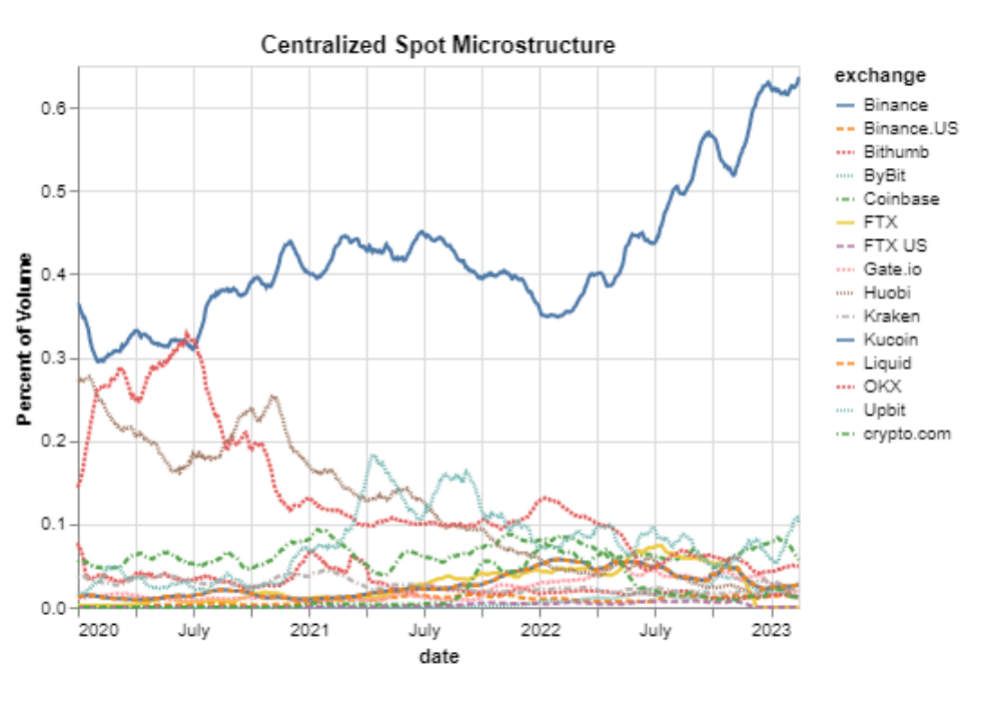
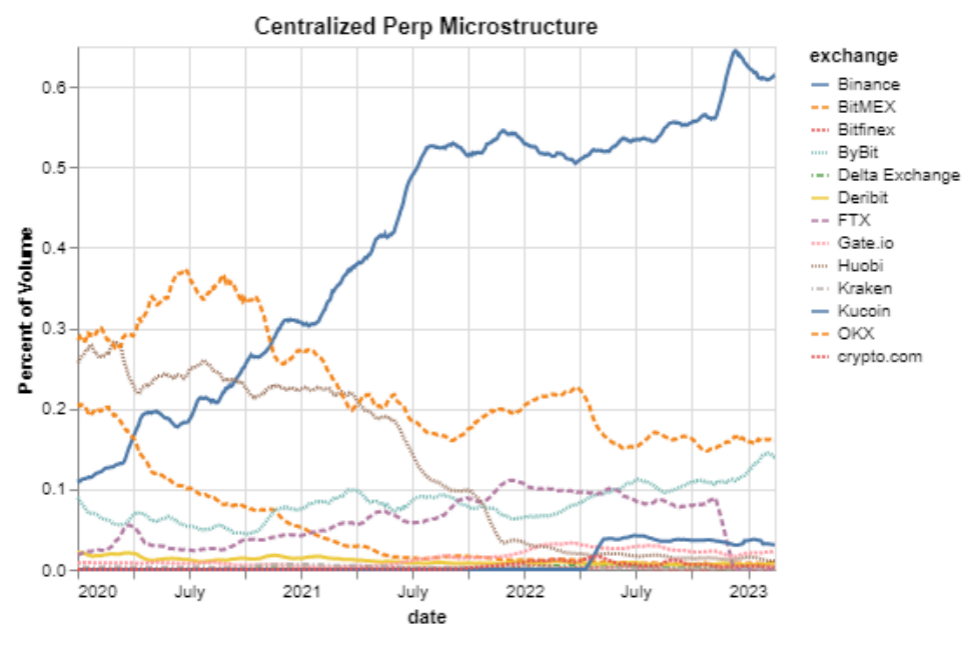
Below we can see a time-series graph of the trading volume for each exchange. Binance has a growing advantage, with its market share in the centralized spot market rising from around 40% in early 2020 to over 60% now. Its market share in the centralized perpetual market has risen from barely 10% in early 2020 to over 60% now. Due to the natural monopoly advantage of this market, this lead should not fade, and Binance will grow beyond this 60% market share.
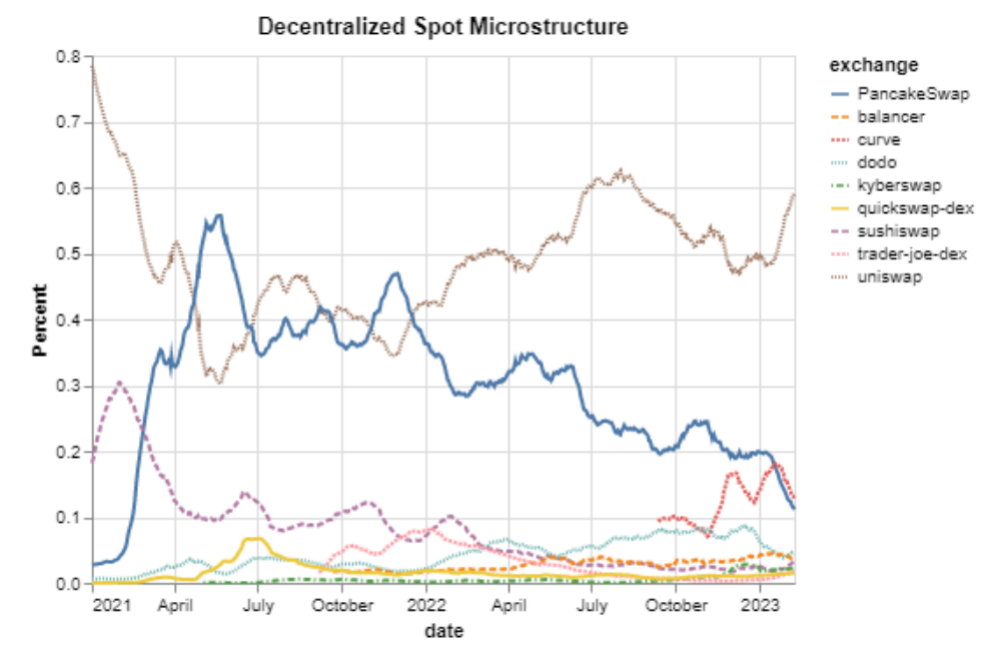
Decentralized spot markets have a similar profile (data only from 2021, since only uniswap actually has trading volume). This is more decentralized as each chain has its own decentralized exchange and Yield Farming incentives to help other exchanges, but overall, Uniswap has dominated; in fact, there are even plans to go BSC, this will put a lot of pressure on Pancake swap.
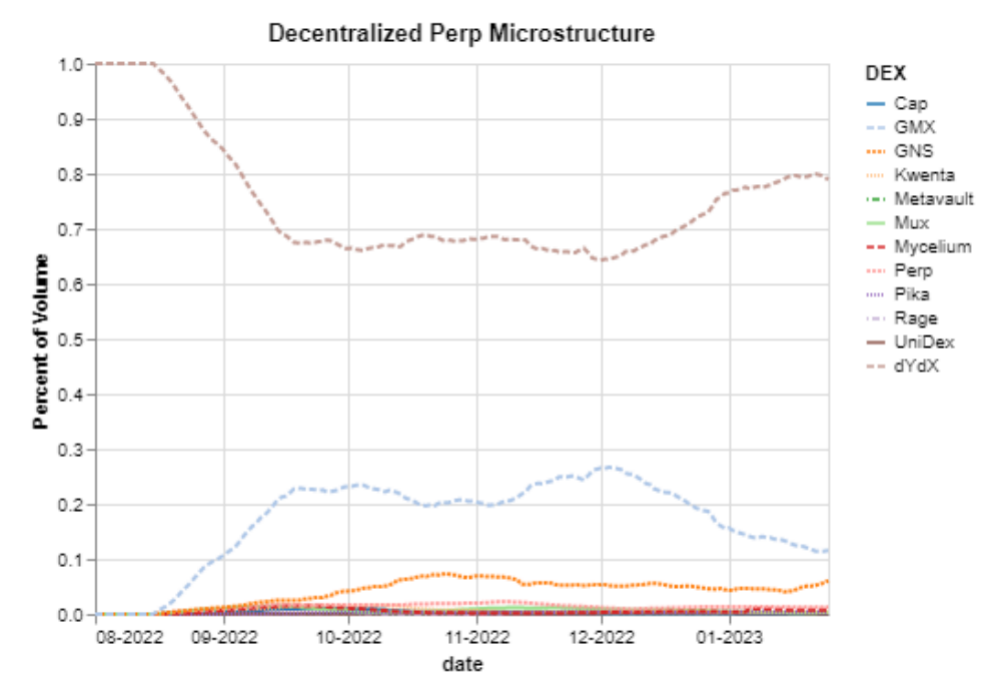
So, what does the microstructure of existing decentralized futures look like? These exchanges are newer and have less data, but we have a full snapshot from mid-2022. Over the past few months, we can see that dYdX maintains a healthy and strong lead over its second and third closest competitors, GMX and GNS.
3 dYdX vs Competitors
dYdX V3 is currently the most advanced decentralized perpetual trading platform. It combines the best trading features and feel of a centralized exchange with the security and Non-custodial nature of a decentralized exchange, so users get the best of both worlds.
V3 has more than 30 different markets, supports cross margin, a powerful liquidation engine, and a very detailed and complete api file. Not to mention that fees with similar slippage are by far the lowest of any decentralized virtual exchange. For reference, the next two exchanges, GMX and GNS, have fees of 0.1% and 0.08% respectively. On dYdX, traders with a monthly trading volume of less than 100,000 can trade for free, the highest fee tier is 0.05%, but the lowest is 0.02%, while market maker fees drop to 0% based on trading volume.
competitor's problem
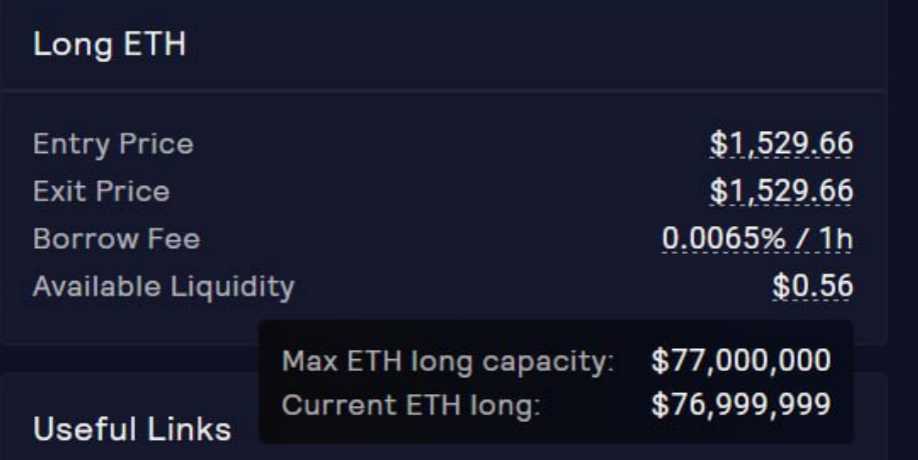
It is difficult to compare the Order-book model to oracle-based models like GMX and GNS, but one of the biggest problems with oracle exchanges is that capacity is blocked by other participants. Below is a screenshot of the ETH market from a few weeks ago, with traders unable to go long. During a strong rally, speculators look to express their bullish bias, and this model is literally PVP on who executes first.
competitor advantage
That's not to say that the dYdX V3 is superior in every way. Sometimes the best marketing for a platform is the rise in the number of tokens, which is clearly the case with GMX(up 100% in a year) and GNS (over 200% in a year), while dYdX is down 50% in the same time frame. This part Is due to the token economy of vesting, but also related to the usage of ghostwriting.
Both GMX and GNS give back protocol revenue to their subscribers, so tokens are not just governance tokens. GMX and GNS subscribers earn around 10-15% annually. One of the biggest grievances with dYdX is that the token has not been aligned with the usage of the product, while its competitors have done well. There is no built-in feedback loop, more volume helps the token price as fees go to stake holders. This has changed in V4, as token holders can earn a distribution fee (more on that below), which will be higher than its competitors.
Another advantage of GMX and GNS is geo-blocking. Some jurisdictions are currently blocked to access dYdX V3. This is not the case with other protocols. Geo-blocking is a huge pain point because it makes transactions much more difficult. Geo-blocking of the default V4 frontend (hope to see funding for other alternative frontends) is currently being discussed by the legal team.
As mentioned in the previous chapter, the current iteration is the most popular decentralized spin-off platform and outnumbers its competitors. That's not to say the V3 was free of flaws that gave its competitors a small market share. V4 addresses all of these major deficiencies.
4 dYdX V4
In June 2022, dYdX shocked the crypto community by moving to their own native chain, leaving Starkware that housed V3. The easiest thing to do would be to add some small improvements on top of V3, which is already better than other decentralized The perp platform is much higher (just doing a simple quantitative comparison). Instead, dYdX took a big risk and rebuilt most of the system from the ground up to fully decentralize the system while increasing theoretical throughput, adding more certainty to settlements, and minimizing MEV.
advantage
Running L1 enables developers to customize the tasks of validators and various blockchain functions. Specifically, each validator runs its own off-chain Order-book, but orders and cancellations are sent over the network and match guaranteed transactions and commitments to each block (this format is not possible on Starkware) Ensure high throughput.
Additionally, submitting and canceling orders will not require paying gas; other decentralized exchanges, neither spot nor perp, have this feature. Gasless transactions are especially beneficial when the market is volatile and gas prices are skyrocketing, because that's when people want to transact.
Finally, the new blockchain is built on vertical integration, which means adding and enabling spot trading, lending, and options is an easy next step. This will allow dYdX to have all the features of a centralized exchange while adhering to the principles of open decentralization.
challenge
Migration is not without significant challenges. All existing infrastructure from Starkware (which could previously be built upon) would need to be rebuilt from the ground up. In addition to customizing the core node for transaction purposes, an indexer is required to power the API and websockets. Indexers take data on the core blockchain and store it in an efficient manner, which in turn powers the API. Essentially, dYdX needs to build a graph protocol for the universe. In addition to the backend and middleware, the frontend and mobile UI will also be completely revamped.
add new market
Right now, on a decentralized perpetual platform, there aren't many people who can trade except for BTC and ETH(maybe top 10 coins), and Liquidity is low. Binance has over 200 different perpetual markets, while FTX had over 500 before the shutdown. Currently, dYdX offers about 35 markets, while GMX offers less than 10.
In V4, anyone can add a market through a governance proposal. When it passes, it will be put into isolation margin, which can be added to cross margin and completely permissionless trading according to Liquidity(for less Liquidity products, you can start with AMM first, and slowly after reaching certain KPIs upgrade to order mode). In cryptocurrency, attention is huge, and many people want to constantly rotate and trade hot new products. Imagine a world where dYdX is the first perpetual platform to list on the day a token drops, like $BLUR.
When will it be launched?
The launch has been pushed back a few times due to delays. Originally, the V4 was scheduled to launch in late 2022, then it was pushed back to the second quarter of 2023, and now the best guess is September 2023. Milestone 2 was delayed by two quarters from the original estimate . We are now entering the next milestone, introducing advanced transaction functionality and a public testnet, expected to go live in May.
income
V4 will allow governance to charge transaction fees directly, the most likely outcome will be a world where setters and validators charge fees; a big departure from the current system where fees accrue to stake holders. Based on the projected revenue and the percentage wagered, it is easy to come up with a hypothetical rate of return.
Below is a rolling window of daily dYdX fees. We can see that it peaked in November 2021 at over 2.5 million per day, but then fell back and is now slowly rising from a bottom of 200,000 in October to 300,000 in February 2023.
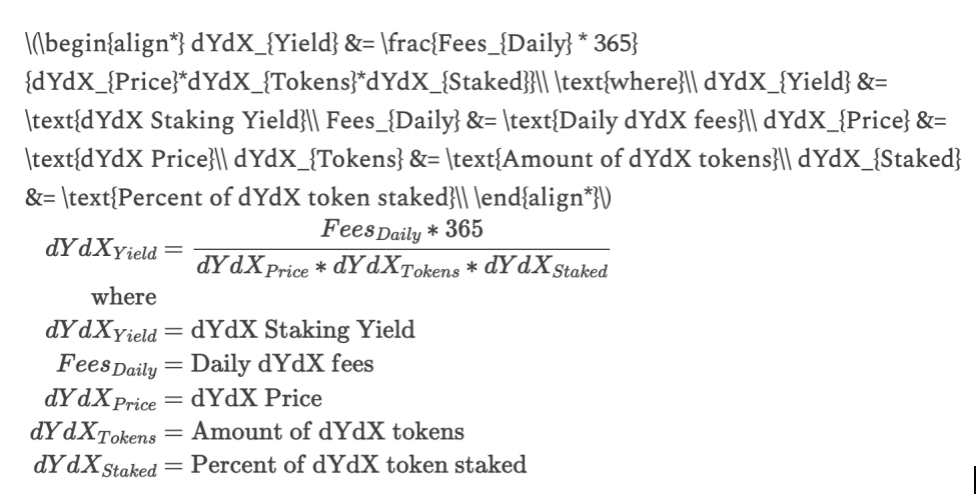
We'll use this formula, annualize the fee and divide by the dollar amount wagered. Looking at the token economy, when staking starts there will be 250 million dYdX tokens. At current prices, a total of $750 million could potentially be staked. However, around 50 million of these tokens are earmarked for Liquidity staking pools, security staking pools, and community treasury. Assuming these people cannot stake, we are left with 200 million tokens. GMX and GNS have about 70% of their Liquidity supply staked, so those numbers will be used as well. The only other variable is dYdX fees.
Below are estimates of staking yields in September when the protocol goes live. At that price and amount staked, the fees that would be returned are ridiculous. There will be some unlocking later this year, and if everything is staked, the stake rate will drop in half, but even then, the yield is insane. The real yield narrative has intensified.
5 Conclusion
In this post, we provide data to support our thesis that there are three secular tailwinds that will drive the decentralized perp ecosystem: cryptocurrency transaction volume will increase, decentralized transaction volume relative to centralized ones Volume will increase, and decentralized perp volume will increase relative to decentralized spot volume (it's more of a sharded step function due to market cycles).
Then we studied the market structure of exchanges from DeFi spot to CeFi spot and perp, and concluded that the market structure of exchanges is more monopolistic. dYdX is the current market leader, and the upcoming V4 features will only serve to solidify their leadership. V4 is a big upgrade over V3 and the current generation of decentralized perpetual agreements.
Exchange coins are one of the best performing sectors in crypto because they are profitable (I can't think of a non-L1/L2 sector without an inflationary reward). V4 will return fees to speculators and align dYdX tokens with protocol usage. We believe dYdX will have a strong performance relative to its industry and the broader market.


