

Introduction:
This month, the crypto market's attention remains focused on fund flows rather than fundamentals. After two months, the US BTC spot ETF saw four consecutive days of net outflows ($836 million net outflows between March 18 and 21), while the positive inflows of the first-tier BlackRock and Fidelity, as well as other funds, offset the outflows of Grayscale Bitcoin Trust GBTC, indicating that we are witnessing some capital transfers. At the same time, we see that the game between profit-taking miners and ETF net inflows is driving the continuation of the volatile market.
1. Macro perspective
1.1 The rise of US stocks did not meet expectations, but the breadth expansion may continue
The rise in U.S. stocks in the first quarter boosted the confidence of stock investors, but market sentiment has not yet reached the "frenzy" level that usually indicates a stock market top.
According to Bank of America's latest report, its "sell-side indicator" rose slightly by 22 basis points to 55% in March, the highest level since May 2022. The "sell-side indicator" is a contrarian sentiment indicator that tracks the average recommended allocation ratio of Wall Street sell-side strategists to balanced fund stocks. When the indicator is the same as or lower than the average recommendation, there is a 94% chance that the stock market returns will be positive in the subsequent 12 months.
Bank of America strategist Subramanian pointed out that the current indicator value means that US stocks will rise by at least 13% in the next year.
"The rise in U.S. stocks may have boosted confidence, and sentiment on U.S. stocks has improved in March, but it is far from euphoric levels." Bank of America expects that as the Federal Reserve cuts interest rates, the return on cash will fall to 3% in two years, and trillions of dollars in cash in retirement accounts will be transferred to stocks.
Strategist Subramanian also said that the breadth expansion in U.S. stocks is likely to continue.
The proportion of stocks that outperformed the market in March rose to 60% from 40% in the previous month, the highest level since December last year. The rise of US stocks is no longer a "lonely show" of technology stocks. The market breadth indicators have improved significantly, and cyclical stocks have risen collectively. The "Big Seven Technology" gradually stopped rising in March, with a weighted increase of only 1.6% by market value, the worst performance since December last year, while energy and finance, which performed well in cyclical industries, rose nearly 12% in the first quarter.
1.2 BTC market volatility is coming, about 2 million BTC are at the brink of loss
Following the first week of net outflows in January, BTC spot ETFs in the United States experienced four consecutive days of net outflows in mid-March, causing the BTC price to fall by -15.4% from the new high of $73,100 reached on March 13 to $61,200 on March 20. After that, as the ETF turned to net inflows, the BTC price recovered to $70,000 and began to fluctuate around this price.
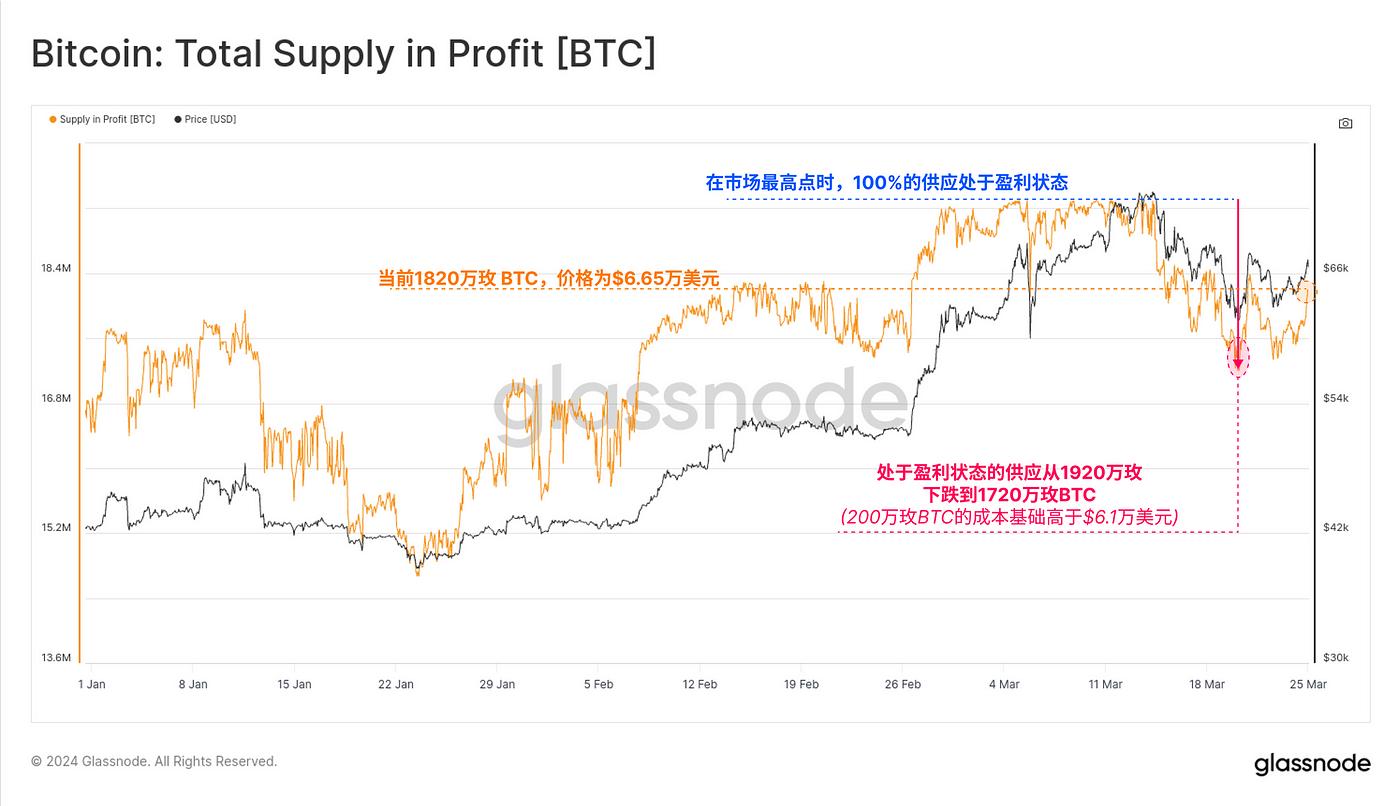
As shown in the chart above, when the market reached its all-time high (ATH) of $73,200, investors sold on-chain, locking in over $2.6 billion in realized profits. Approximately 40% of this profit-taking can be attributed to the long-term holder group, including investors who withdrew funds from the GBTC Trust. The remaining $1.56 billion in realized profits were locked in by short-term holders, with traders taking advantage of inflows of liquidity and market momentum. Realized profits for both groups have reached a similar magnitude as during the peak of the 2021 bull run.
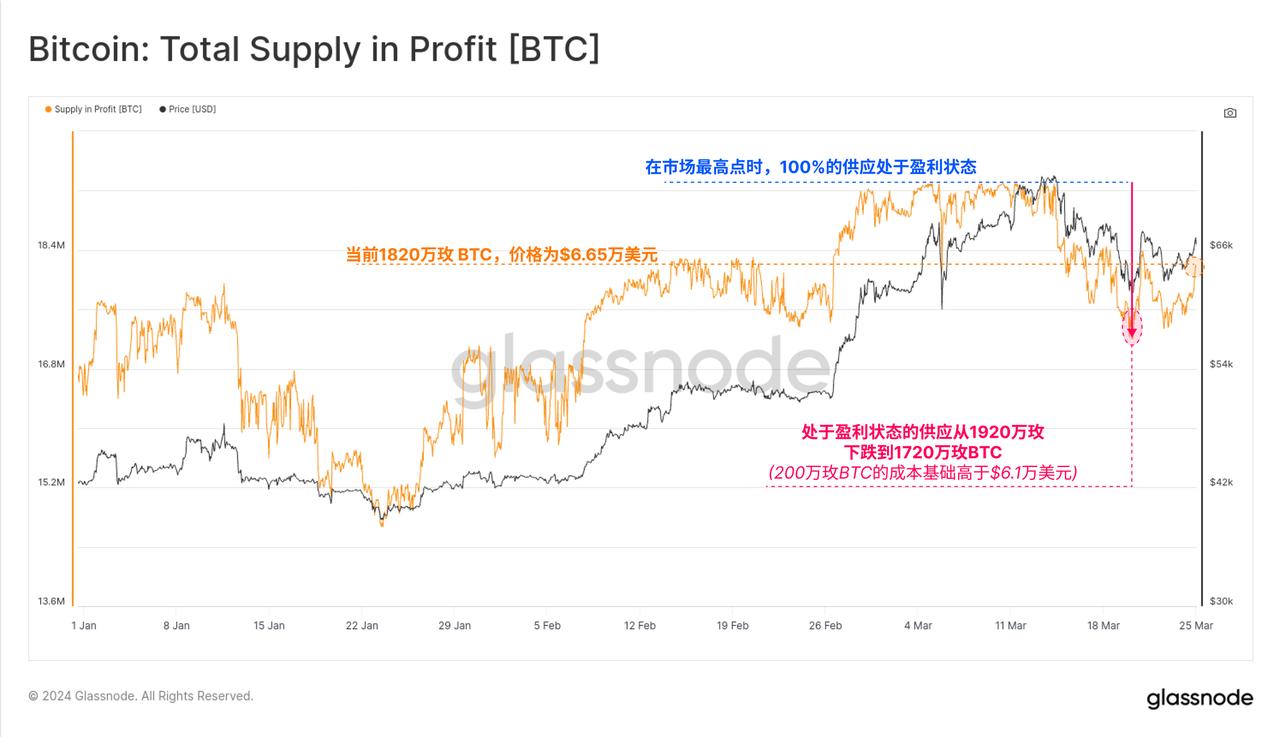
As the price fell from its all-time high to the recent low of $61,200, a total of 2 million Bitcoins changed from a "profitable" state to a "lossy" state. Then the market rebounded to $66,500, and about 1 million Bitcoins returned to a "profitable" state. As shown in the figure above, we can see:
The cost basis for approximately 1 million bitcoins is between $61, 200 and $66, 500;
The cost basis for approximately 1 million Bitcoins ranges from $66, 500 to $73, 200 at all-time highs;
Compared with past data, after the end of the bull market in 2022, the price of BTC did not cover the cost until 2024, and miners began to make profits. From the supply side, the bull market may have just begun. With the participation of traditional institutions and the improvement of the recognition of the value of BTC, BTC is likely to allow miners to achieve long-term stable profits like gold, that is, the price of Bitcoin will be higher than the mining cost for a long time.
1.3 After Dencun upgrade, Base and Solana compete for development
On March 13, the Dencun upgrade was activated on the ETH mainnet, causing a surge in on-chain activity on many networks. With the Base upgrade to use Blob, the transaction fee of the Base network dropped from $0.31 to $0.0005. Soon after, Base TVL exceeded $1.7 billion, and Base's daily transaction volume also rose to 2 million, an increase of 350%.
Along with the craze of Meme coin, in addition to the sharp increase in Solana's activity, Base also took advantage of the significant reduction in network fees to compete with Solana for development, making the FOMO sentiment of Meme coin almost dominate the market in March.
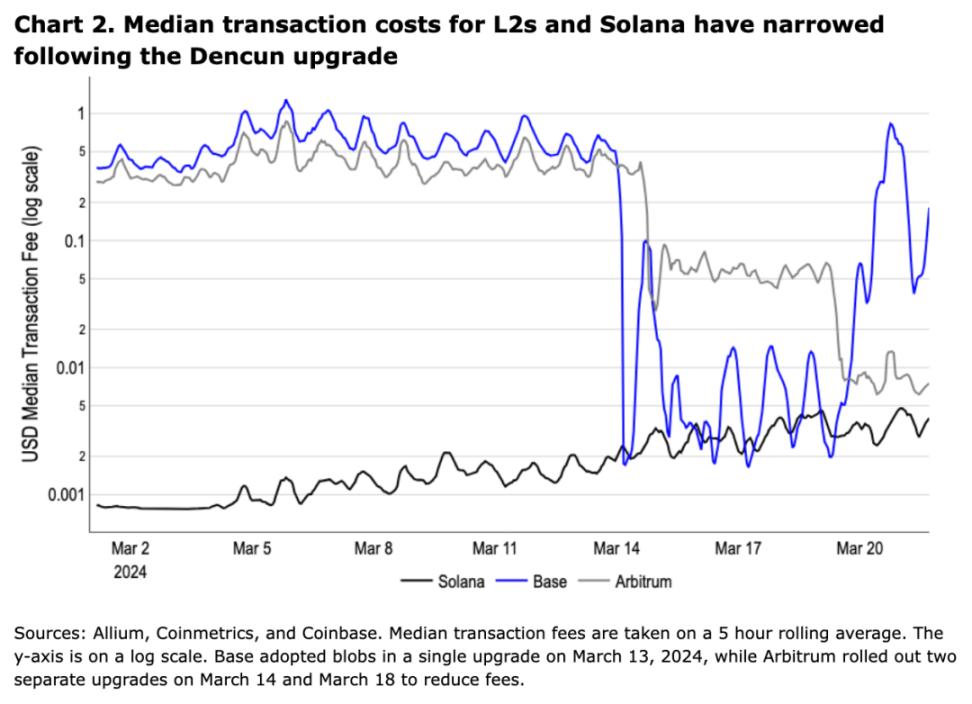
Judging from the performance of transaction fees on Base, during periods of low congestion, the median transaction fees of these networks have been below $0.01; however, during periods of congestion, transaction fees on Base soared to pre-Dencun levels, which left some underpriced transactions pending until market fees returned to their target execution rates, resulting in higher median transaction costs during periods of congestion.
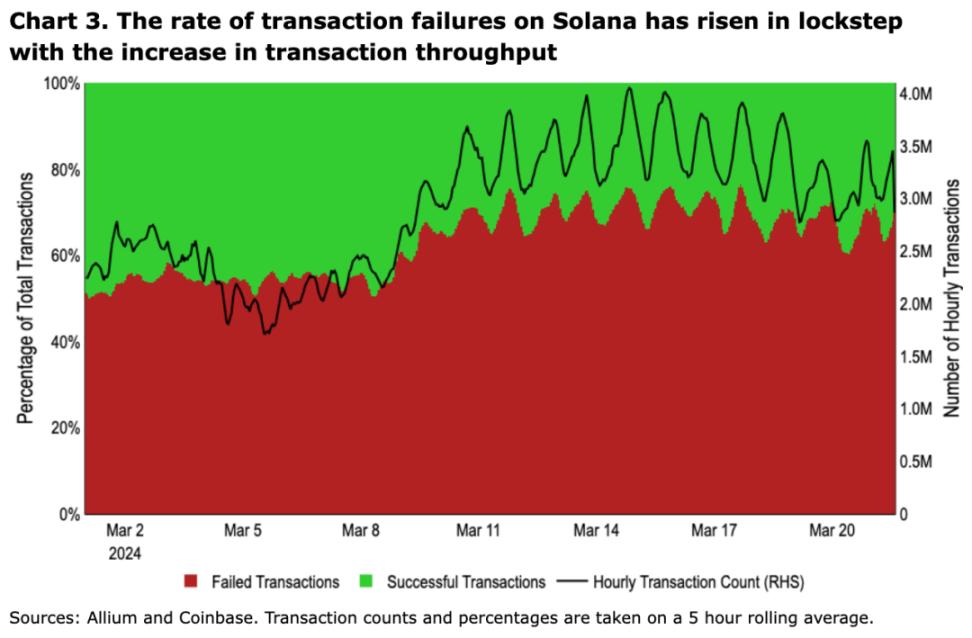
On the other hand, Solana is able to maintain a low median fee because it does not have pricing based on computing units (i.e., fees are not directly related to computing resource consumption) and lacks an effective priority fee mechanism. However, this approach incentivizes people to send junk transactions to the network to increase the likelihood of transaction packaging, resulting in a large number of discarded and failed transactions on Solana.
For both Solana and Base , their scalability roadmaps are still long, and they have different trade-offs in the routes they take:
The Base team is considering increasing the target capacity of its chain directly in the short term, and the next big bottleneck is focused on optimizing execution, especially in dealing with state growth. However, solving the long-term state growth problem may take some time, which means that for some time to come, it may cause continued price surges during congestion;
Solana Labs plans to release v1.18 client version in mid-April to solve some of their existing problems by upgrading the scheduler mechanism; and the Solana Foundation has been promoting a more optimized architecture, including the implementation of priority fees, optimized use of computing units, and other anti-sybil attack mechanisms that can improve overall network performance;
2. Industry data
2.1 Market value & ranking data
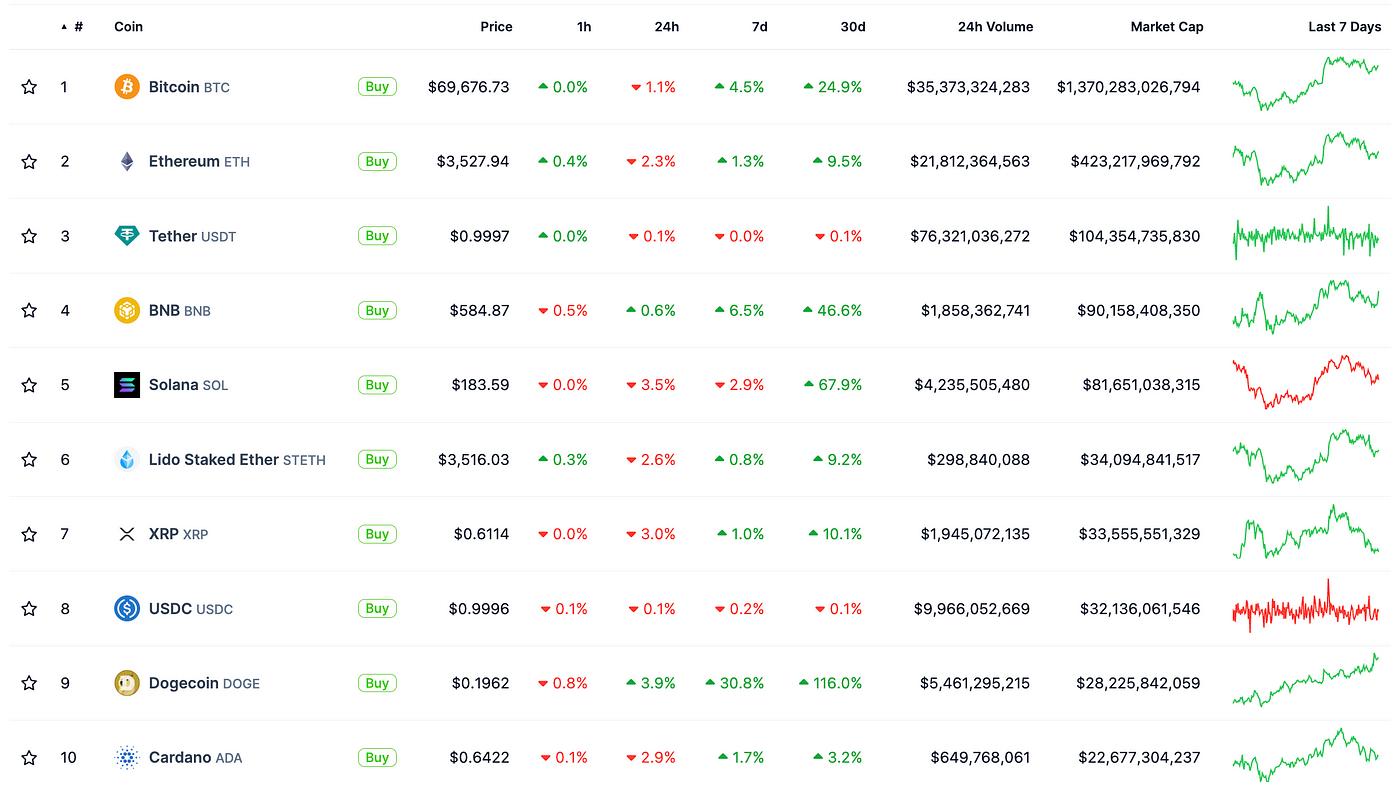
In this month's general rise, the market value of the top 10 tokens has increased to varying degrees. Except for Solana, which briefly surpassed BNB and jumped to fourth place, the overall ranking has not changed much. From the 30-day increase, DOGE rose 116%, ranking first, followed by SOL with 67.9% and BNB with 46.6%, and BTC ranked fourth with 24.9%.
The huge increase in DOGE and SOL mainly comes from the Meme coin market in March. The skyrocketing market of PEPE, BOME, WIF, DOGE, and FLOKI took turns, and SOL became the cornerstone of the prosperity of the Meme ecosystem, thus driving the upward trend of SOL coin price and market value. Currently, Base Chain and BNB Chain are empowering and promoting the activity and development of Meme coins. It is expected that the Meme market will continue in April.
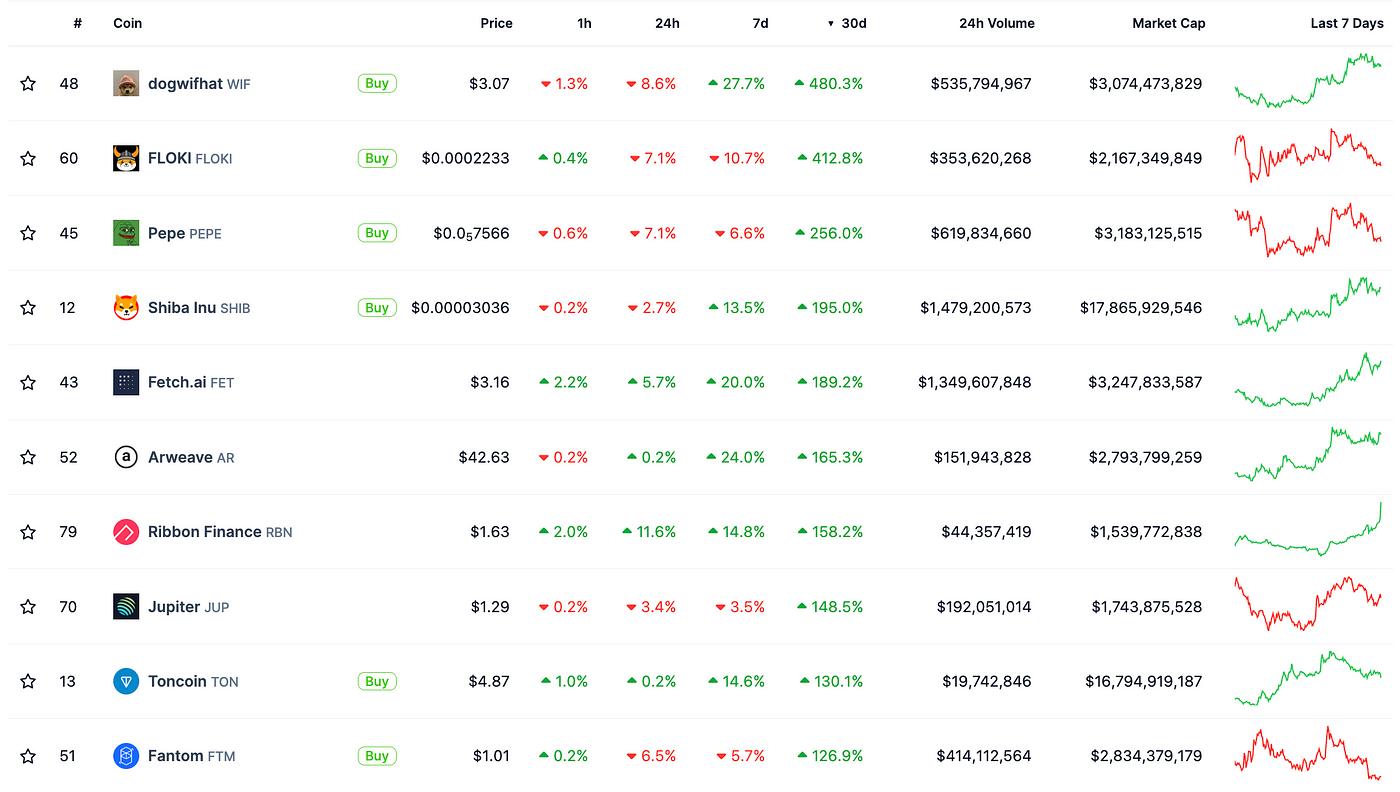
Among the top 100 tokens by market capitalization, the tokens with the highest growth in March are dogwifhat (+ 480.3%), FLOKI (+ 412.8%), and FLOKI (+ 256.0%). The growth trend is distributed throughout the month. Combined with the hot trend of the Meme ecosystem on the Base Chain, this high growth Meme market is likely to continue in April. In addition, the AI track and BTC ecosystem have been popular recently and are expected to have outstanding performance in April.
2.2 Stablecoin Inflow and Outflow
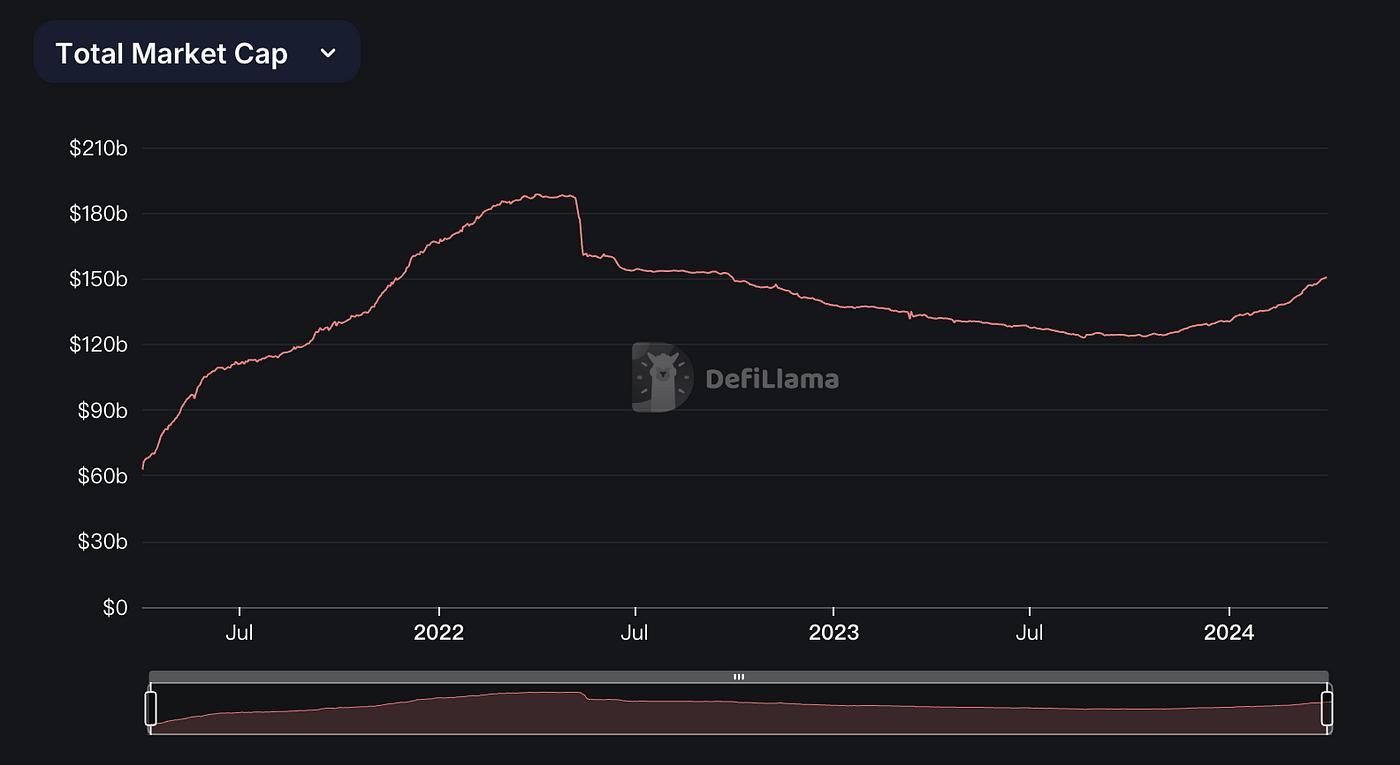
The inflow trend of stablecoins in March performed well, and the total amount of stablecoins has exceeded $150 B. Judging from the starting slope, this growth may still be accelerating. It is expected that with the continued strength of this round of cycle, this growth rate will continue and reach its peak in the next 3-6 months.

The fastest growing stablecoin this month is USDe, which increased by 156%; followed by USDC, which increased by 17.79%; while FDUSD, which had the highest growth trend in the previous two months, decreased by 11.01%; although there are many doubts about USDe in the industry, its rapid growth seems to indicate that in this round of market, the role played by algorithmic stablecoins will become more important.
USDe is issued by Ethena. As of March 30, the supply exceeded 1.5 billion, and the contract positions opened by the protocol accounted for 15% of the global ETH contract positions. Seraphim, head of growth at Ethena, tweeted: The next step is to include BTC in the category of collateral, and plans to expand the issuance of USDe to more than $5 billion in September.
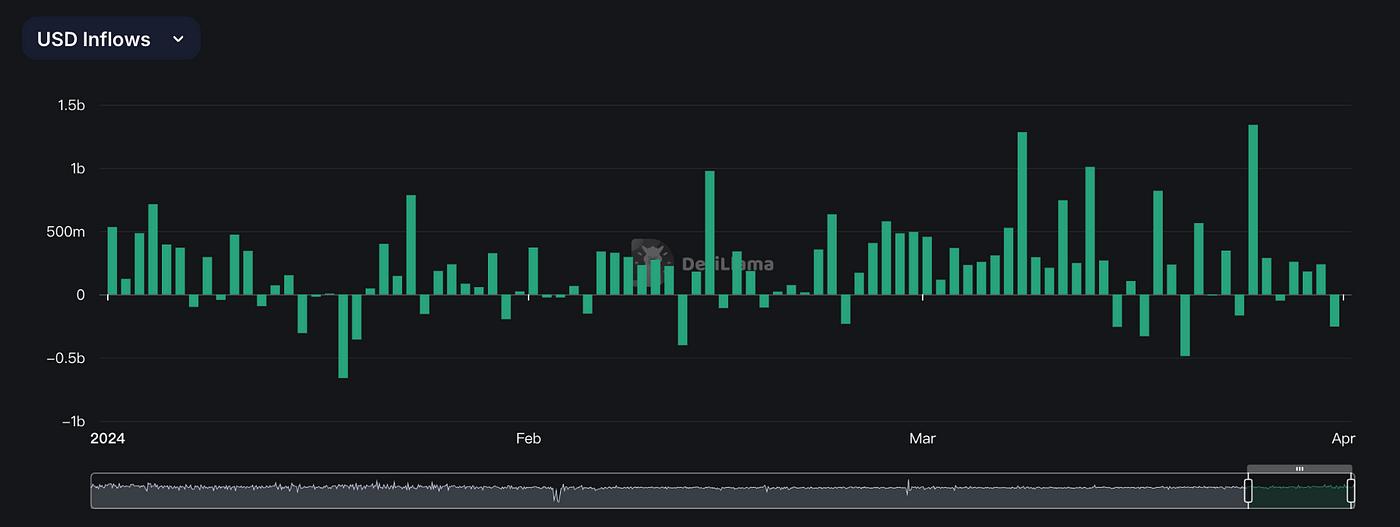
In terms of USD inflow, the growth trend is the same as that of the overall stablecoins, with the highest single-day net inflow of $1.34 B on March 25. Although there were occasional short-term net outflows during this period, the amount and frequency of net outflows were much lower than the net inflows. In addition, from the news perspective, the buying power of US institutions in the market is still very strong, which is bound to continue to drive the increase in USD inflows.
2.3 On-chain TVL ranking
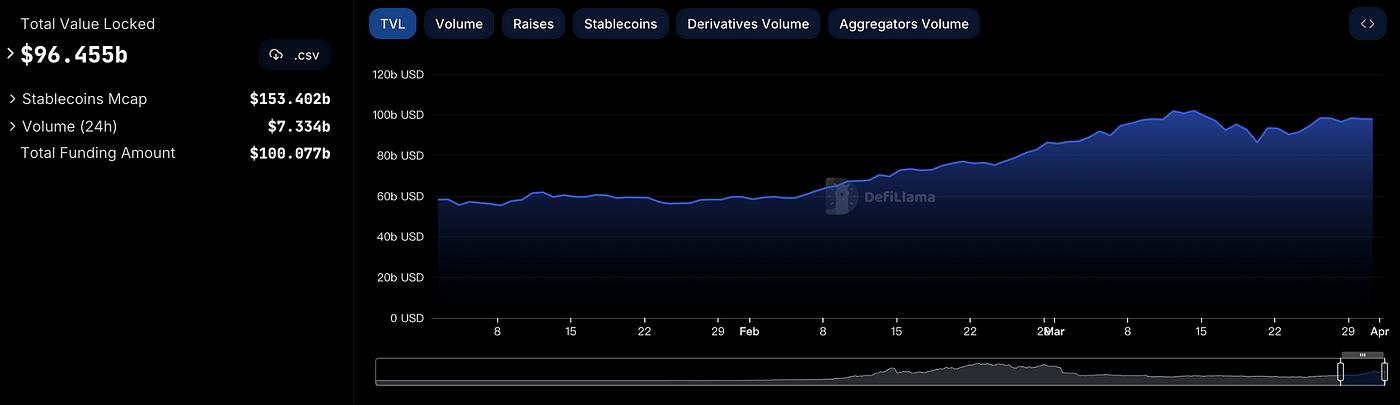
The TVL on the entire chain showed significant fluctuations in March, with a clear downward trend in the third week of this month, and then gradually recovered and continued to grow at a slower rate. This trend is almost consistent with the trend of the entire market. It is expected that with the short-term correction and large fluctuations before the halving, the TVL on the chain will also change accordingly, but the growth trend of the currency standard will continue.
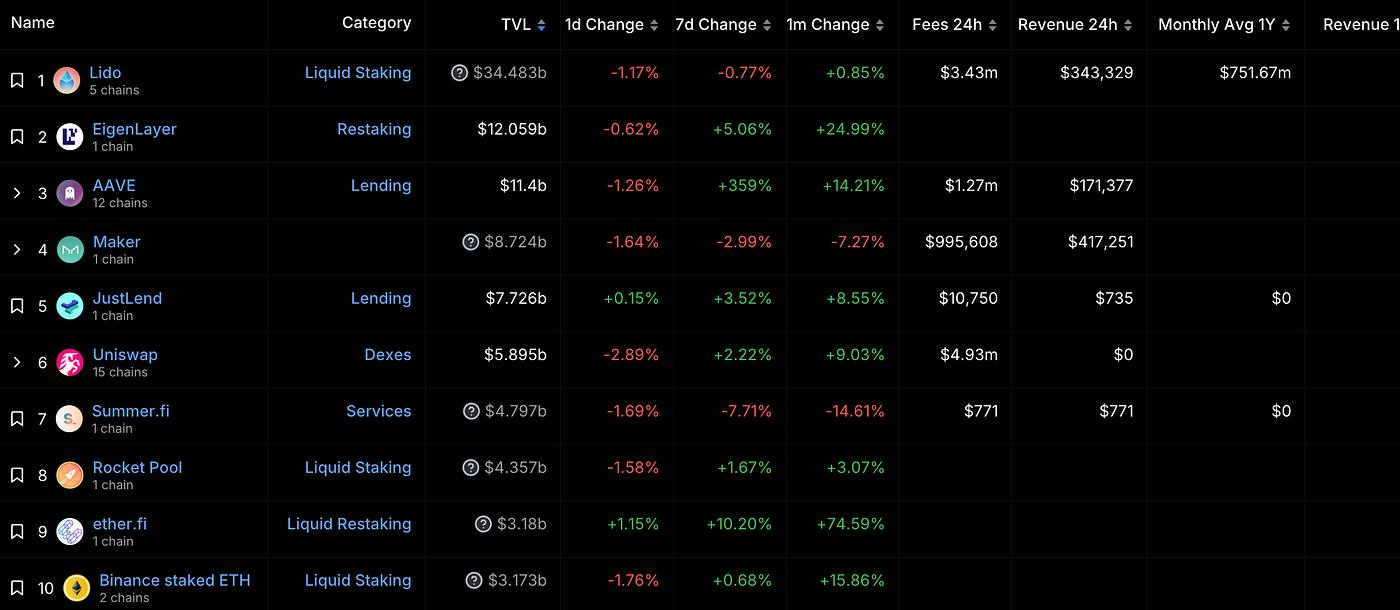
The most watched project this month is etherr.fi. With the airdrop of its token ETHFI and its listing on major CEXs, etherr.fi's TVL increased by 74.59%, ahead of other projects in the top 10 TVL rankings and far exceeding EigenLayer's 24.99%.
DeFiLlama data: As of March 29, the TVL of ETH liquidity re-pledge protocols reached $7.678 billion, of which EigenLayer ranked first with a TVL of more than $12 billion; followed by ether.fi, with a TVL of more than $3 billion; and Renzo, with a TVL of more than $1.6 billion.
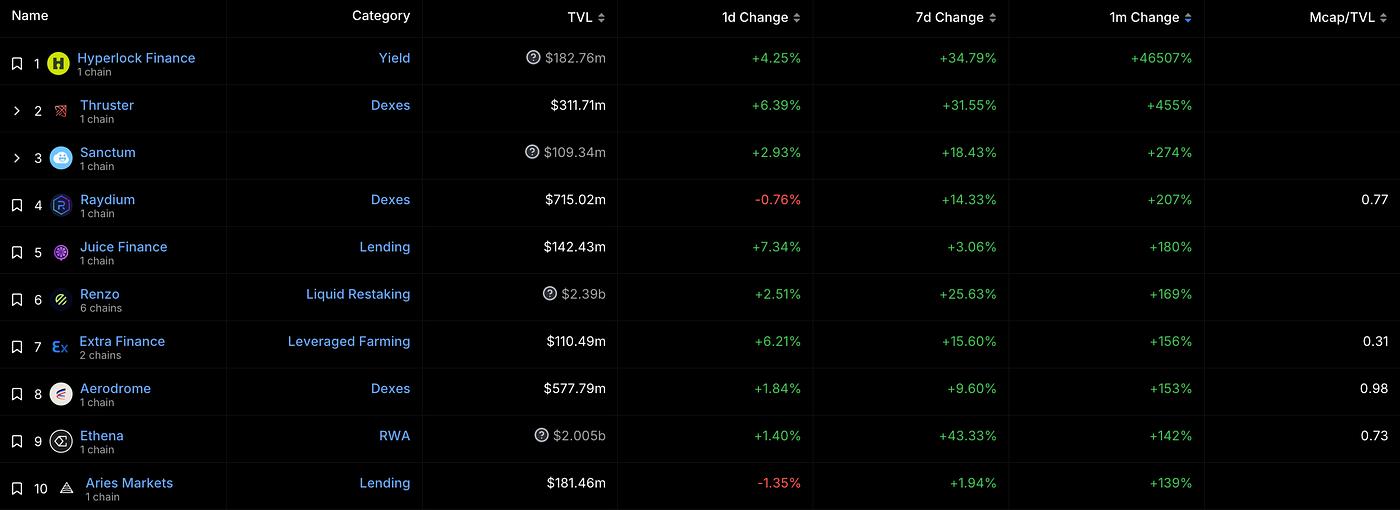
Among the 142 projects with a current TVL above $100 million (only 31 last month), the project with the largest TVL growth this month is Hyperlock Finance, a yield-boosting and meta-governance protocol designed to deepen Thruster liquidity, which enables Blast ecosystem projects to more easily obtain liquidity by allowing traders and DAOs to earn additional income on Hyperlock. It is expected that as Blast's ecosystem expands, Hyperlock will converge and empower its ecosystem, and its TVL is likely to continue to grow significantly in the next 3 months.
About Blast, Thruster, and Hyperlock
Blast is an EVM-compatible optimistic rollup with native yields. Users’ balances will automatically compound and they will earn additional Blast rewards.
Thruster is Blast’s native DEX, designed to leverage Blast’s native yields, custom liquidity solutions, and a simpler UI/UX;
Hyperlock is a protocol based on Thruster that optimizes yield and governance for Blast. Thruster LP and THRUST stakers are offered higher rewards;
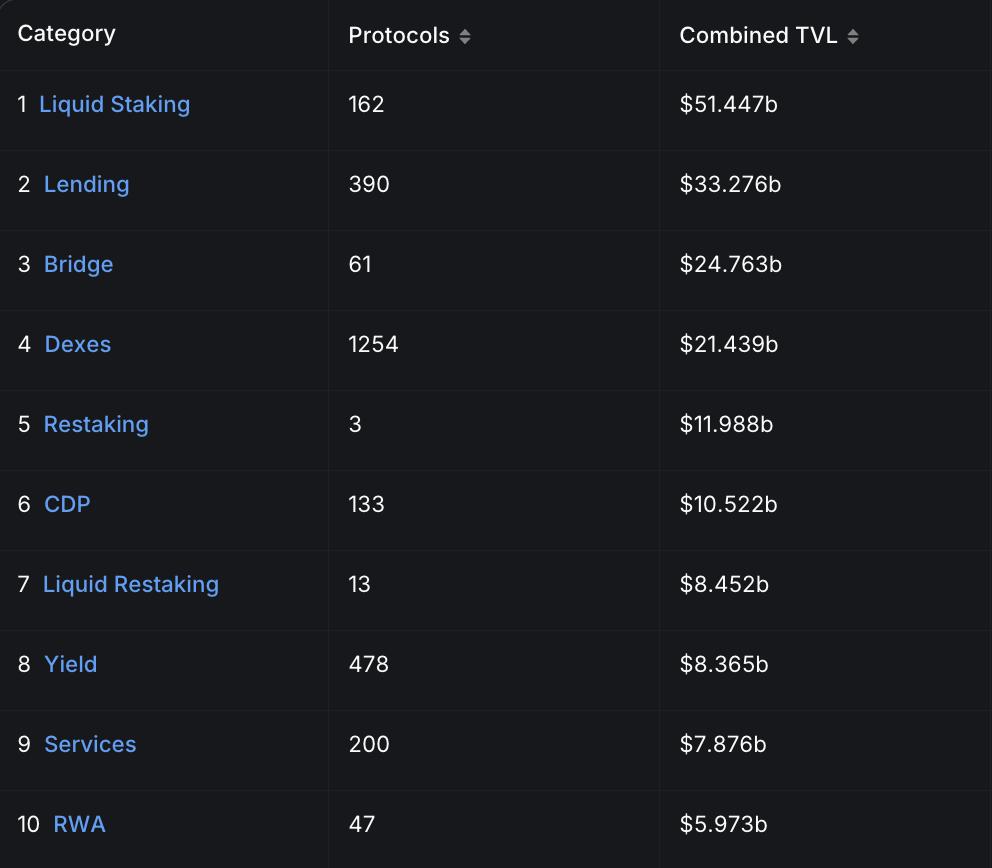
By DeFi category, among the top 10 tracks in terms of TVL this month, LSD still ranks first with $51.44 billion. Although it has decreased from last month ($53.3 billion), considering the changes in the overall market price, the total amount is still growing.
In addition, in other tracks, except for CDP which dropped by about $1 billion, there were different degrees of growth, especially Lending, Bridge and Dexes tracks. This also indirectly shows that the activity level on the chain is becoming higher and higher, and the market heat is gradually heating up.
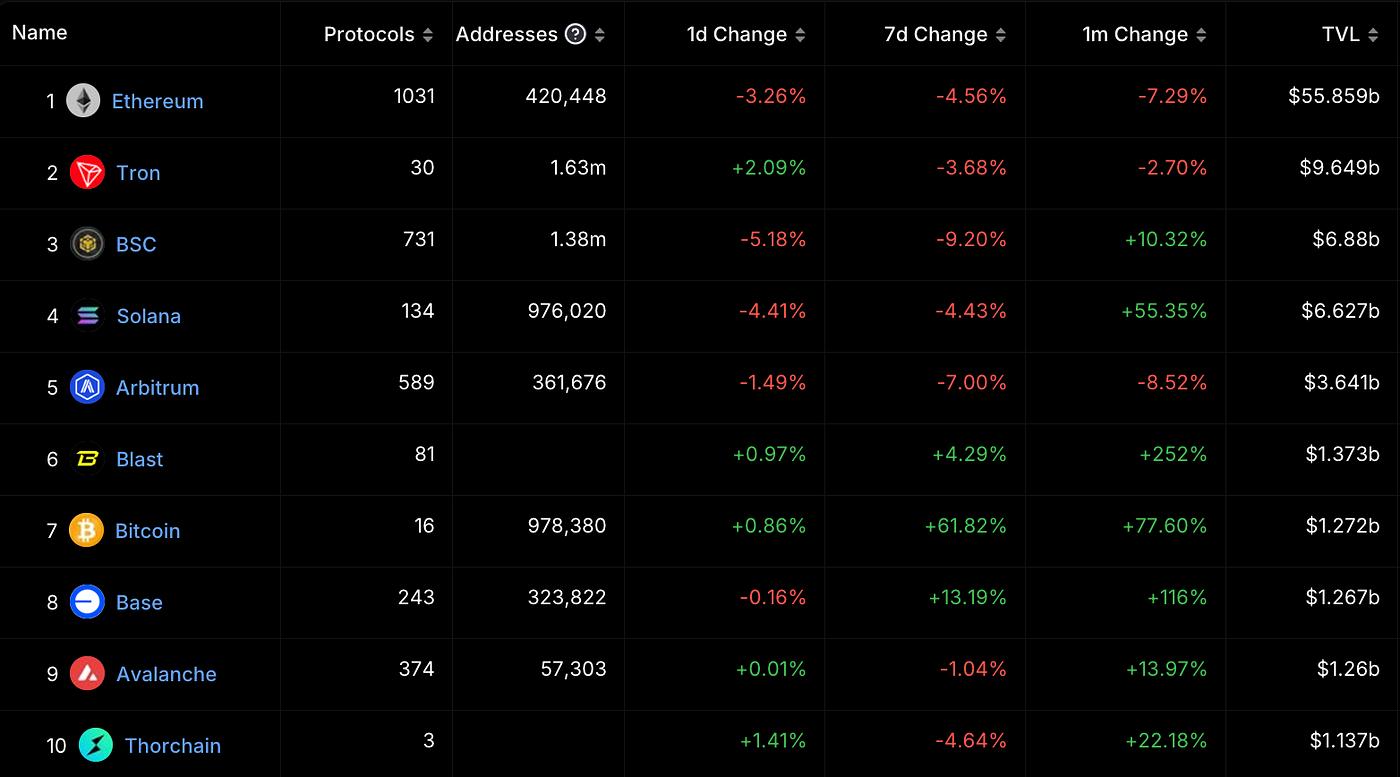
By chain category, Base's TVL growth in March was the most impressive, reaching 116%; followed by Bitcoin's TVL growth of 77.6% (694% last month), and Solana, which continued to maintain high growth, with an increase of 55.3% (40.33% last month).
The high increase of Base and the continuous increase of Solana are mainly due to the market's FOMO sentiment towards MemeCoin and the resulting surge in prices. Recently, BSC has also started to empower MemeCoin after Base. It is expected that the TVL in January will continue to grow and will still be affected by the MemeCoin market.
2.4 Mining Pool Data
BTC:
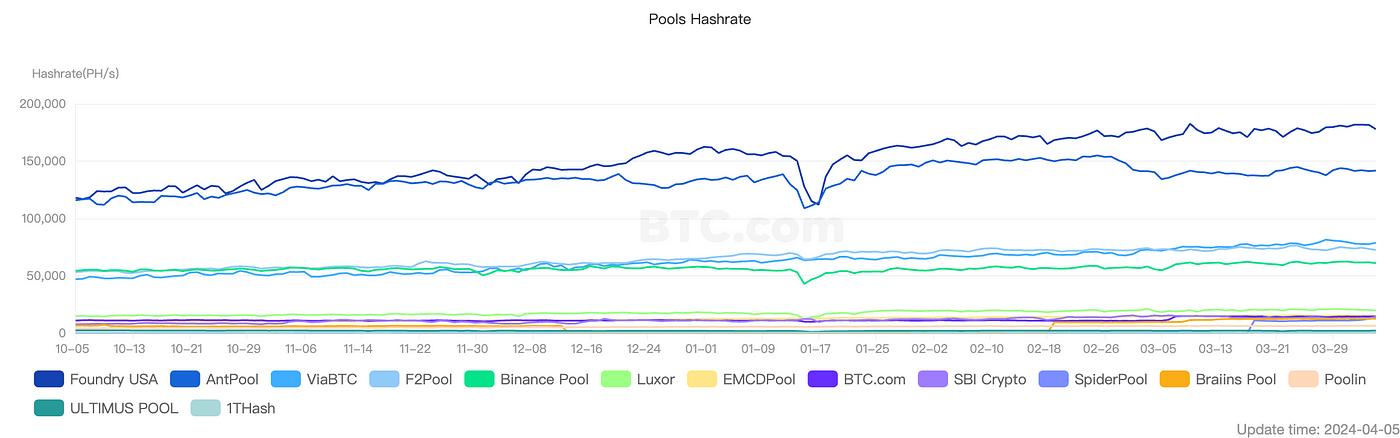
At present, the total POW computing power of the entire network has reached 596.81 EH/s, an increase of about 3.78% from last month (575.08 EH/s). Among them, the top 3 mining pools are still Foundry USA, AntPool and F 2 Pool. There are no updates or changes, but Foundry USA has performed the most stable in terms of growth rate.
The overall trend of mining pool computing power continues to rise steadily, which means that more funds and computing power are joining in, and more people are willing to consider mining as an investment option in the industry.
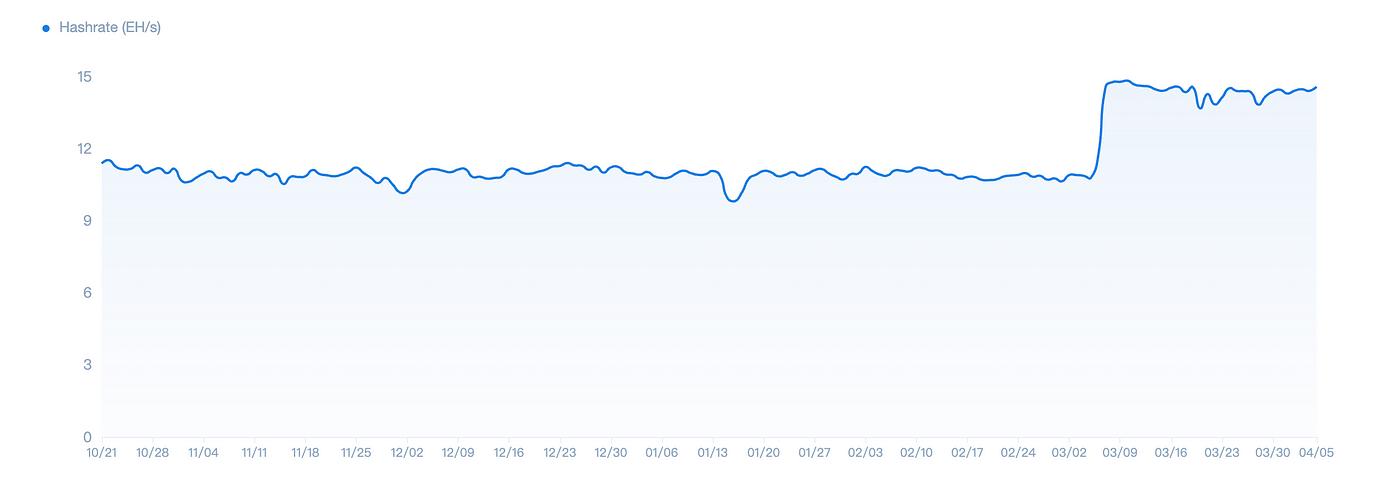
The total network computing power of the BTC mining pool is 14.440 EH/s, an increase of about 3.6 EH/s from the end of last month. Obviously, as the halving approaches, some miners are increasing computing power equipment in advance to ensure their income, which has also caused the instability and decline of the block luck value this month (the current 30-day luck value is 93.64%). In addition, there are still 2,217 blocks left before the fourth BTC output halving, and the estimated halving time is April 21, 2024.
Although the computing power has increased significantly, the average cost of BTC output this month is still $50,000 with the highest reaching $65,000 as the difficulty increases. After the halving, as the output decreases, the average cost will likely exceed $100,000, which will inevitably lead to a continued rise in BTC prices and market value.
ETH:
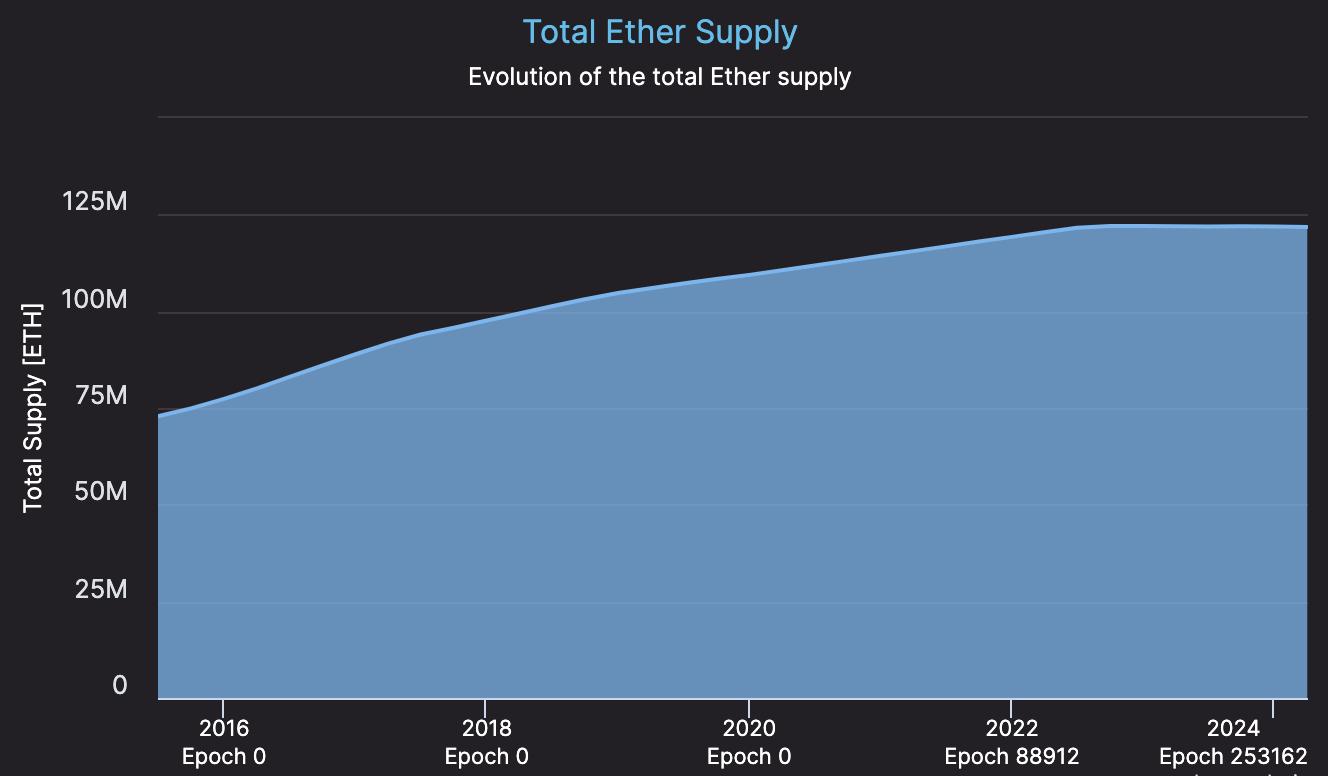
The supply trend of ETH has become flat, and there has been no significant fluctuation since June 2022, basically maintaining around 122 million. This shows that the POS mechanism has indeed played a very positive role in stabilizing the ETH ecology, and the market value of ETH is strongly correlated with its ecological value.
As the largest ecosystem in the industry today, ETH only needs to focus on the construction and expansion of its internal ecosystem to achieve convenient exploration and drive of the entire industry. In fact, this is exactly what we see.
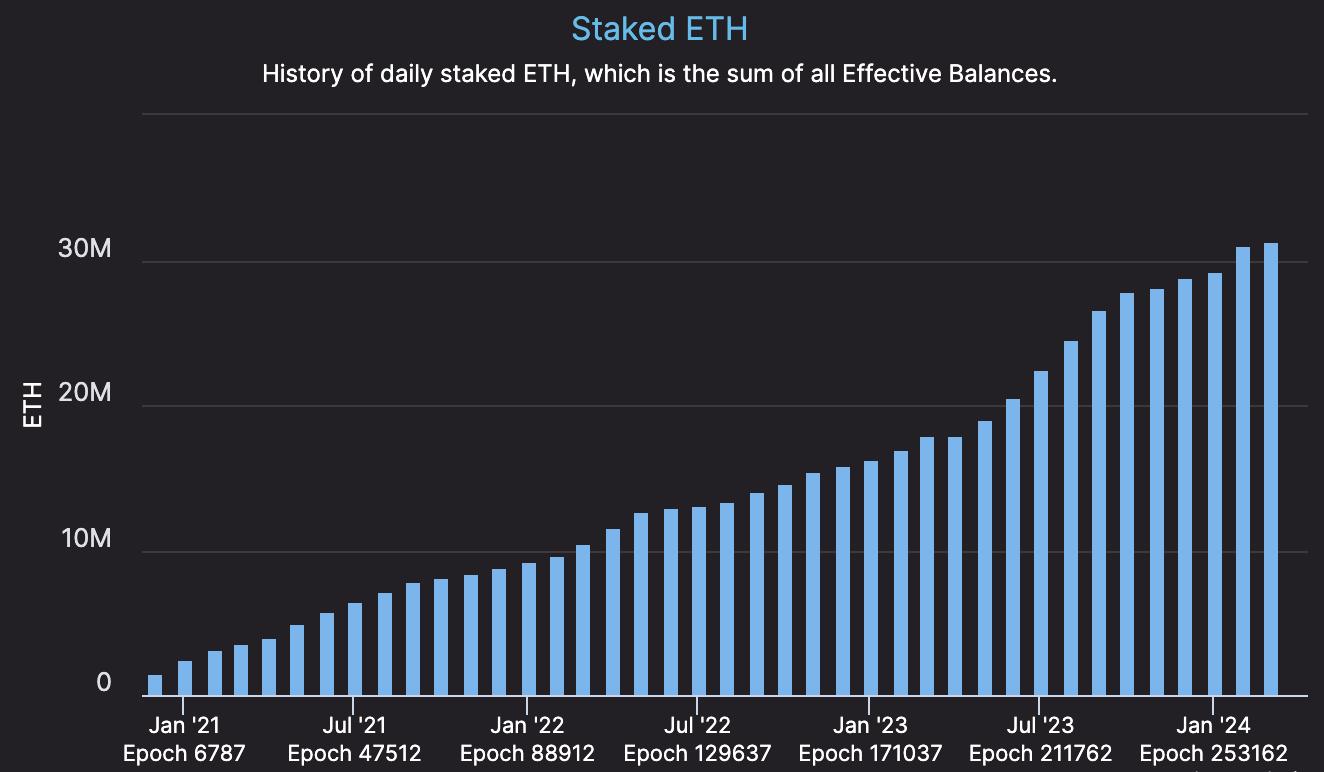
At the same time, the total number of ETH POS staked continued to rise. As of March 31, there were 978,052 active validators, and 31,328,059 ETH staked in the entire network, accounting for 26.80% of the total ETH supply. Among them, 2,306,499 new stakes were added in March, and the stake share of the liquid staking protocol Lido accounted for 30.11% of the total.
As the amount of ETH staked increases, the incentives for validators will depend more on the activity of on-chain transactions. Together with the POS mechanism, this forms a complete closed-loop regulation within the ETH ecosystem. However, the absolute proportion of Lido makes how to achieve greater decentralization an urgent issue for the ETH Foundation to address, and it is recommended to focus on it.
3. Market trends
3.1 BTC price growth weakens
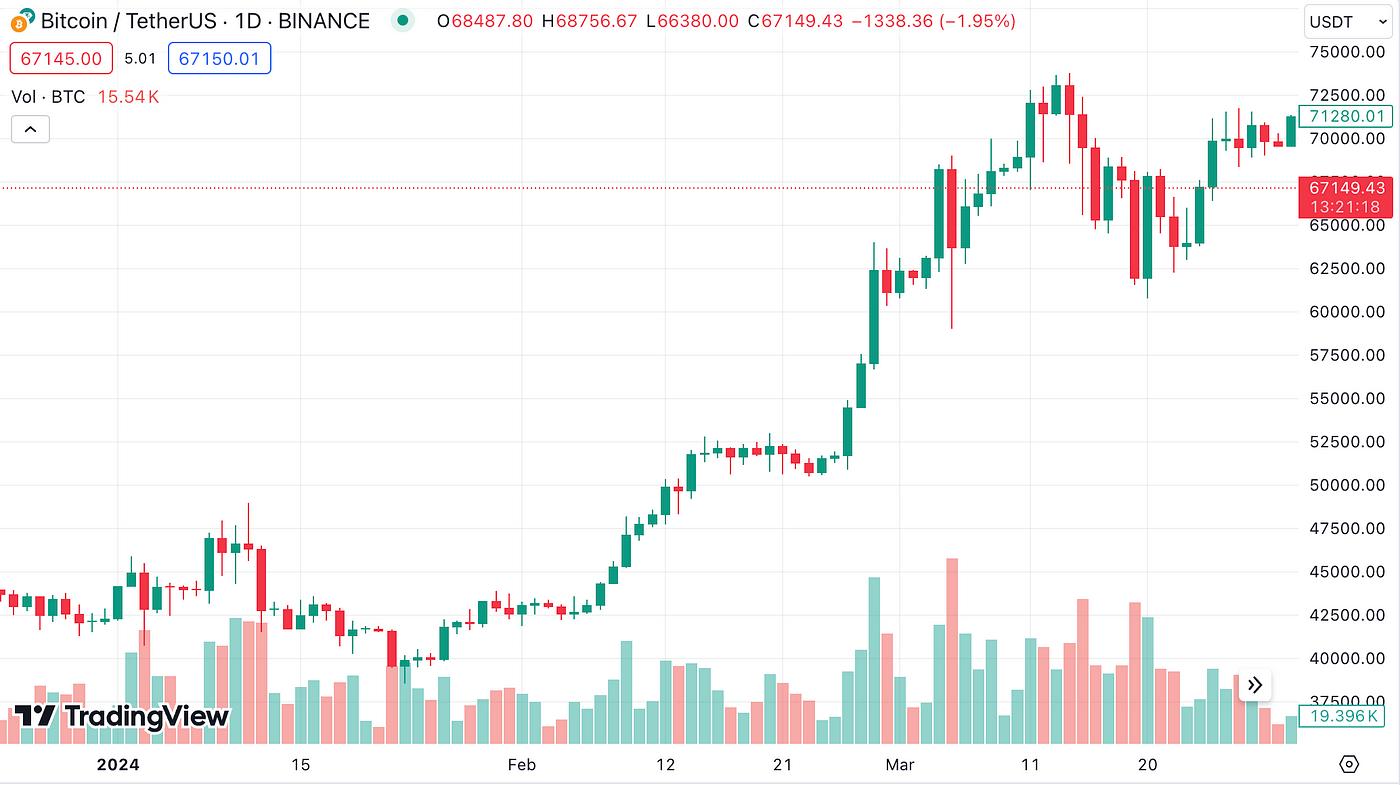
TradingView data: BTC's lowest price in March was $59,005, and its highest price was $73,777, with an overall increase of 16.6%. This increase was weaker than the 43.57% increase in February, which may be affected by the decline in net inflows of BTC spot ETFs in March.
From the Coinglass data, we can see that the net inflow of BTC spot ETF in March was 4.6368 billion US dollars, which was much lower than the net inflow in February (6.03 billion US dollars). However, the BTC price maintained a relatively stable upward momentum throughout March.
According to historical experience, the BTC price will most likely experience a pullback before and after the halving. However, we believe that with the solid fundamentals of the Bitcoin spot ETF, the relatively stable macroeconomic environment and indicators, and the positive impact of the halving, Bitcoin will continue to maintain its upward momentum even if it experiences a pullback.
3.2 The Restaking Wave Begins to Emerge

The restaking track was also the focus of attention in March. With the opening of the ether.fi airdrop, ETHFI was launched on CEX on March 18 with an opening price of $0.2. On the same day, its price soared to a maximum of $5.3, an increase of more than 26 times; although it fluctuated afterwards, the overall trend was upward, with the highest price being about $8.6, 43 times the opening price.
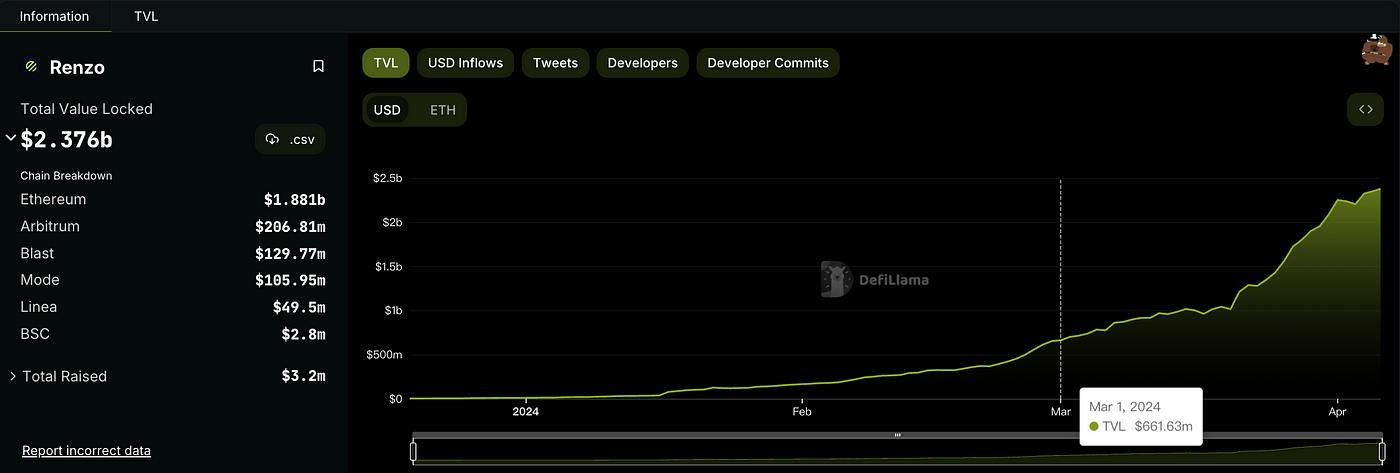
The increase and market trend of ETHFI have made people have higher expectations for other Restaking projects that have not yet issued coins, and the focus of attention is on Renzo. From Defilama data, we can see that Renzo's TVL has been growing steadily since March 1. From March 1 to March 20, its TVL increased by about $350 million; after that, its upward slope increased significantly, and from March 20 to March 31, TVL increased by about $1.08 billion, which is more than three times the previous growth rate.
Renzo's TVL growth mainly comes from people's extremely high expectations for its coin issuance. After ether.fi, if Renzo's performance is consistent with or close to people's expectations, the wave of Restaking will be unstoppable.
3.3 Meme coins continue to drive FOMO sentiment
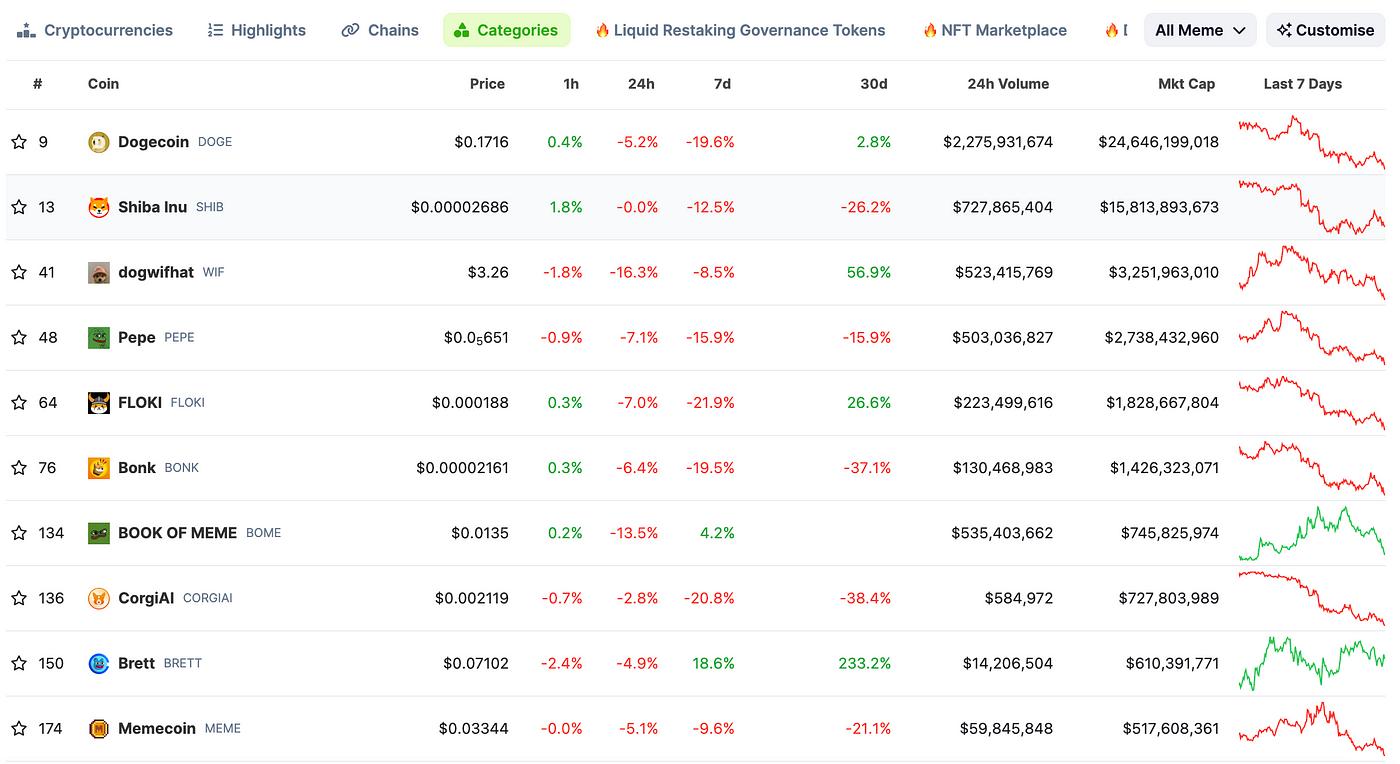
The performance of the MEME sector in March was still impressive. After the wealth-creating effects of DOGE, SHIB, and PEPE in February, Meme tokens such as BOME, MEW, WIF, and BRETT took turns to skyrocket, allowing the FOMO sentiment in the market to accumulate and release continuously.
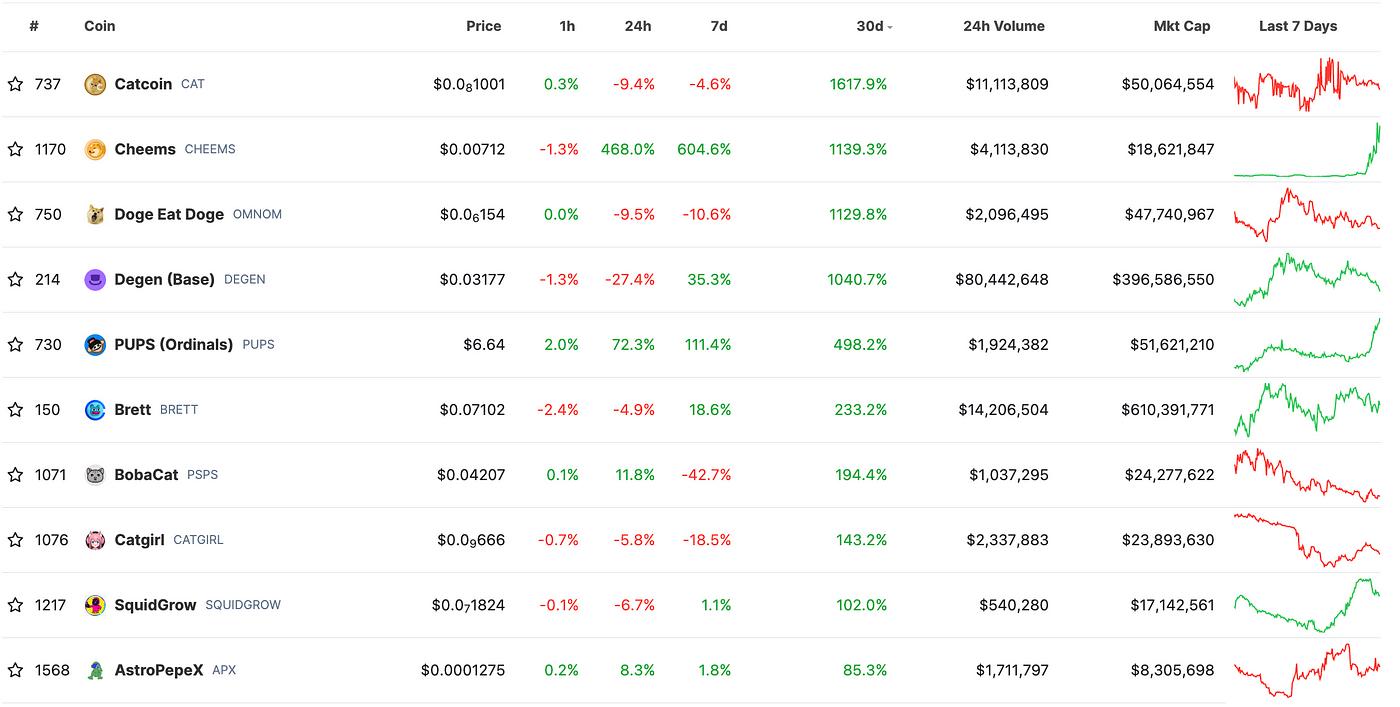
In the Coingecko TOP 10 gainers list, CAT has begun to lead a new wave of skyrocketing sentiment, while CHEEMS, OMNOM, DEGEN, etc. have begun a new relay. This market trend, on the one hand, shows that the entire crypto market is still hot and the market funds are active; on the other hand, it also shows that the market needs new stimulation, whether it is emotional or narrative.
Behind the Meme coin market, there is more of the promotion and empowerment of Solana and Base in the ecosystem. Through the Meme coin market and community introduction, Solana and Base ecosystems are extremely active and provide people with an outlet for emotional catharsis. In addition, BSC is also making corresponding plans, which may further boost the rise of the Meme sector, but whether it will continue and how long it can last is still a question mark. In particular, the huge volatility of Meme coins makes it a huge challenge for individual investors to grasp the right investment opportunity.
4. Investment and Financing Observation
4.1 Investment and Financing Overview
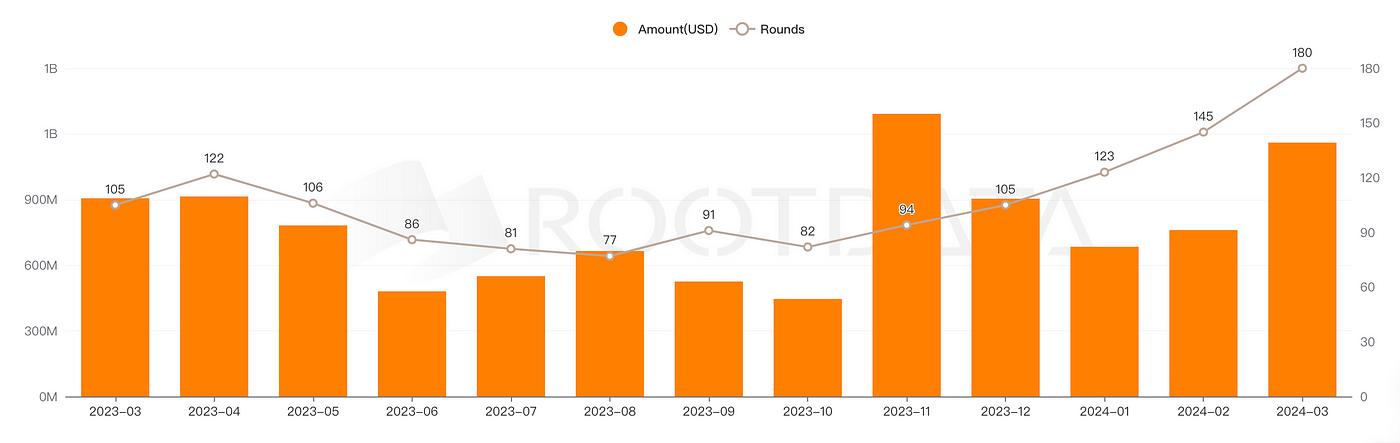
In March 2024, the total amount of the crypto market was US$1.16 billion, a month-on-month increase of 52.6%. The data is as follows:
180 financing events, a month-on-month increase of 34.32% (134 financing events in February);
3 acquisitions, a 50% decline from the previous month, indicating a decrease in acquisition activity;
The average financing amount was US$10,010,500, up 38.66% from the previous month.
The median funding round was $5 million, up 25% month-over-month.
Among them, seed round financing events were the most, followed by strategic financing and Series A financing, while other types of financing events grew rapidly:
47 seed rounds (+23% from the previous month);
30 strategic financings (+100% compared to the previous month);
19 Series A rounds (+46% month-on-month);
Other types: 17 cases (up 112% from the previous month);
Overall, although acquisition events have declined, financing events, average financing amount and median financing have all increased significantly, especially the significant increase in strategic financing and other types of financing events. This shows that market bullish sentiment has risen, the influx of hot money for investment and financing is also continuing to increase, and market bullish sentiment and cyclical sentiment are still surging.
The top five funding rounds in March:
Optimism completes $89 million financing, valuation undisclosed;
Zama completes $73 million Series A funding round at undisclosed valuation;
Berachain completes $69 million Series B financing, with a valuation of $1.5 billion;
Figure Markets completes $60 million Series A funding round, valuation undisclosed;
Eclipse completes $50 million Series B funding round at undisclosed valuation;
4.2 Brief Analysis of Investment and Financing Institutions
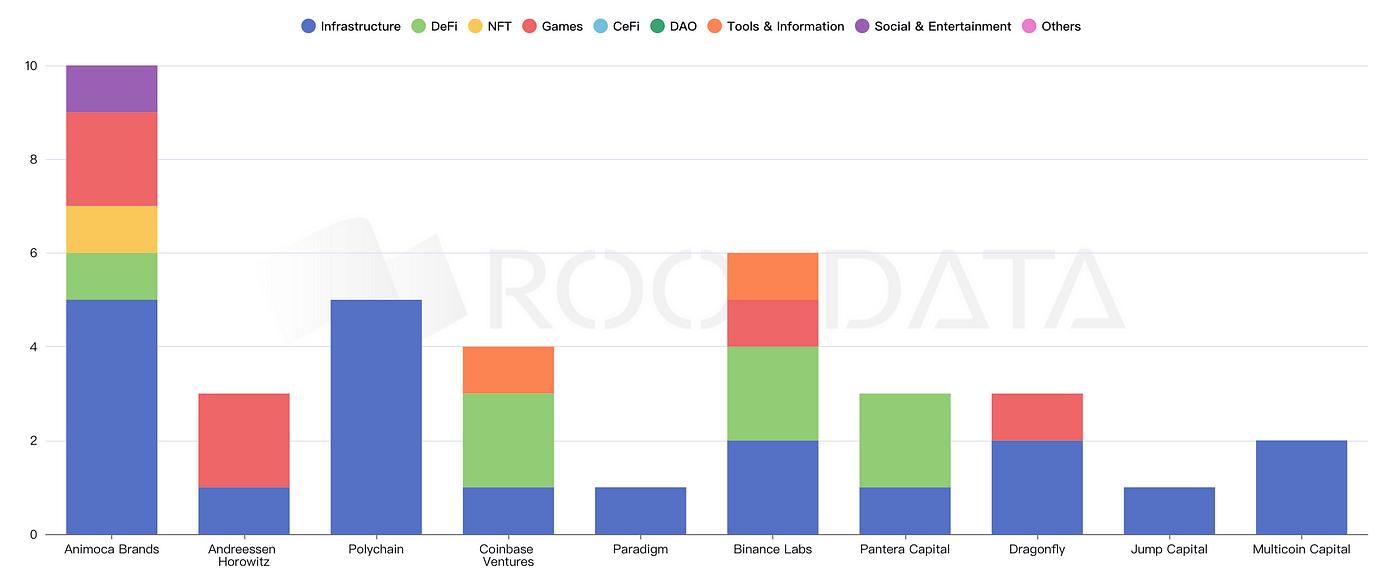
From the perspective of VC institutions: First, Animoca Brands' investment and financing are mainly concentrated in the fields of infrastructure and GameFi, followed by Polychain, Binance Labs and Coinbase Ventures. These three companies have made large investments in infrastructure and DeFi, while other VC companies' investments are focused on the infrastructure field.
This also reflects the distribution and pattern of industry construction and application at this stage. Infrastructure is still the current focus of construction, while GameFi and DeFi are the business focus on the application side.
4.3 Judgment of investment and financing trends
Judging from the investment and financing market in March, investment and financing activities in the crypto field are growing substantially, with an increase in both the number of projects and the amount of investment, and have reached a high point in nearly a year. Investment is still concentrated in infrastructure, DeFi, and NFT/GameFi.
In April, the sectors that are currently receiving the most attention: AI+Crypto, GameFi, modularization, new applications of Solana and Base chain, and Bitcoin Layer 2, may further stimulate the investment market boom as investment and financing become more active. Although they may be affected by various factors such as the global economy, technological innovation, and policy environment, the overall positive trend remains unchanged.
5 Conclusion
The data and market dynamics in March 2024 show us several important trends:
Although the rise of US stocks did not meet expectations, the macro outlook is good in the future, and the trend of the crypto market will not be negatively affected;
As the halving approaches, profit-taking and the departure of some miners have led to volatile market conditions. However, the volatility is not large due to the hedging of ETFs driven by traditional capital and the halving expectations.
Stablecoins continue to be issued, with USDe increasing by as much as 156%. It is expected that the role played by algorithmic stablecoins will become more important;
The TVL of the on-chain Restaking ecosystem has grown significantly, and the surge in the price of ETHFI after its launch has greatly enhanced people’s expectations for Restaking;
The substantial growth in the median investment and financing amount, as well as the investment and financing layout of major institutions, indirectly reflects the surge in market hot money and market sentiment;
Although the current market has fluctuated significantly, the market dominated by traditional capital and ETFs is still the main narrative. In this cycle, the Meme coin market is significantly different from the previous market cycles, especially after the Dencun upgrade in March, Solana, Base and Bsc entered the market and drove the market, making the market FOMO sentiment unusually warm and unique during the relatively calm period.
In addition, technological innovations and related investment enthusiasm such as Restaking, modularization, BTC ecology and AI have continued to grow and stimulate the activity of market funds. In particular, whether the combination of traditional finance and RWA will have a stronger penetration and impact on the global financial ecology, let us wait and see.
Note: All the above opinions are for reference only and are not investment advice. If you disagree, please contact us for correction.
Follow and join the MIIX Captial community to learn more cutting-edge information:
Twitter: https://twitter.com/MIIXCapital_CN ;
Telegram: https://t.me/MIIXCapitalcn ;
Join the MIIX Capital team: hr@miixcapital.com
Recruiting positions: Investment Research Analyst/Operation Manager/Visual Designer


