Author: William Suberg Source: cointelegraph Translation: Shan Ouba, Jinse Finance
Bitcoin prices are at risk of renewed downside after falling 15% over the weekend, as traders and analysts assess where the market might bottom and when that might happen.
Could Bitcoin Price Drop to $59,000?
As of April 16, the BTC/USD price failed to maintain a significant rebound after challenging $61,000 and is currently hovering around $62,000.
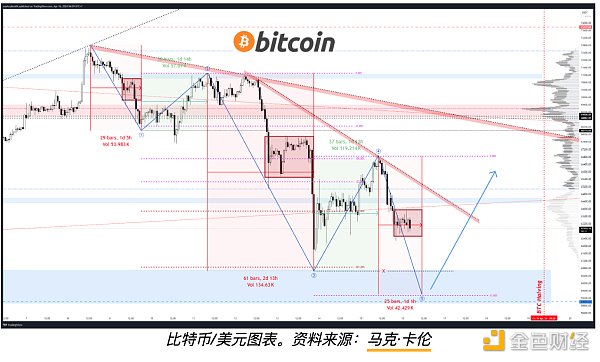
Sentiment analyst Mark Cullen believes that the Bitcoin price will test the $60,000 resistance level again.
He used the Elliott Wave Theory to predict that Bitcoin may be in its last round of decline, with the price falling to around $59,000.
“Bitcoin could still see one last leg lower to complete the C wave within a broader sideways correction pattern,” he told followers.
Analysts are divided
Other analysts hold a different view. Cryptocurrency research firm Arcane Research said that Bitcoin prices have the potential to rise above $65,000 in the coming weeks.
The firm said in a report that despite recent weak market sentiment, some key indicators remain positive, such as the increasing number of Bitcoin whales (investors who hold large amounts of Bitcoin).
Overall, the short-term trend of Bitcoin prices remains unclear. Investors should pay close attention to market dynamics and trade with caution.

A price level of $59,000 would take BTC price action to its lowest level since late February, representing the biggest drop from recent all-time highs of around 20%.
Bitcoin faces loss of key moving average support
Next, others, including well-known analyst Matthew Hyland, will look to the upcoming weekly close to gain more insight into the sustainability of the current pullback.
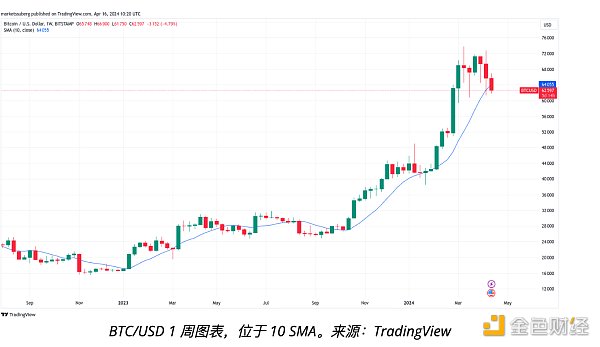
Hyland uploaded a chart and noted that BTC/USD has fallen below the support of the 10-week simple moving average (SMA), which currently sits at $64,130.
“A lot will depend on how the weekly candle closes,” he wrote in a related comment.
“The last time this moving average was tested it was a great buying opportunity and price never closed below it. The close will be the most important question.”

Data from Cointelegraph Markets Pro and TradingView show that the last full candle below the 10-week moving average occurred in mid-2023.
BTC price indicators call for lower re-accumulation phase
For Binh Dang, a contributor to on-chain analytics platform CryptoQuant, longer time frames could present a frustrating situation for Bitcoin bulls.
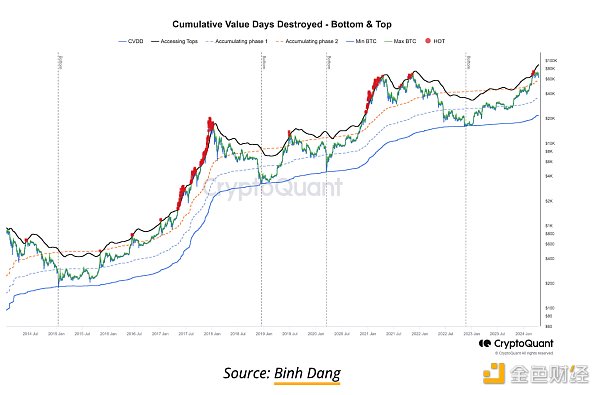
By analyzing the adjusted cumulative value destroyed days (CVDD) indicator, he predicts that BTC/USD may remain at lower levels for longer before re-challenging highs.
CVDD measures the number of days a token has been in its wallet as it moves on-chain and multiplies it by the current price.
“My adjusted CVDD indicator did a good job identifying the local top, and now, I look forward to BTC support testing and accumulation in phase 2 (orange line),” Binh explained alongside an illustrative chart.
While history suggests a deeper correction could occur, Binh added that he does not expect the geopolitical dynamics behind the current decline to reach panic levels, such as during the COVID-19 cross-market crash in March 2020.
Now, a “worst case scenario” would be for prices to hit the chart’s “Phase 1” line just below $40,000.


