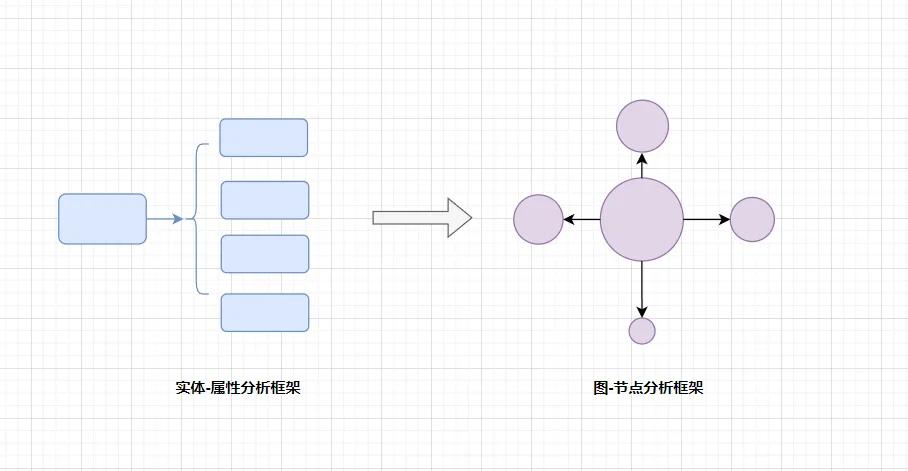
1. Transforming from entity-attribute metaphysical analysis to node-edge graph analysis
We who have undergone large-scale and long-term metaphysical training (here refers to the conceptual knowledge taught in schools) in the modern school system have become seriously dependent on the analytical framework of entity-attribute, taking entity-attribute as the essence of things, and forgetting that entity-attribute ≠ thing-in-itself
Take the popular project rating reports in the crypto in 2018 and 2019 as an example. Those reports generally adopted the entity-attribute analysis framework:
→Entity: Project A
→ Attributes: project positioning, market space, vision, technology stack, product architecture, team, roadmap
This analytical framework is the easiest to spread and understand by ordinary investors, but the conclusions drawn using this analytical framework were almost completely falsified in the last bull market.
This is because entity-attribute abstracts a specific project into an isolated existence, ignoring the fact that the value of a single project comes from its connection with the overall web3 network.
So, this year I started to learn to use the node-edge analysis framework of graph theory to analyze the value of web3 projects. This made me feel enlightened and solved many confusions.
For example, why did EOS’s technology/products, which were ahead of their time, underperform the market in the last bull market?
In the original entity-attribute analysis framework, EOS scores much higher than Solana/Avalanche/Polygon
However, in the node-edge analysis framework, EOS is an isolated node due to its lack of connection with the Ethereum ecosystem and the US capital. Its score is much lower than Solana/Avalanche/Polygon.
The performance in the last bull market just verified the correctness of the node-edge analysis framework.
Node-edge (graph theory) analysis is a serious mathematical subject. I will not elaborate on it here. Students who are interested can go to YouTube or Bilibili to learn it by themselves.
Here I will only demonstrate the application of centrality analysis in the node-edge analysis framework in judging the value of web3 projects.
Centrality analysis is a method used to measure the importance of nodes in a network. It attempts to determine which nodes are more central in the network and thus play a key role in information dissemination, influence dissemination, connectivity, etc. The following are several common centrality indicators:
Degree Centrality
Degree centrality refers to the number of connections a node has, that is, the number of its edges. The higher the degree centrality of a node, the more connections it has with other nodes.
When evaluating a web3 project, the more other web3 projects it is connected to, the higher its degree centrality
Currently in the crypto world, the project with the highest degree of centrality is Bitcoin, followed by Ethereum, then CEX such as Binance, Coinbase, OKX, and then stablecoin issuers such as USDT.
Closeness Centrality
Closeness centrality measures the average distance of a node from other nodes. Nodes with lower average distance are closer to the center of the network because they are able to spread information to other nodes faster.
When evaluating a web3 project, the shorter its average distance to other web3 projects, the higher its closeness centrality
Currently in the crypto world, the project with the highest degree centrality is Ethereum, followed by CEX such as Binance, Coinbase, OKX, and then cross-chain bridges such as LayerZero and Orbiter.
Betweenness Centrality
Betweenness centrality measures how often a node acts as an intermediary in all shortest paths.
Currently in the crypto world, the projects with the highest intermediary centrality are cross-chain bridges such as LayerZero and Orbiter.
Eigenvector Centrality
Eigenvector centrality considers the centrality of a node and the nodes connected to it, that is, the sum of the centrality of a node and the nodes connected to it.
Currently in the crypto world, the projects with the highest eigenvector centrality are L2 projects such as Arbitrum, Optimistim, Starknet, Zksync, Scroll, Taiko, etc.
Through the above centrality analysis, we can easily evaluate the position and importance of a web3 project in the entire web3 value network.
2. Converting from causal chain analysis to probabilistic correlation analysis
If the metaphysical analysis framework of entity-attribute is the ideological stamp placed in our brains by modern school education, then the causal chain analysis framework of A-BCD is rooted in the physiological structure and working mode of our brains.
Simply put, the physiological structure and working mode of our brain are very similar to the architecture and working mode of AI, so AI is also called artificial neural network.
Algorithms, computing power, and data are the three elements for AI to learn knowledge, and they are also the three elements for our brain to learn knowledge.
The difference is that AI’s computing power is N times that of our brain. In order to ensure the availability of learning, the brain constantly seeks energy-saving and easy-to-use algorithms in its interaction with the environment, and causal chain analysis is one of them.
Causal chain analysis is already useful in daily life and can help us deal with various affairs in life and work.
But being obsessed with causal chain analysis in financial market transactions can lead to big problems
After every surge or plunge in the market, the media/traders tend to attribute it to one or more reasons. For example, the A-share market attributes the recent plunge to northbound capital outflows, and the crypto market attributes the recent plunge to Musk's SpaceX company clearing out Bitcoin.
Then, they try their best to find a certain event and market trend, trying to grasp the causal law to arbitrage. This is a kind of unrealistic behavior in trading thinking.
Trading in financial markets means that we as individuals are facing the uncertainty of the real world, and we should use probabilistic correlation analysis to understand it.
Financial time series methods is also a serious subject. Students who are interested can go to YouTube or Bilibili to learn.
The entry-level financial time series methods include AR and MR. I have explained this analysis method in detail in previous tweets, so I will not repeat it here.

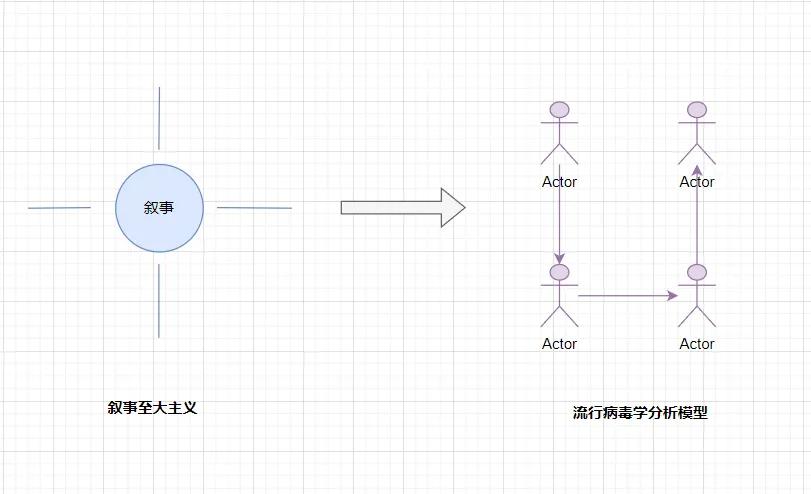
3. From narrative maximalist analysis to epidemiological analysis
The crypto industry is deeply influenced by the two best-selling books "Animal Spirits" and "Narrative Economics", and generally believes in narrative maximalism, and I am one of them.
Whenever I see narratives such as decentralization, web3, paradigm revolution, new primitives, stratification, fairness, etc. in white papers, I can’t help but get excited. I have a sense of honor and sacredness of participating in a great historical process, and then I begin to equate the narrative of the project with the value of the project.
Web3 projects from India are very good at taking advantage of this, such as Polygon's "Internet Value Layer" narrative and ZkSync's "ZK Magna Carta" narrative. They are very good at manipulating the crypto industry's collective unconscious obsession with narratives to start the valuation growth flywheel.
The disadvantage of crypto industry narrative maximalism is that it looks at things statically and in isolation, advocating an irrational and poetic power.
Believe in narrative maximalism, and easily be taken advantage of by some big but empty projects with no practical utility, such as modular public chains, ZK shared security, etc.
So we need to use epidemiological analysis methods to supplement it. In fact, the book "Narrative Economics" also spends a lot of space using epidemiology to analyze how narratives drive the economy.
Epidemiological analysis is also a serious subject. Students who are interested can study it on YouTube or Bilibili.
To analyze the crypto, we only need to understand the SIR model.
The SIR model is an epidemiological model used to describe the spread of infectious diseases in a population. This model divides the population into three main categories: susceptible, infected, and recovered.
These categories represent different states in the population, and over time people may move from susceptible to infected and then to recovered.
Here is an explanation of the three main categories in the SIR model:
- Susceptible: These are individuals in the population who have not yet contracted the disease. They are at potential risk and may become infected after coming into contact with an infected person.
- Infectious: This is an individual who has been infected with a disease and can spread the disease to susceptible individuals. For a period of time, an infected person may spread the disease and then move to a recovered state.
- Recovered: This is an individual who has recovered and is no longer capable of spreading the disease. Once an individual recovers, they are usually immune to the disease, depending on the nature of the specific disease.
The basic differential equation of the SIR model describes the changing trends among susceptible, infected, and recovered people.
To analyze crypto investments using the SIR model, we only need to replace susceptible, infected, and recovered people with potential investors, existing investors, and exited investors, respectively.