

The price of TRON (TRX) is currently showing an upward trend, but the prices of other major coins in the market are positive today, while the TRX price is declining.
Various indicators are showing an upward outlook, but there are also signals that could be a crucial turning point for TRX.
The TRON (TRX) Ichimoku Cloud shows an upward momentum
The Ichimoku Cloud chart of TRX price generally indicates a positive outlook. Currently, the TRX price is above the cloud, which is generally considered a positive signal for an upward trend. The cloud itself is moderately thick, and can provide support levels below the current price.
Additionally, the green Senkou Span A is positioned above the red Senkou Span B, forming a positive cloud that reinforces the upward momentum going forward. The baseline (red line) is currently below the price, providing support, but its flat trajectory suggests a temporary pause in momentum.
Meanwhile, the conversion line (blue line) closely follows the price movement and maintains a positive outlook for short-term momentum. However, if the conversion line crosses below the baseline, a bearish signal may emerge.
Read more: The 7 Best TRON (TRX) Wallets to Store Your TRX
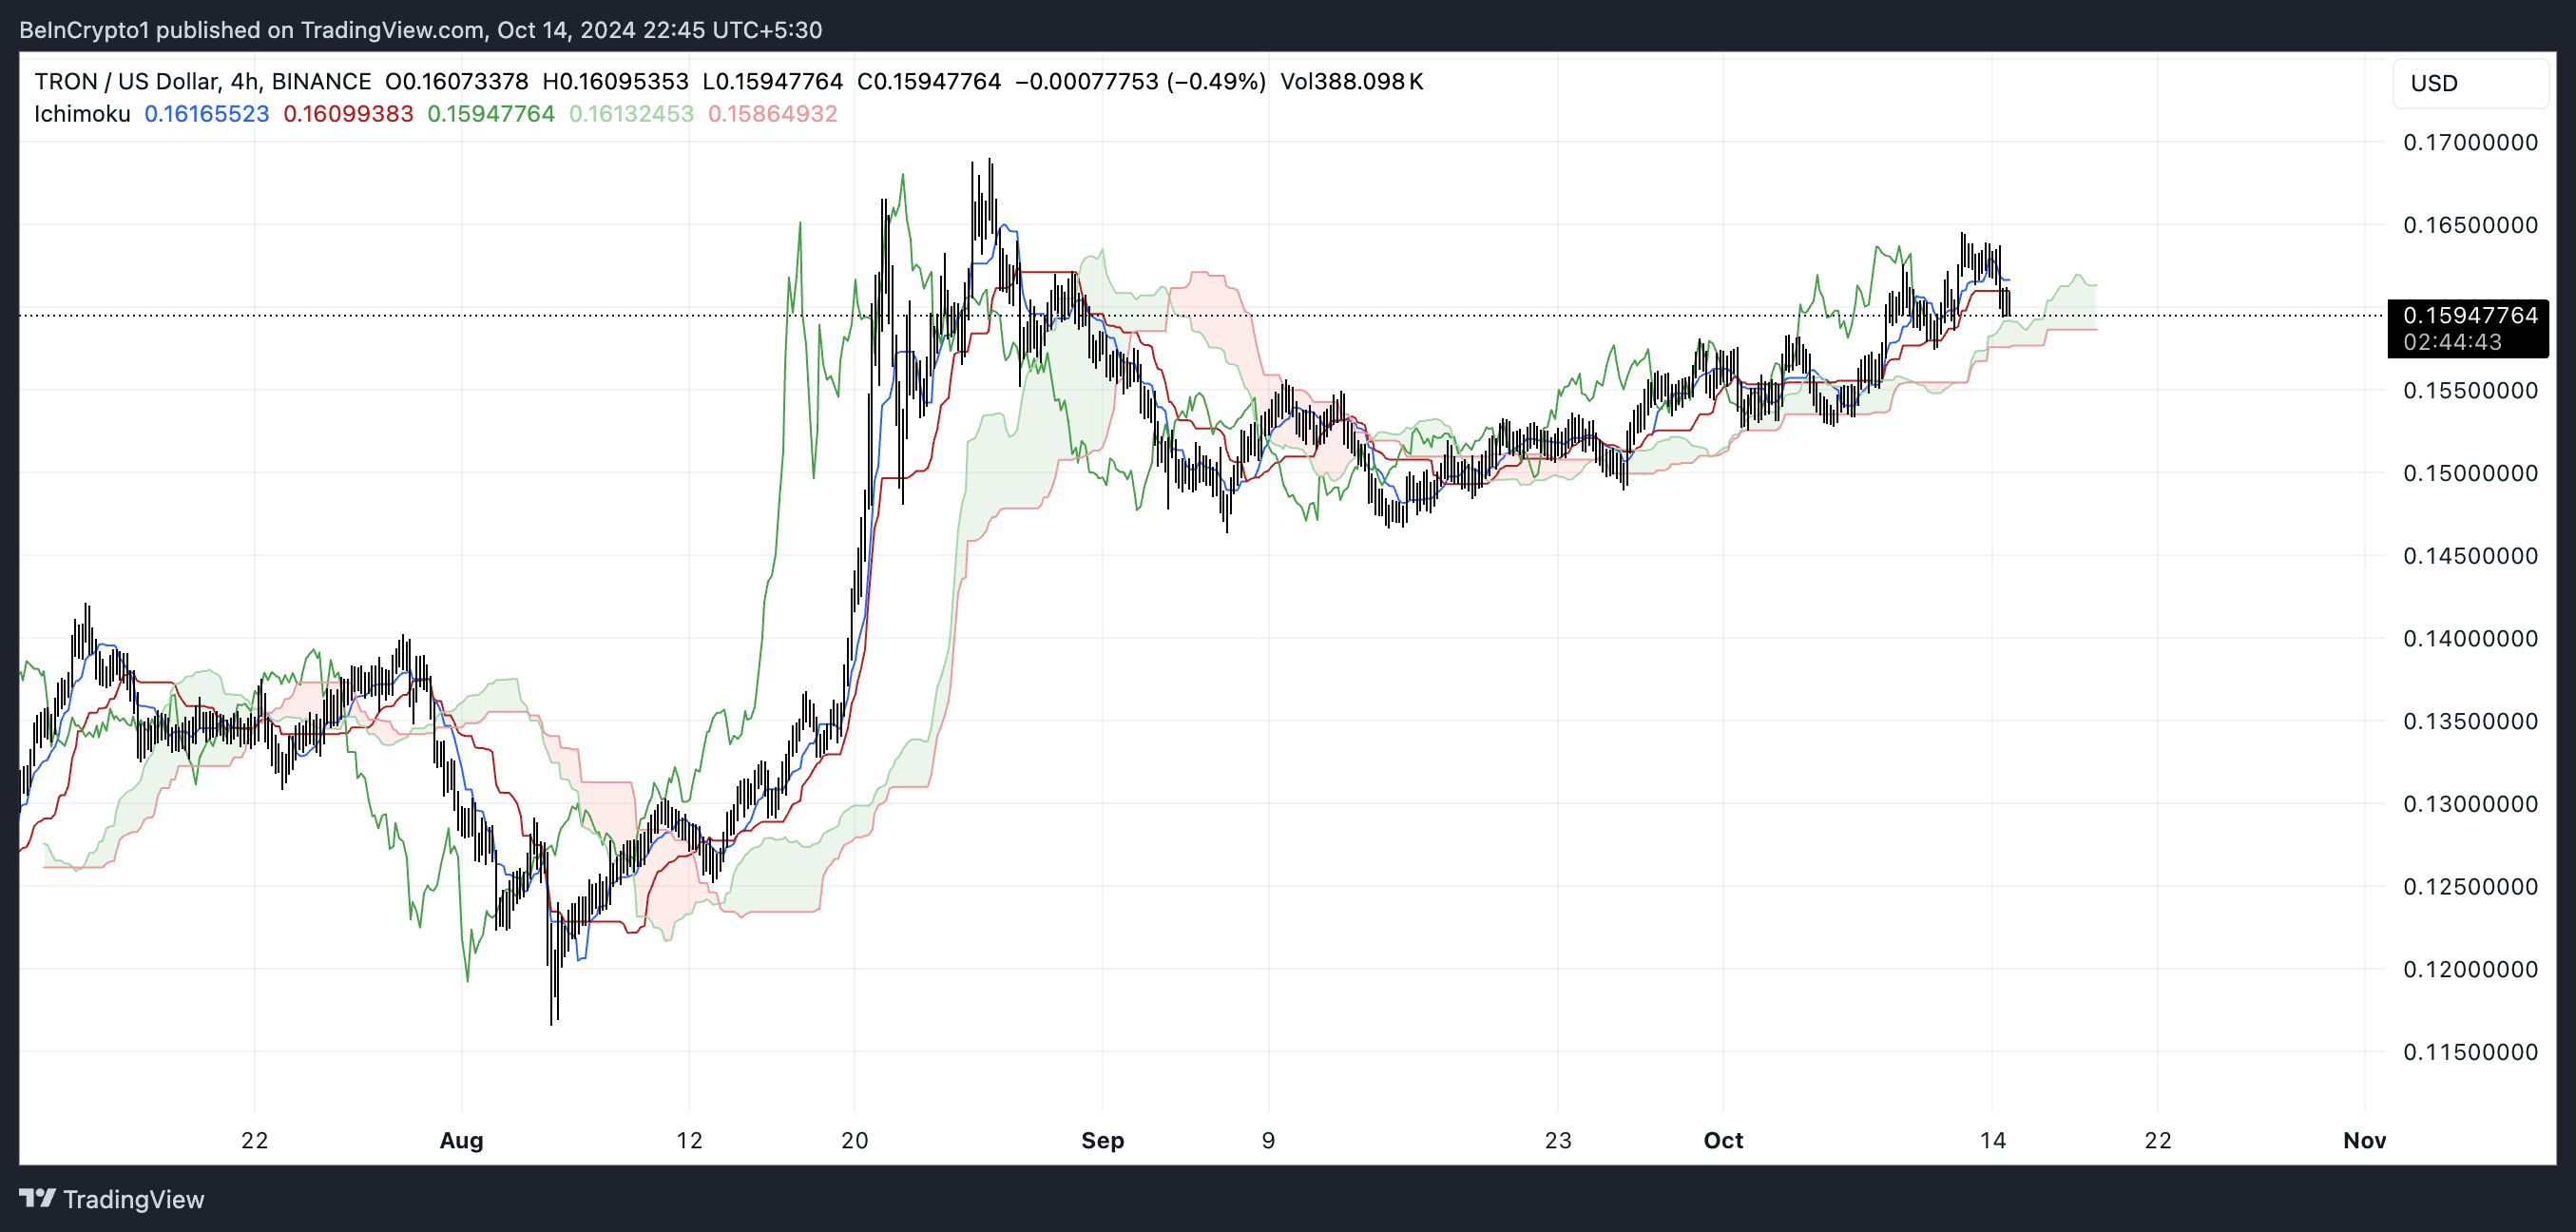
The lagging line (green lagging line) is positioned above the 26-period price level, further confirming that the current TRON (TRX) trend is supported by positive momentum. However, as the lagging line approaches the current price level, the sustained upward momentum may face challenges and could enter a corrective phase.
While the overall outlook for TRON (TRX) remains positive, this asset is at a critical juncture, requiring a breakout above resistance or strong support to maintain its upward trajectory.
The DMI suggests a moderate trend strength
The Directional Movement Index (DMI) for TRON (TRX) provides important insights into the current trend strength. The yellow line representing the Average Directional Index (ADX) is currently at 23.8, indicating a moderate but not particularly strong trend strength.
The blue line (+DI), which measures the strength of positive price movements, is at 11.3, suggesting relatively weak buying pressure at the moment. Meanwhile, the red line (-DI), which measures the strength of negative price movements, is slightly higher at 13.3, indicating that selling pressure slightly exceeds buying pressure.
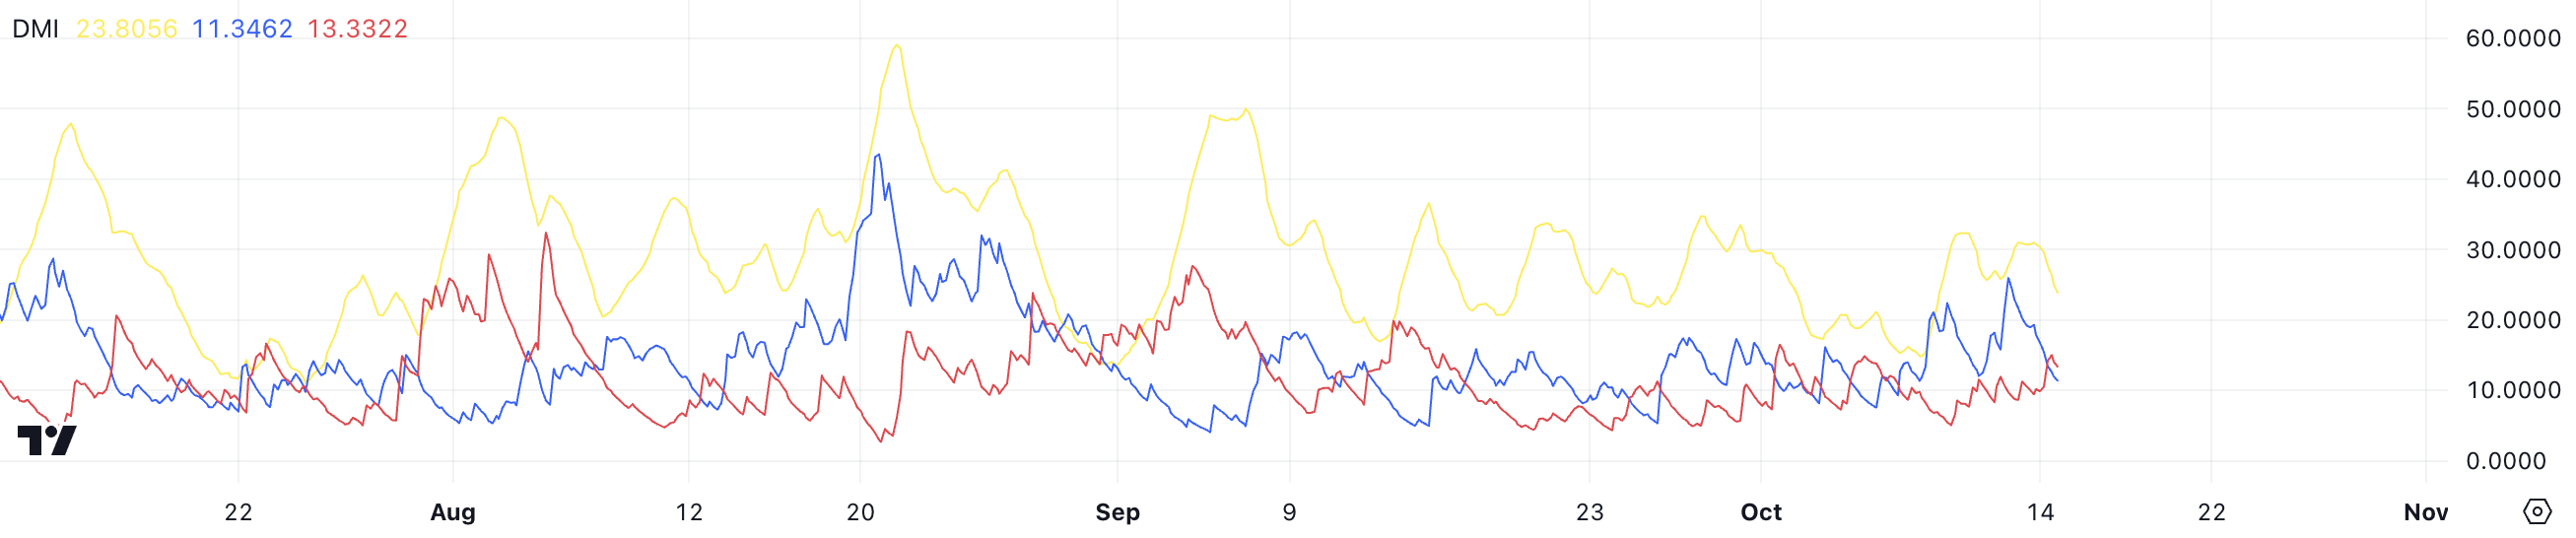
The ADX, which has fluctuated considerably in the past few months, suggests that TRON (TRX)'s trend strength has experienced a period of high volatility, followed by a more subdued phase. With both +DI and -DI lines below 20, it indicates a lack of significant momentum in either the bullish or bearish direction, hinting at a range-bound or corrective period.
For TRON (TRX) to regain a more definitive upward trajectory, the +DI would need to cross above the -DI, and the ADX value would need to increase above 25, signaling a strengthening trend. Overall, the DMI paints a slightly bearish picture, but there is potential for a reversal if buying pressure and trend strength improve.
TRX Price Prediction: Potential for Trend Reversal
The EMA (Exponential Moving Average) lines for TRON (TRX) are currently showing an upward pattern, with the short-term EMA positioned above the long-term EMA. This setup generally indicates positive momentum and the continuation of an upward trend.
However, the short-term EMA line has started to turn downward. This could suggest a potential reversal of the current trend. If this downward trend in the short-term EMA continues, it may indicate a weakening of buying pressure and a transition to a more bearish phase.
Exponential Moving Averages (EMA) are a type of moving average that gives more weight to recent data, making them more responsive to recent price changes compared to Simple Moving Averages (SMA). The short-term EMA line reflects the recent price action, while the long-term EMA line provides a broader perspective on the overall trend.
Read more: TRON (TRX) Price Prediction 2024/2025/2030
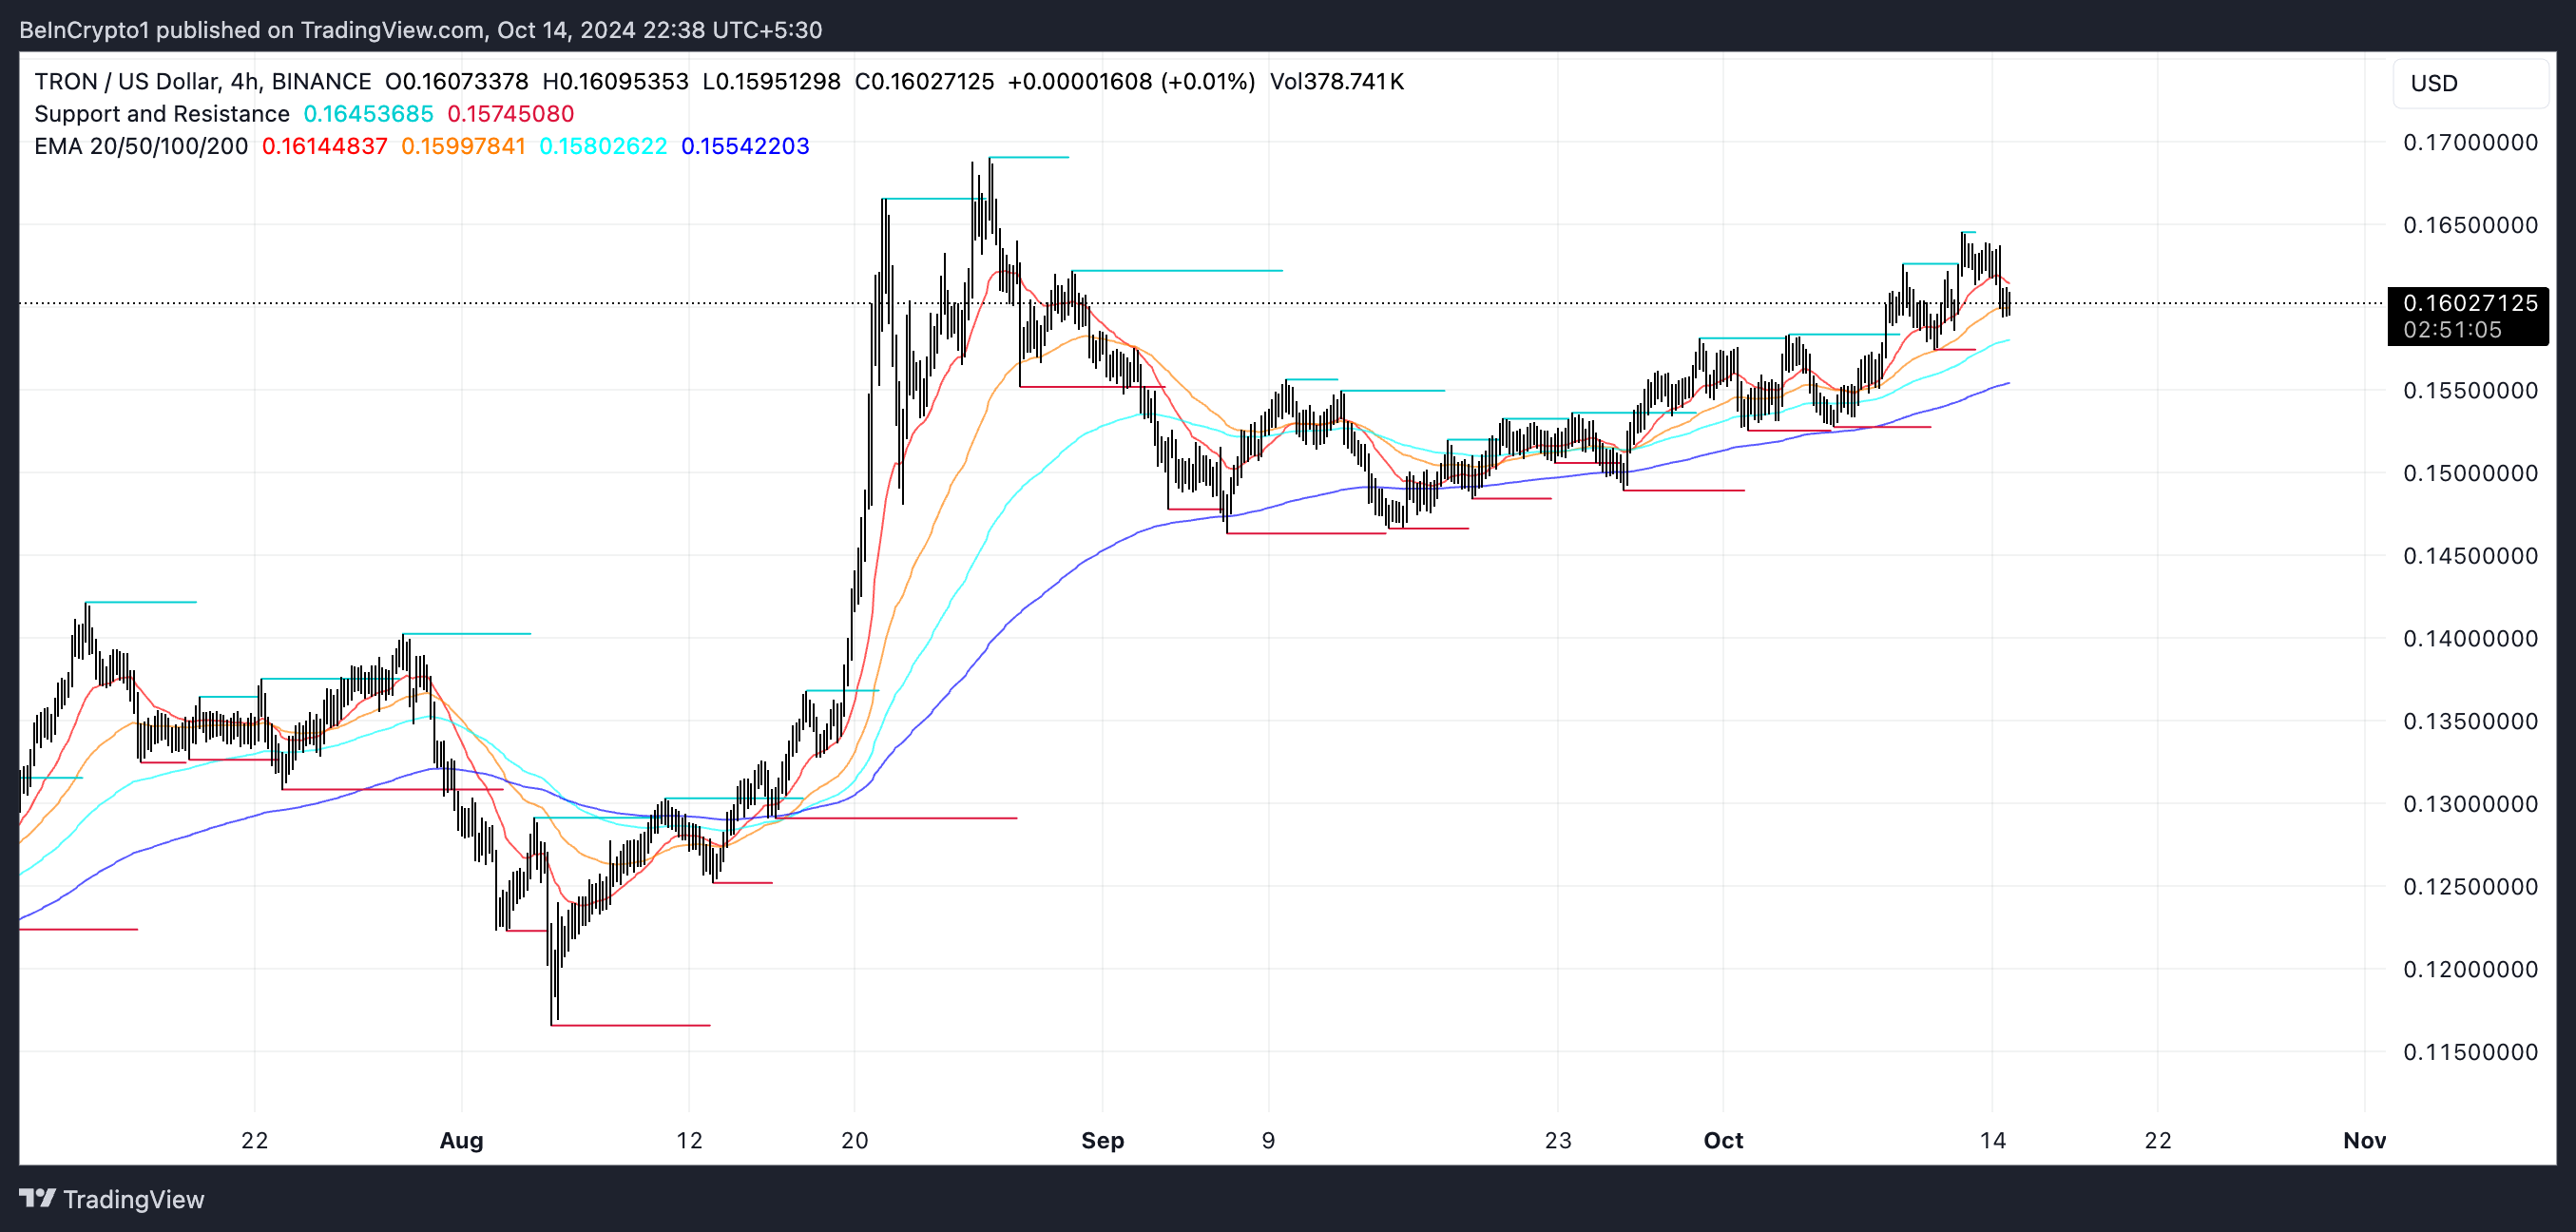
If the upward trend continues, TRON (TRX) is expected to test the next resistance level at $0.166 and potentially $0.169, with the possibility of further upside if buying pressure strengthens.
However, if the trend reverses based on the recent EMA movements, TRON (TRX) may test the support levels at $0.155, $0.152, or $0.1462. These support zones can play a crucial role in determining whether the bearish momentum intensifies or if a rebound is possible.


