Author: Delphi Digital; Translated by: 0xxz@ Jinse Finance
introduction
In 2024, the on-chain economy has grown significantly, with daily transaction volume increasing by more than 50% year-to-date, and total on-chain value locked (TVL) increasing by 70%, with the total TVL of major networks exceeding $70 billion. These major networks include Bitcoin, Ethereum, Solana, Arbitrum, Avax, Base, Binance Smart Chain, Cosmos, Optimism, Polygon, Sei, and Sui. The World Economic Forum predicts that by 2027, 10% of global GDP will be on-chain, and this prediction is further confirmed by reports from the IMF and World Bank on the global shift to digital infrastructure.
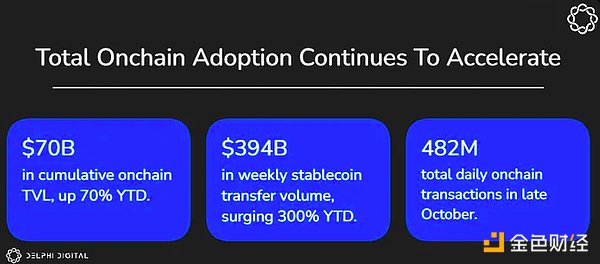
This report delves into the recent growth of the on-chain economy through October 2024 and analyzes several use cases behind this growth, including stablecoins, L2, collectibles, social media, gaming, DeFi, and institutional adoption. Overall, the data is clear: the on-chain economy is growing rapidly.
This report also takes a deep dive into the recent developments of Base, an Ethereum L2 incubated by Coinbase that has seen significant growth since its mainnet launch on August 9, 2023.
“Base is a secure, low-cost, developer-friendly Ethereum L2 that aims to bring an on-chain application ecosystem to a billion users and a million on-chain developers. ”
In the approximately 1 year since Base was launched, it has positioned itself at the forefront of the L2 space. During this time, the Base team has contributed to multiple on-chain advancements: reducing Rollup transaction fees to less than 10 cents through EIP-4844, creating smart wallets to simplify account abstraction, contributing to the superchain stack, and more. Since the beginning of January, daily transactions on Base have increased by 1,600%, from 372,000 transactions to more than 6.63 million transactions in October. In many of the metrics analyzed, Base has grown faster relative to the entire on-chain economy (such as TVL, active addresses, and transactions).
The growth of the on-chain economy is not limited to financial speculation. 66% of all active on-chain applications are non-DeFi, such as games, social networking, and digital collectibles. DeFi applications account for 33% of on-chain applications on major networks.
The on-chain economy will accelerate in the coming months and years as new use cases emerge and developers and users continue to move on to blockchain.
Overall Overview of the Chain Economy
On-chain metrics
Total TVL on the chain
Total value locked (TVL) is a metric used to assess the amount of capital allocated to a particular network’s smart contracts. Year to date, the cumulative TVL across networks has increased 70% from $41 billion to over $70 billion. As of November 19, TVL grew 110% to $87.9 billion.
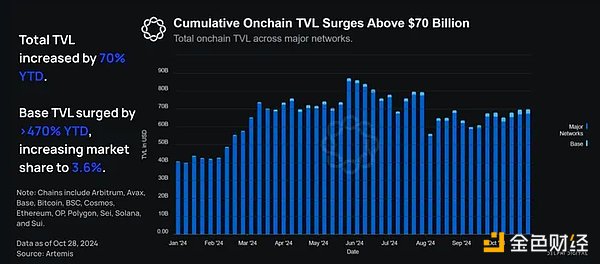 As the total TVL on the chain surged, Base's growth was particularly prominent. Base's on-chain TVL increased by 470% from $439 million in January 2024 to $2.51 billion at the end of October 2024. As a result, Base's market share rose from 1.07% of the total on-chain TVL to 3.59%.
It’s worth noting that while on-chain growth was driven by Base, this was primarily reflected in active addresses and stablecoin transaction volume. This is because on-chain TVL on Base is still relatively low compared to other major networks - reflecting the greater mix of non-monetary use cases on Base.
This significant uptick stems from increased usage of Base generally, and more specifically, from the rise in popularity of Aerodrome, which now accounts for over 40% of Base’s TVL.
Total number of active addresses on the chain
Year-to-date, the total number of weekly on-chain active addresses has increased 210% from 19.3 million to approximately 60 million. As of November 19, weekly active addresses grew 240% to 65.6 million.
Note: As a reminder, active addresses refer to addresses that actively interact with the project's revenue-generating smart contracts in a given period of time. Active addresses are not equivalent to weekly active users, as users may create and operate multiple wallet addresses.
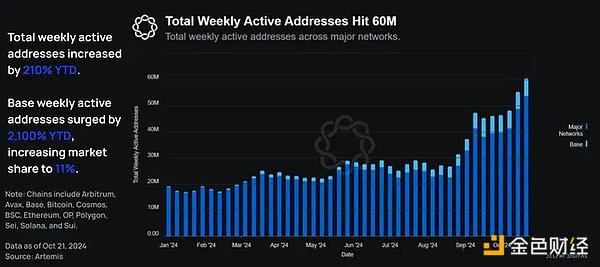 At the same time, Base’s weekly active addresses increased by 2,100% from 300,000 in January to 6.61 million at the end of October. This increased Base’s market share of the total weekly active addresses on the chain from 1.6% to 11% .
Note: Daily new addresses are newly created interactive addresses in a 24- hour rolling period that interact with smart contracts that generate revenue. These addresses did not previously represent any on-chain activity on the network.
Year-to-date, the total number of new daily active addresses has increased 879% from 710,000 to 6.95 million.
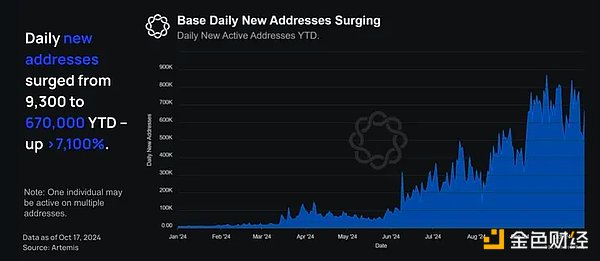
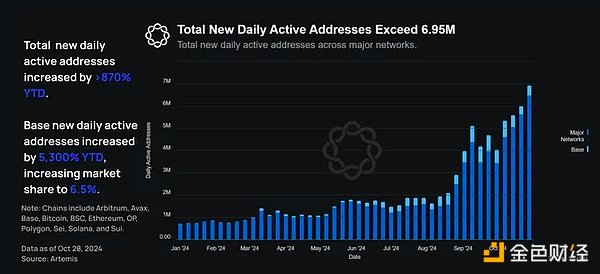 During the same period, Base’s daily new active addresses increased by 5,300% from 8,320 at the beginning of the year to 450,000 at the end of October. This increased Base’s market share from 1.2% to 6.5%.
Total number of on-chain transactions
The number of trades is quantified by assessing the number of trades conducted within a given time frame.
Year-to-date, the cumulative number of transactions per week has increased by more than 50% from 315 million at the beginning of the year to 482 million. As of November 19, the number of on-chain transactions per week has increased by more than 60% year-to-date to 531 million.
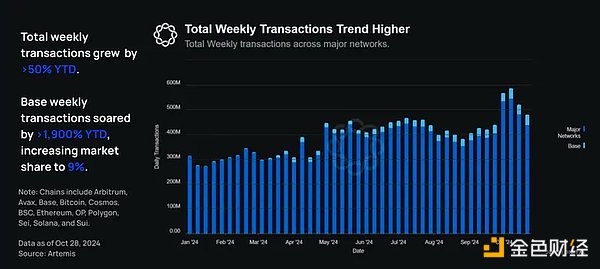 During the same period, Base’s daily transaction volume increased by more than 1,900% from 2.1 million at the beginning of the year to 42.34 million at the end of October. This increased Base’s market share from 0.67% to 9%.
Base’s massive daily transaction volume growth suggests the network’s popularity and affordability are rising, but the broader trend also highlights how Base’s success can enable other networks to succeed alongside it (e.g., other networks in the hyperscale blockchain).
Deduplicated stablecoin total amount
A key area of growth in the on-chain economy is stablecoins, which enable on-chain assets to flow seamlessly around the world at a fraction of the cost of traditional finance. Year-to-date, deduplicated total weekly on-chain stablecoin trading volume has increased from $89.7 billion to $249 billion, an increase of more than 177%.
As of November 11, weekly stablecoin transfer volume was 302 billion, an increase of more than 235% year-to-date.
Note: Deduplicated stablecoin volume is quantified by evaluating the cumulative sum of stablecoin transfer value while removing duplicates. Removing duplicates is critical to analyzing accurate volume numbers. Duplicates are transfers that are considered non-economic activity, such as CEX transfers, bot activity, wash trading, and non-payment wallet transfers.
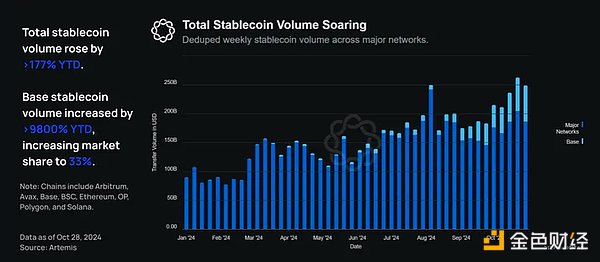 Stablecoin growth on Base is also accelerating rapidly: during the same time period, Base’s weekly cumulative stablecoin trading volume grew from $620 million in early January to $62 billion at the end of October, an increase of more than 9,800%. This increased Base’s market share from 0.7% to 33% , a 47-fold increase.
As of November 11, Base’s weekly stablecoin cumulative trading volume increased by more than 8,800% from $620 million in early January to $55 billion in November. This increased Base’s market share from 0.7% to 18%.
The increase in Base stablecoin transaction volume reflects Base’s efforts to increase network capacity while reducing costs. As a result, Base can use stablecoins as a universal medium of exchange to process large-scale payments between consumers and merchants.
Institutional adoption
Institutional adoption of on-chain public permissionless networks is critical to the long-term success of the broader crypto ecosystem and is currently in its early stages. Bitcoin and Ethereum spot ETFs were approved in January and June 2024, respectively, but have already seen mass adoption - with a total net flow of over $24 billion . While we expect the ETF trend to grow significantly from now, this is just Web2 wrapped Web3 products. Tokenization, which can be thought of as moving traditional web2 assets natively on-chain, is the future of institutions and is receiving a lot of attention from governments and the private sector around the world. In order to access all of web3, institutions need scalable, secure, and properly permissioned market infrastructure.
Total RWA Value
Real World Assets (RWA) are digital tokens that represent physical assets or financial instruments on the blockchain. This includes real estate, art, and commodities, among others. Tokenizing RWA on-chain allows for fractional ownership and opens up new possibilities for trading, investment, and ownership. The growth of RWA is a key driver of on-chain economic growth.
There are a number of different metrics that can be evaluated to determine the growth of institutional adoption. Currently, the best metric to measure is total RWA growth, as it describes the actual capital on-chain.
The total value of RWAs across the network (excluding private credit and stablecoins) is $3.92 billion, of which tokenized Treasuries account for 62%.
Year to date, the value of total risk-weighted assets has risen by more than 50%, from $8.3 billion to $13.25 billion.
Ethereum received over $3 billion in RWAs.
Data from RWA.xyz shows that RWA is seeing impressive growth and will continue to grow as more institutions join the chain.
Tokenized value growth by category
With the successful approval of the Bitcoin spot ETF, institutional focus has shifted to the tokenization of RWAs.
A famous quote from Larry Fink, BlackRock CEO and founder, sums up institutional sentiment well:
“ETFs are the first step in the technological revolution of financial markets. The second step is the tokenization of all financial assets . ”
There is a big push to tokenize financial assets so that they can benefit from the unrestricted on-chain economy, as seen by major traditional financial institutions such as BlackRock and Franklin Templeton, which have begun issuing RWAs on-chain.
Currently, tokenized treasuries account for the majority of RWAs issued, with commodities coming in second:
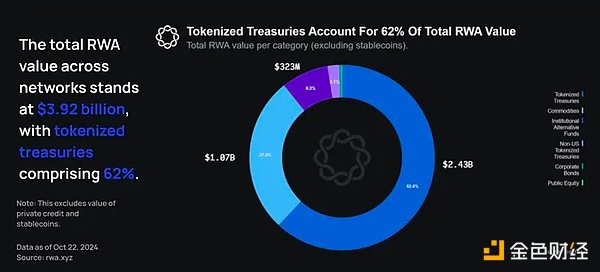 As of November 19, the total value of RWAs across all blockchain networks (excluding private credit) was $3.92 billion, of which tokenized Treasuries accounted for 62%.
The growth of tokenized treasuries has mainly occurred on Ethereum L1, with over $1.5 billion. Only $4.5 million of tokenized treasuries have been issued on Base, but the space is ripe for growth. As the network matures and further decentralizes by achieving the next stage (the stage is the level of decentralization), Base will be ready for an influx of on-chain assets.
On-chain developers
On-chain developers are an important part of the on-chain ecosystem - an active developer ecosystem facilitates the creation of innovative applications that can attract users to the network and retain them.
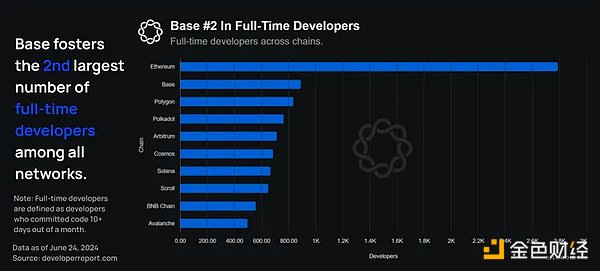
Typically, the number of full-time developers on each chain is considered the most important indicator of developer activity. As of the latest developer report on June 24, Base ranked second with more than 900 active full-time developers, second only to Ethereum (about 2,800).
Note: Full-time developers are defined as developers who submit code 10 days or more per month.
On-chain NFT transaction volume
NFT trading volume is quantified by calculating the sum of NFT trading volumes within a given time frame. Year-to-date, weekly cumulative NFT trading volume has dropped from 309 million to 59 million, a drop of about 80%.
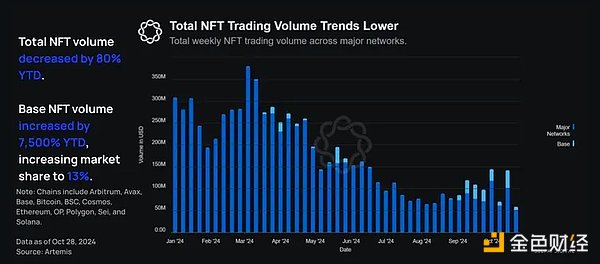 During the same time period, Base's cumulative NFT trading volume increased from approximately 100,000 in early January to 7.66 million, an increase of more than 7,500%. This increased Base's market share from 0.003% to 13%. The growth of NFTs on Base is mainly driven by the promotion of free or low-cost NFTs, rather than speculative NFT trading activities, which shows that the focus of the NFT market has shifted in recent years.
While NFT trading volumes across major networks have been trending downward due to market conditions and many high-profile NFTs dropping in value by around 80%, NFT trading volumes on Base have risen significantly. This is primarily because Base NFTs were virtually non-existent at the beginning of the year, and now their trading volumes are more in line with the overall NFT market.
Digging Deeper into Base
Overall, Base has achieved accelerated growth as the entire on-chain space continues to grow. More importantly, Base's market share in all analyzed metrics has increased several times so far this year , demonstrating Base's clear relative strength and outperformance in economic growth and user adoption.
For example:
Since the beginning of January, the number of daily transactions has increased by 1,600%, from 372,000 to more than 6.63 million in October.
Total daily trading volume has increased by more than 50% so far this year.
Weekly active addresses have increased by more than 2,100% year to date.
The total locked value has increased by more than 70% year-to-date.
This also proves the efforts made by Base and other development teams to build beneficial applications and networks and promote the growth of the entire on-chain economy.
While Base is growing faster than other networks on all of the metrics below, it’s worth noting that most major networks have seen usage rise so far this year, suggesting that the concerted effort to bring people on-chain is benefiting all networks.
Base user activity increases year-to-date
Data from January 2024 to October 2024 tells a unique story: Base adoption is surging.
Weekly active addresses and transaction volume on Base have steadily increased, growing by more than 2,100% and 1,600% respectively from January to October 2024. The impressive progress shows that Base is effectively attracting users and expanding on-chain adoption around the world.
It is important to note that weekly active addresses are not equivalent to weekly active users, as users may create and operate multiple wallet addresses, meaning the correspondence is not 1:1. Nevertheless, it is still a useful metric for assessing the overall activity level of the chain, especially when screening for addresses that interact with revenue-generating smart contracts, as is done in this report.
In 2024, weekly active addresses on Base surged from 300,000 in January to 6.61 million at the end of October, and reached an all-time high of 7.19 million on September 16. This growth means a year-to-date increase of more than 2,100%.
Note: Base weekly active addresses refer to the number of unique addresses that have interacted with revenue-generating smart contracts deployed on Base . One person may be active on multiple addresses.
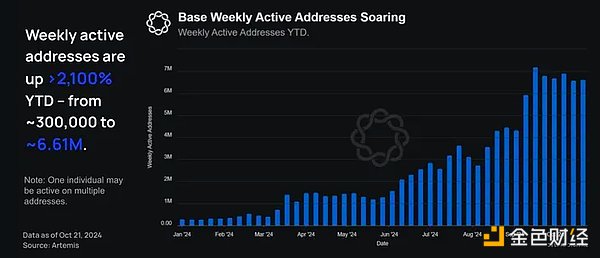
As of November 19, Base’s weekly active addresses increased by 2,000% to over 6.5 million.
These initiatives have successfully fostered a growing ecosystem. Coupled with the significant reduction in transaction fees following EIP-4844 (typical fees are now less than 1 cent), Base has become a very attractive chain to interact with, both from a user and developer perspective.
Year-to-date, Base’s daily new addresses have grown from 9,300 in January to 670,000 by the end of October, hitting an all-time high of 867,700 on September 20. This growth marks an increase of more than 7,100% since the beginning of the year.
Note: Base’s daily new addresses refer to the number of new addresses that interact with revenue-generating smart contracts deployed on Base for the first time (it does not represent any previous on-chain activity on Base ).
 Meanwhile, Base’s daily return addresses increased from 59,000 in January to over 1 million in October, peaking at 1.23 million on October 3. This represents a year-to-date increase of over 1,600%, a strong indication that user retention remains strong despite the surge in activity.
Note: Base daily return addresses refer to the number of interaction addresses that have previously interacted with the revenue-generating smart contracts deployed on Base .
 One example of driving on-chain activity on Base is the Onchain Summer program, which aims to celebrate and showcase on-chain innovations - including music, art, food, and games. The program encourages participation by showcasing compelling on-chain projects in the Base ecosystem. This effort helps bring users to the chain, as evidenced by the surge in on-chain activity.
Another factor supporting Base’s success is diverse marketing campaigns that reach a wide target audience, such as placing ads on Liquid Death boxes to promote on-chain activities.
Additionally, Coinbase launched cbBTC, a wrapped Bitcoin token, on Base. By prioritizing the adoption of cbBTC on Base, they helped solidify Base’s position as the leading ecosystem for the most secure on-chain wrapped Bitcoin.
Initiatives like cbBTC and Onchain Summer have helped bring the masses on-chain. Once they are here, they are here to stay, as indicated by the returning active addresses.
Fee reduction drives growth in Base transactions
Not surprisingly, as active addresses increased, daily on-chain transaction volume also surged.
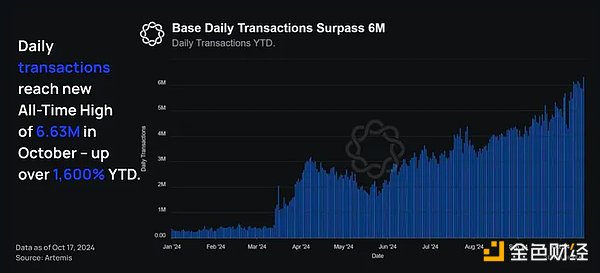 As of November 19 , the number of daily transactions increased by 1,900% to more than 7.7 million.
In particular, the number of daily transactions has increased by 1,600% since the beginning of January, from 372,000 to more than 6.63 million in October. Both active addresses and transaction volume show similar trends, proving that the Base economy is becoming an on-chain hub in the Rollup space.
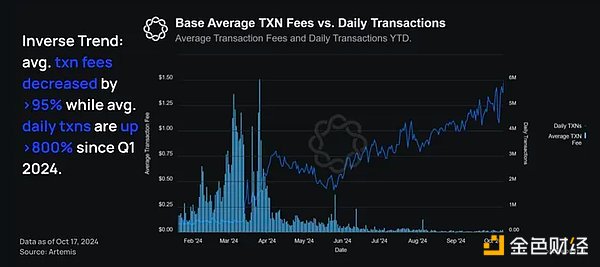
In contrast to web2 dynamics, the cost of doing business on Base has fallen even as demand has soared. The average transaction fee on Base has dropped by more than 95% from $0.44 in the first quarter to $0.019 on October 17. While this is partly due to EIP-4844, Base’s ongoing scaling work (such as increasing gas limits) has played a major role in reducing costs.
Specifically, year to date, average transaction fees have fallen by more than 95% , while average daily transaction volume has surged 800% , from 615,000 in the first quarter to 5.6 million in October. These low fees make on-chain technology more accessible and encourage more developers and users to join the chain.
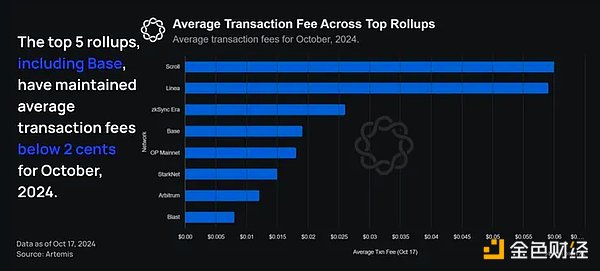 On the other hand, Base is currently the largest gas consumer in rollups using blobs, consistently processing > 50 transactions per second and consuming > 13 mgas/s.
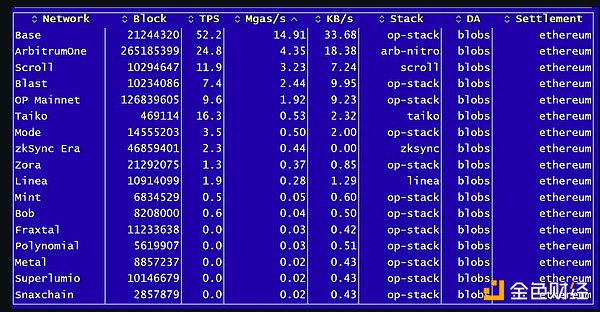
Base submitted over 29% of all blobs, indicating a huge demand for Base block space as a result of the explosive growth of the Base chain.
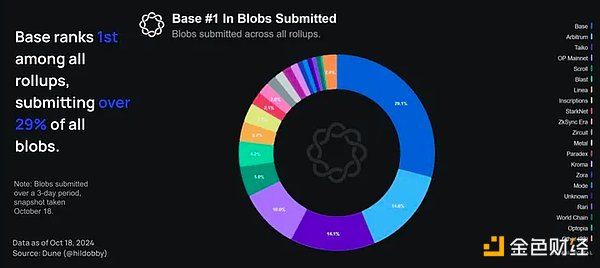 However, this may cause problems in the future. If the maximum number of blobs is not increased in future upgrades, the current cap may hinder the growth of Base.
Year-to-date growth in underlying economic value and total locked value
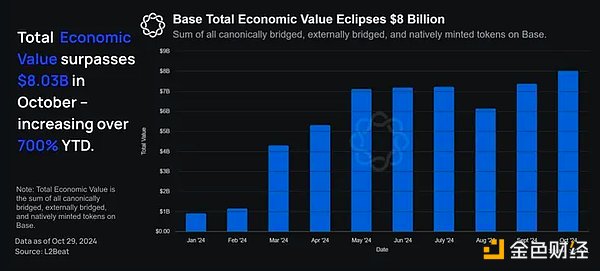
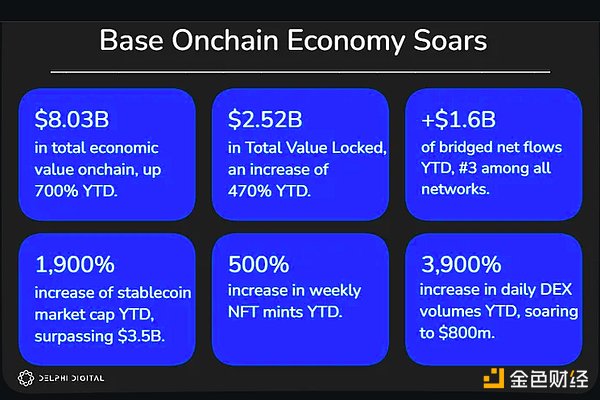 Year-to-date, Base’s total economic value has risen 792% from $0.9 billion in January to $8.03 billion at the end of October. This figure makes Base the second-largest L2 by this metric, behind only Arbitrum.
Note: Total economic value refers to the sum of all canonical bridges, external bridges, and locally minted tokens
 Notably, this growth is unparalleled and is the fastest rate the network has ever accumulated to over $8 billion in total economic value (in just 16 months!). We expect this economic value chart to maintain its trend as significant inflows are expected to continue in the coming years.
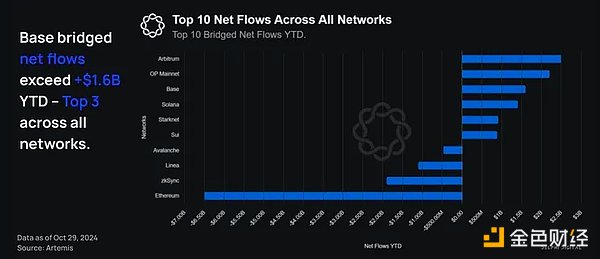
Additionally, Base ranks third in terms of net flows (nominal flows, not %), with $1.6 billion in net flows across all networks year to date, compared to $6.5 billion in net outflows from Ethereum. It must be acknowledged that most of the outflows experienced by Ethereum are primarily capital migrations to rollups, suggesting that capital flows are primarily staying within the EVM ecosystem, rather than out of it.
 So far this year, the TVL of the Base protocol has risen 470% from $439 million in January to $2.52 billion at the end of October. As of November 8, Base's TVL has exceeded $2.77 billion, making it the leading L2 in terms of total locked value.
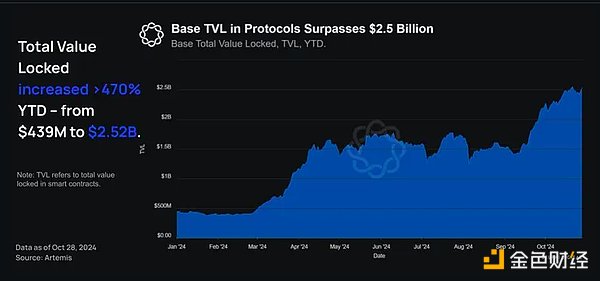 The ratio to monitor is TVL/Total Economic Value, as a healthy ecosystem will have both metrics growing at similar rates.
By directly comparing each metric, we can gain more insight into the overall distribution of on-chain activity. The similarity between TVL and Total Economic Value suggests that most capital is locked in protocols and smart contracts, which indicates active DeFi activity. On the other hand, if Total Economic Value significantly exceeds TVL, it indicates that on-chain activity extends beyond DeFi, highlighting a more diverse distribution - this is the case with Base.
The increasing market value of stablecoins on Base
According to all of the above metrics and many others, Base is the fastest growing L2.
Another interesting way to quantify the “success” of a network is to track the overall market capitalization of stablecoins on the network.
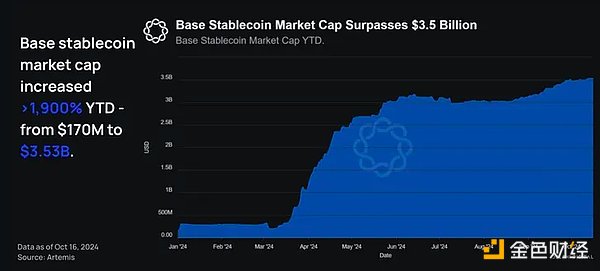 Year-to-date, the market capitalization of stablecoins on Base has risen by more than 1,900% from $170 million in January to $3.53 billion at the end of October. This represents a significant increase in both notional value and percentage.
As of November 19, the market capitalization of stablecoins on Base was $3.3 billion (up more than 1,800% from $170 million in January), while the market capitalization of all network stablecoins was $186 billion (up 38% from $134 billion in January).
Notably, this percentage increase exceeds the increase in economic value over the same period, indicating that the Base ecosystem is not only growing, but also beginning to mature.
Base chain application ecosystem
Multiple use cases beyond DeFi
With the rapid growth of users and transaction volume, the number of projects launched on Base has also been steadily increasing. A thriving ecosystem is a sign of a healthy network, which is clearly due to Base's commitment to providing an unparalleled developer experience. As of October 17, 2024, there are 85 active applications on Base and more than 100 daily active wallets.
Over 60% of on-chain applications on Base are not DeFi related: gaming applications account for 20%, collectibles account for 18.8%, social applications account for 15.3%, and “other” accounts for 5.9%.
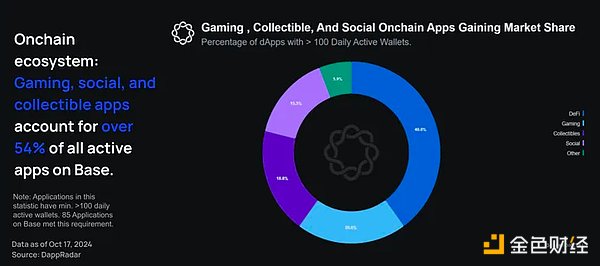
As shown above, while DeFi applications lead as a single category, areas such as games and collectibles also have high usage, accounting for more than 54% of all active applications on Base.
The diversity of on-chain applications shows that Base is more than just a DeFi hub. It is a space where all types of on-chain applications can flourish and form a real economy. This is further supported by the growth of applications such as FrenPet, which focus on gameplay rather than monetary gain.
The diversity of applications on Base is roughly similar to the cumulative application diversity of the major networks supported by DappRadar.
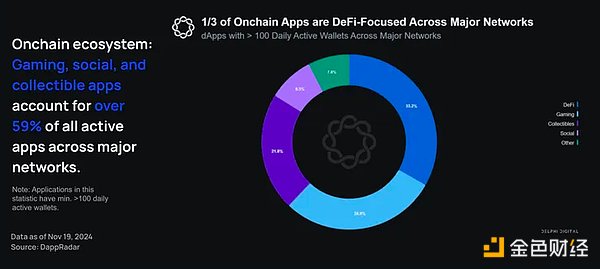 These practical functions provided by dApps show that users are beginning to accept all types of on-chain applications. This is a healthy sign for the on-chain ecosystem, which is increasing in diversity beyond currency-centric applications.
Supports ease of use and cost-effectiveness
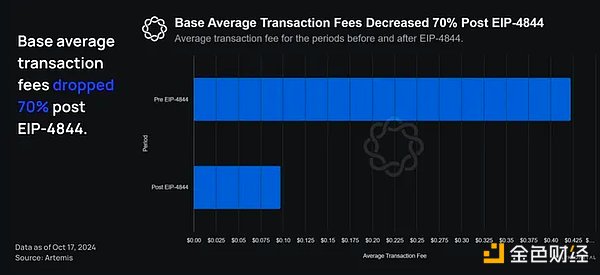
Dividing the year into two periods, post-EIP-4844 and pre-EIP-4844, users’ average transaction fees dropped 70% to $0.097 from $0.422 post-EIP-4844.
As mentioned earlier, after the implementation of EIP-4844, transaction fees on Base dropped by 70%, which drove rapid growth in transaction volume. Continued improvements in cost efficiency will unlock significant expansion of on-chain use cases and help attract new users to the chain.
 As transaction costs decrease, it becomes more feasible for on-chain applications to completely eliminate gas fees. By having the payer bear the minimum transaction fee, users do not need to consider paying gas fees with ETH.
However, Base isn’t the only L2 where users are seeing lower fees. Development work done by Base outside of its own rollup (particularly EIP-4844) benefits all rollups. The biggest advantage of cheap transactions is the ability for on-chain applications to provide gas fees through paymasters. By having applications pay their own transaction fees (the lowest cost per transaction), users don’t have to think about paying gas fees with ETH.
This simplifies the barrier to entry for new users. If full abstraction is indeed possible in the future — an on-chain user experience that is very similar to web2, streamlined to the point where users don’t know they are interacting with a blockchain — then applications will be able to absorb the cost of gas fees without a significant impact on their profitability.
As Base fees continue to drop and approach the cheapest, economically viable cost, the possibilities for on-chain exploration are nearly endless.
Coinbase Smart Wallet has seen increasing adoption since launch (June 2024)
Launched in June 2024, Coinbase Smart Wallet is an advanced wallet designed to optimize the user experience and simplify the onboarding process. No extensions/installation are required, passwords are used instead of complex seed phrase, and the wallet works with most major networks. Smart Wallet shortens the user's on-chain process to just a few seconds and a few clicks.
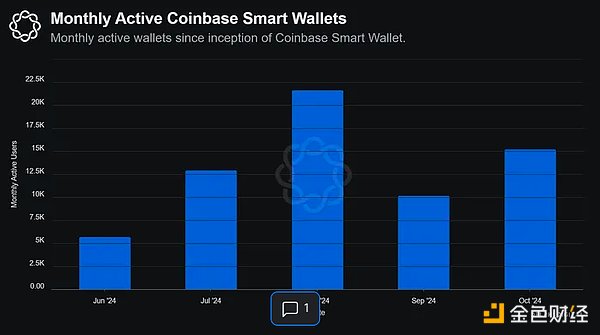
After hitting an all-time high of 21,660 monthly active wallets in August, Coinbase Smart Wallet has surged 168% since its launch in June — from 5,700 to 15,280.
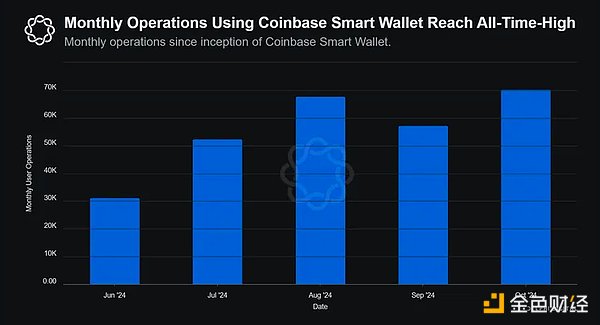
Additionally, the number of monthly wallet operations using Coinbase Smart Wallet surged 125% from 31,200 to 70,320, reaching an all-time high in October 2024.
Note: Data refers to on-chain interactions using Coinbase Smart Wallet.
Incentives for developers
There are four main factors that create a developer-friendly environment on Base:
Base is built as a standardized EVM, which means developers can write applications using Solidity, the most popular blockchain programming language.
Base is part of Superchain, a rollup network that uses the OP Stack, allowing Base to share security and communication layers with other rollups. As a result, Base is more attractive to developers due to the increased interoperability between Superchain rollups and the support it receives from other Superchain developers.
The Coinbase Developer Platform and Onchainkit provide ready-to-use components and tools to make development on Base easier.
Transactions are very cheap compared to other Rollups, and application fees are significantly lower than its Web2 competitors, fostering a large user base.
On-chain use cases surge
Projects are broken down by innovation and practicality
As Base's year-to-date activity continues to pour in, different areas have seen varying success.
Below is a summary of some of the standout protocols within each area and how they performed this year.
Social – Farcaster Frames
Launched in March, Farcaster Frames is a tool that allows interactive experiences to be embedded into Farcaster live casts.
Frames are easy to find, and Warpcast (the largest Farcaster client) has a subpage to view popular Frames . They are similar to Blinks on Solana and Slinks on Starknet, allowing tweets to embed interactive on-chain content.
Frames unlocks internal composability between clients, networks, and users. Many frames are built on Base, allowing for a variety of different on-chain interactions, such as minting NFTs in a feed, making on-chain payments, and playing games. These on-chain tasks can be completed with a single click on the frame.
They also create convenience between consumers and merchants, allowing for seamless transactions within the Farcaster client. This increases purchases as it reduces the number of steps required to complete a purchase.
Game – Frenpet
Frenpet is an idle game on Base that has quietly become a huge success over the past year. The app is built in the browser, with the creation process completely abstracted through Privy and the payment system.
The game has been growing steadily, with more than 2.25 million play times so far this year.
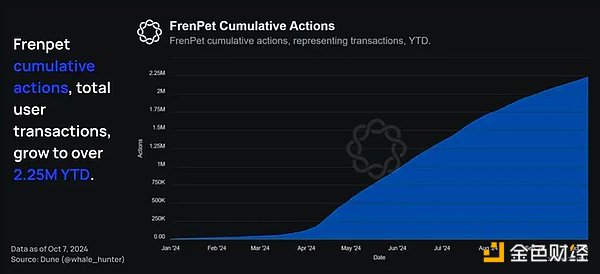
The gaming scene on Base is just getting started, and as Base continues to attract more users to its network, fun little games like Frenpet have a chance to start to gain popularity.
NFT/Digital Collectibles
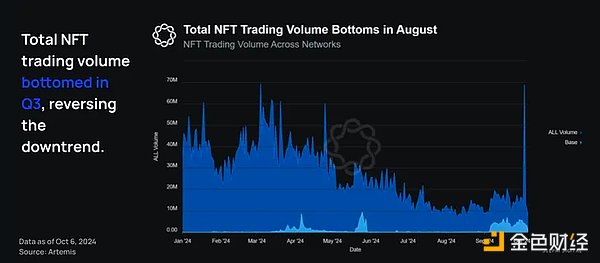
NFT transaction volume across networks, including Base, had been trending downward for most of the year but bottomed out (at least temporarily) in August.
We see an upward trend in volume through the end of Q1 2024. This excludes the outlier at the end of October, which returned to the mean the next day.
The NFT transaction volume on Base corresponds to peak activity in different periods and lacks consistency within the quarter. The most likely reason is that a specific NFT initiative temporarily pushed up NFT transaction volume.
Interestingly, year-to-date, weekly NFT minting on Base has increased by 5 million, from a peak of 17.12 million in the first week of June to 832,000 at the end of October. This metric shows a counter-trend to the increase in NFT activity.
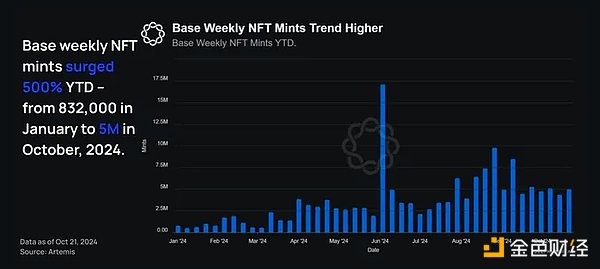
This figure has increased 500% so far this year, demonstrating that Base is becoming a hub for non-monetary use cases for NFTs.
Based on NFT activity on Base and other networks, NFT behavior appears to be shifting from trading/speculation to non-monetary use cases for NFTs. This is indicated by a 500% increase in weekly NFT minting on Base between January and October 2024, and a significant drop in NFT trading between March and October 2024.
Beyond art, the real value of NFTs, such as Bored Apes, lies in their ability to be tied to real-world utility. Examples of this real-world utility include NFTs representing coveted group memberships or real estate deeds.
Minting has been on an upward trend since Coinbase launched its Onchain Summer program, which encouraged participants to mint NFTs — often at little or no cost (via gas-free transactions). This suggests that Onchain Summer had a lasting impact on user engagement, as users remained active after the program ended.
DeFi on Base
Decentralized Finance (DeFi) provides financial products and services at an institutional scale, but without intermediaries that absorb value. With DeFi, value can be redistributed to participants. Like most networks, DeFi remains dominant on Base and takes advantage of transaction fees below a cent. The following sections cover four different embedded areas: DEX/derivatives, money markets, Telegram bots, and liquidity staking/ yield farming.
Trading Platform
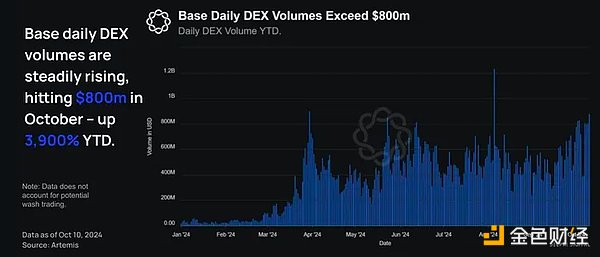
Base has become a significant area for spot asset trading, with daily trading volumes continuing to grow. Year-to-date, Base DEX trading volumes have grown 3,900% from $22 million in January to $880 million at the end of October 2024.
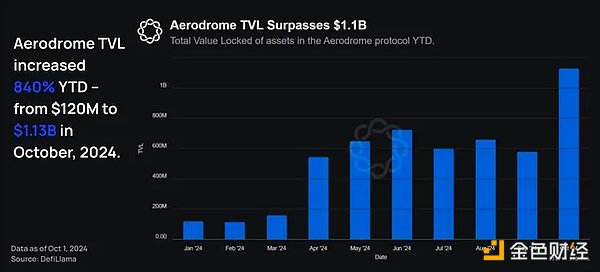
Combining these two metrics, Aerodrome is the clear winner. Aerodrome's total TVL has exceeded $1 billion, accounting for about 40% of Base's total TVL, and facilitates the highest on-chain transaction volume pools in ETH, BTC, USDC, and EURC. The protocol is a fork of velodrome, an automated market maker (AMM) inspired by Curve, which aims to serve as a liquidity center on Optimism.
Aerodrome plays the same role on Base and has been a huge success so far — accounting for the majority of DeFi transaction volume on Base (about 50-60%).
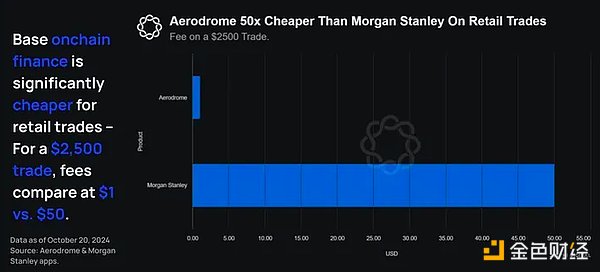
 Aerodrome is particularly attractive for financial transactions. Users can exchange USDC and EURC in 1-5 seconds for a fee of 0.05%, 24/7 with no delays and virtually no slippage. In contrast, traditional financial transfers can take 1-5 business days and cost 0.3% (Wise, on the low end, costs 6 times as much as Aerodrome) to 3% (Wells Fargo, costs 60 times as much as Aerodrome). In addition, international transactions on Aerodrome are available 24/7 and take only 1-5 seconds, while traditional financial transactions take 1-5 business days.
 Users like familiar structures so that they can truly benefit from the protocol. This is why in the early stages of most networks outside of Ethereum, Uniswap did not take up the majority of the market share, but native AMMs did.
Most alternative network native AMMs traditionally have complex user incentives that revolve around staking tokens to receive emissions or protocol fees. Once this happens, the flywheel starts and the native AMM attracts all liquidity. Uniswap typically fails to become a market leader immediately. This is reflected in several rollups: Base (Aerodrome), Optimism (Velodrome), and zkSync (Maverick).
An important note here: as rollups mature, this flywheel tends to break, and Uniswap liquidity on the network continues to grow, grabbing market share. Aerodrome’s incentive structure makes it the clear leader on Base in terms of TVL and trading volume, however, this may change as the rollup ecosystem matures.
Money Market
Three money markets account for the majority of Base’s market share: Morpho Blue ($220 million), Aave ($150 million), and Moonwell ($146 million). These numbers represent active deposits on the platform.
Morpho Blue is a trustless platform that houses immutable, independent lending markets. MetaMorpho allows third parties to provide their own custom vaults on Morpho Blue. Morpho Blue automatically handles structural force maintenance of market parameters to ensure that the market remains solvent.
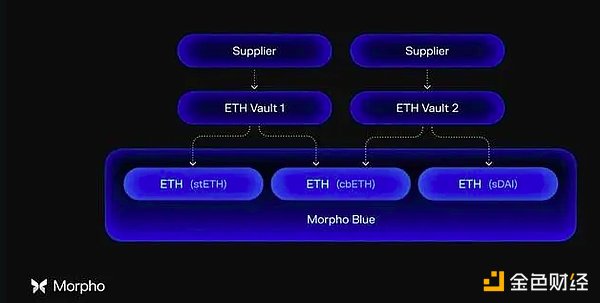
Isolated lending markets are very powerful because they isolate the risk of each collateral asset. This means that Morpho Blue can technically add "riskier" collateral (e.g. less liquid and more volatile assets like uSUI) and increase its income without the added external risk of "stronger" collateral (e.g. ETH) offered on the market. The downside of this is that borrowers cannot benefit from the large deposits in other vaults.
Aave, on the other hand, is a traditional DeFi lending market where all pools are tied together, allowing users to submit any collateral choice and borrow any enabled asset. Due to its resilience and long-standing reputation, Aave is the “de facto” lending market in most networks.
Moonwell offers users a combination of both. Moonwell is a fork of Aave that can take deposits using collateral of any acceptable asset. They also have core vaults, which are built on top of Morpho for more independent lending pools. The combined product lets users choose the infrastructure they want to use, governed by the Moonwell DAO.
Having three competitive lending markets on Base is a healthy sign of decentralization and competition, helping to promote innovation and choice for users. While many networks with Aave as the dominant money market have SPFs (single points of failure), this is not the case with Base because funds are dispersed across multiple protocols.
This is optimal for long-term growth, although it requires more total liquidity to reduce the effects of fragmentation. More choice and competition are good for users, and the growth of Base DeFi enables each lending market to build enough liquidity to meet the needs of almost all users. The continued growth of the ecosystem will benefit all lending markets and reduce the effects of liquidity fragmentation, which will benefit users.
Telegram bot
Driven by a sharp increase in on-chain transactions and a simplified user experience, Telegram bots have gained strong momentum on most networks, leading to a major shift in retail investor behavior this year .
The function of Telegram bots is to snipe and efficiently trade on-chain assets for users, which gives them an advantage over users who trade manually using self-custodial wallets. Most bots charge a fee of about 1% for transactions.
Using Telegram bots for on-chain asset transactions has significant user experience advantages. As a result, the adoption rate of Telegram bots continues to increase, with daily revenues exceeding $1 million.
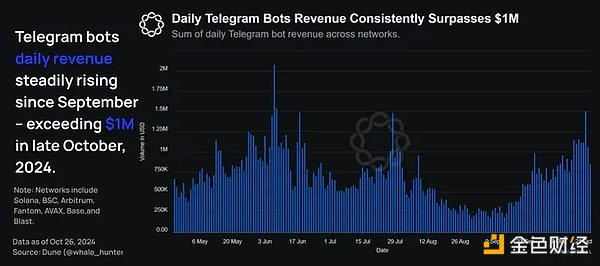 Contrary to other networks, the number of Telegram bots on Base is not high, indicating a lack of adoption.
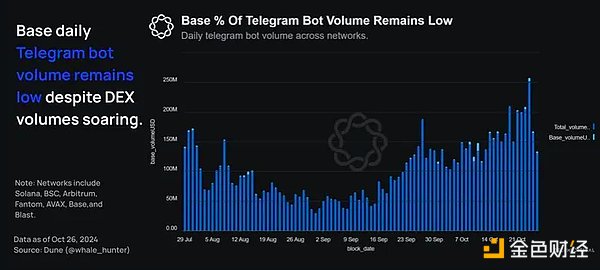 The low number of Telegram bots combined with the rising number of DEXs on Base seem to indicate that Base has attracted a large number of actual users and there is also activity migrating from other networks to Base.
Revenue Activities
Decentralized yield farming of cryptocurrencies is very popular. Since almost all cryptocurrencies are financialized in nature, tools to maximize yields without centralization risk are very attractive to many users, driving adoption.
However, Base is not a chain built for yield, but to build an on-chain global economy. Only a small portion of the assets on Base are actively leveraged yield activities, because most capital from institutions is risk-averse and they prefer to hold these assets or, in some cases, borrow from licensed participants.
The top yield platform at Base (provided by TVL) is Extra Finance, which offers a range of leveraged yield products.
They have amassed over $150M in TVL (which, while significant, is a small fraction of the $8B in assets on Base), and their user trading volume is near May 2024 highs — with daily transactions regularly exceeding 2,000.
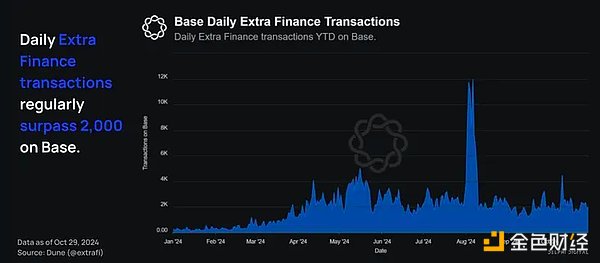 Extra’s leveraged yield design is a streamlined but smart design that maximizes the benefits for all participants. The process works according to the following structure:
Provide collateral -> borrow different assets from the lending pool -> automatically convert assets into equal proportions -> provide liquidity -> compound rewards
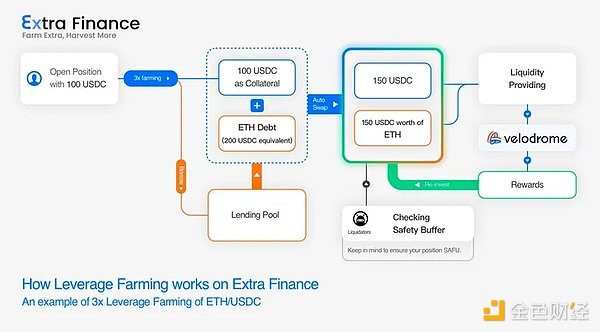
Users who do not want to take advantage of the yield can lend their assets into a pool to earn an interest rate, similar to any other lending market.
Weekly Base contracts deployed so far this year
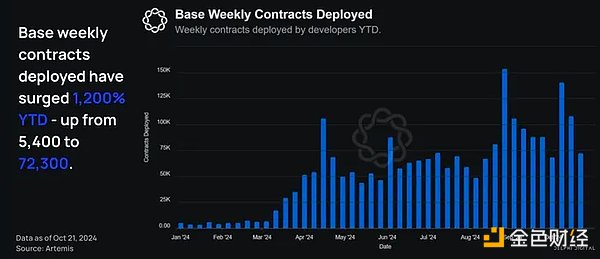
Base can prioritize work on the decentralized stack (e.g. proofs of failure) and help the broader Ethereum ecosystem since there is ample developer activity on Base.
We see this in practice today – weekly contract volume is significantly higher than at the beginning of the year, increasing from 5,400 in early January to 72,300 in October, an increase of 1,200%.
Note: The number of contracts deployed per week refers to the number of unique on-chain contracts deployed on Base each week.
 Weekly Base contract deployments by unique addresses year to date
In addition, Base also found that the number of contracts deployed through unique addresses is increasing rapidly. Since January, the number of contracts deployed through unique addresses per week has increased from 3,700 to 32,500, an increase of 778%.
Note: The number of contracts deployed by unique addresses each week refers to the number of on-chain contracts deployed on Base by developers who have not deployed any contracts that week.
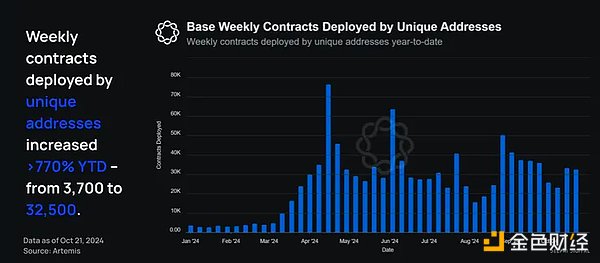
Although this metric has declined slightly since April, the overall trend is still upward, which is a strong indication that the ecosystem of application developers on the Base chain is thriving. In addition, it also shows that the team's development work to make Base a developer-friendly chain is succeeding.
Onchain Job Market Insights
For the part involving non-public information, we interviewed recruiters from different headhunting firms.
The number of companies hiring engineers with smart contract expertise has increased so far this year
According to our sources, the number of companies hiring engineers to work on-chain development has increased dramatically in the first two quarters of 2024. This growth slowed down after EthCC as the traditional “summer slowdown” occurred and prices fell. However, even during this period, there was a clear uptick in hiring relative to other periods of falling prices.
Our sources noticed an interesting trend: in bear markets, people focus more on infrastructure, which leads to more developers working on infrastructure-related problems. Conversely, in bull markets, people actively optimize for mass adoption, which leads to more consumer applications being funded, and therefore more developers working on consumer applications.
Providing more job opportunities for applicants who are proficient in cryptocurrency
According to our sources, there is an increasing demand for crypto-native job seekers across industries. Crypto-native talent understands how blockchain projects market to users because the job seekers were/are still users — a clear advantage over crypto-naive job seekers. One source added that crypto-native employees who are familiar with niche marketing structures that appeal to the crypto community are key to a successful marketing strategy.
Interestingly, there was a spike in demand for crypto-native talent to network in Q1 and Q2, which coincides with the time when protocols release their products and tokens. However, our sources noted that companies in the crypto industry still place a high value on prestige. Even for crypto-native candidates, factors such as attending an Ivy League school are often highly valued in the hiring process.
According to our sources, the demand for crypto natives and candidates with prestigious backgrounds has resulted in many positions within the industry being restricted to a limited number of applicants.
What builders/protocols/founders think about the talent pool
Our sources indicate that prior to the collapse of FTX, Luna, and Three Arrows Capital, the industry’s talent pool was broader and more diverse, with candidates coming from a variety of fields beyond computer science. Clearly, these events have had an impact on the crypto industry far beyond the decline in market valuations. General reputation issues remain, reducing the number of applicants willing to work in an industry they perceive as unstable.
According to one source, this bias against cryptocurrencies is also reflected in the decline in student interest in joining university blockchain clubs. Prior to the aforementioned crash, there was a noticeable increase in demand for club memberships. Given the current competitive landscape for computer science and engineering internships, the waning interest in an industry that is plentiful with opportunities is particularly concerning.
That said, the crypto industry would benefit from a stronger appeal to young builders for on-chain development — targeting interns and recent graduates.
Strong demand for talent, but talent shortage
Despite the tough market conditions, recruiters are seeing continued demand for engineering talent as venture-backed projects compete fiercely for a limited pool of technical engineers.
As a result, there is a clear shortage of crypto developers as demand continues to outstrip available talent. Interestingly, the three sources added that many traditional developers are reluctant to pursue positions in the crypto space as they view the industry as unstable.
This assertion is reinforced by three findings from a recent Coinbase survey of on-chain and mainstream developers, which highlight a lack of confidence in the ability to onboard new developers.
Half (49%) of mainstream developers believe that "cryptocurrency and blockchain are important areas of innovation in the future."
78% of on-chain developers agree that “it used to be difficult to get new users started with cryptocurrencies and blockchain applications.”
73% of on-chain developers said that “the lack of clarity in crypto regulations makes innovation in the space more difficult.”
Coinbase is actively seeking greater regulatory clarity around the world on behalf of the industry. Progress in this area could help remove barriers to innovation for developers and promote the overall development of the on-chain economy.
in conclusion
In 2024, the on-chain economy will undoubtedly experience explosive growth. Much of this growth is driven by activities other than financial speculation and trading. Stablecoins have found product-market fit and are driving a more global digital economy. L2 reduces on-chain costs, making on-chain construction easier, faster, and cheaper.
In just over a year, Base has solidified its position as a leader in L2. By building an ecosystem that attracts developers with minimal transaction fees, Base has created an environment that is not only attractive to developers and users, but also has a high retention rate.
DeFi remains at the core of on-chain economic activity. DeFi provides financial products and services at an institutional scale, but without intermediaries that absorb value. Instead, this value can be redistributed to participants.
At the same time, new use cases and applications are becoming an important part of the on-chain economy. Promoting the development of diverse on-chain applications and creating infrastructure to support various industries (such as games and SocialFi) means that on-chain experiences are constantly expanding, which is the main driving force for the growing global on-chain economy.
Lower fees, more use cases, easier-to-use technology, and innovative products all contribute to the flourishing on-chain economy.


