The price fluctuation of Bitcoin is closely related to the capital flow of its spot ETF or ETP. Two weeks ago, the crypto market was in good condition, according to Coinshares data, showing that global crypto asset investment products attracted $308 million in inflows in a single week. However, following the hawkish remarks from the Fed on December 19, there was a massive outflow of $576 million, with the total outflow reaching $1 billion over the weekend.
VX: TTZS6308
In addition, affected by the recent price decline, the total assets under management of crypto exchange-traded products (ETPs) decreased by $17.7 billion, indicating a significant capital flight. During the Christmas trading period this week, Bitcoin experienced partial outflows during the week, but ultimately saw a net inflow of $375 million, reflecting that market sentiment is not as pessimistic as expected. In comparison, the outflow from multi-asset investment products was the most pronounced, reaching $121 million.
The current bull market cycle has not yet reached its end
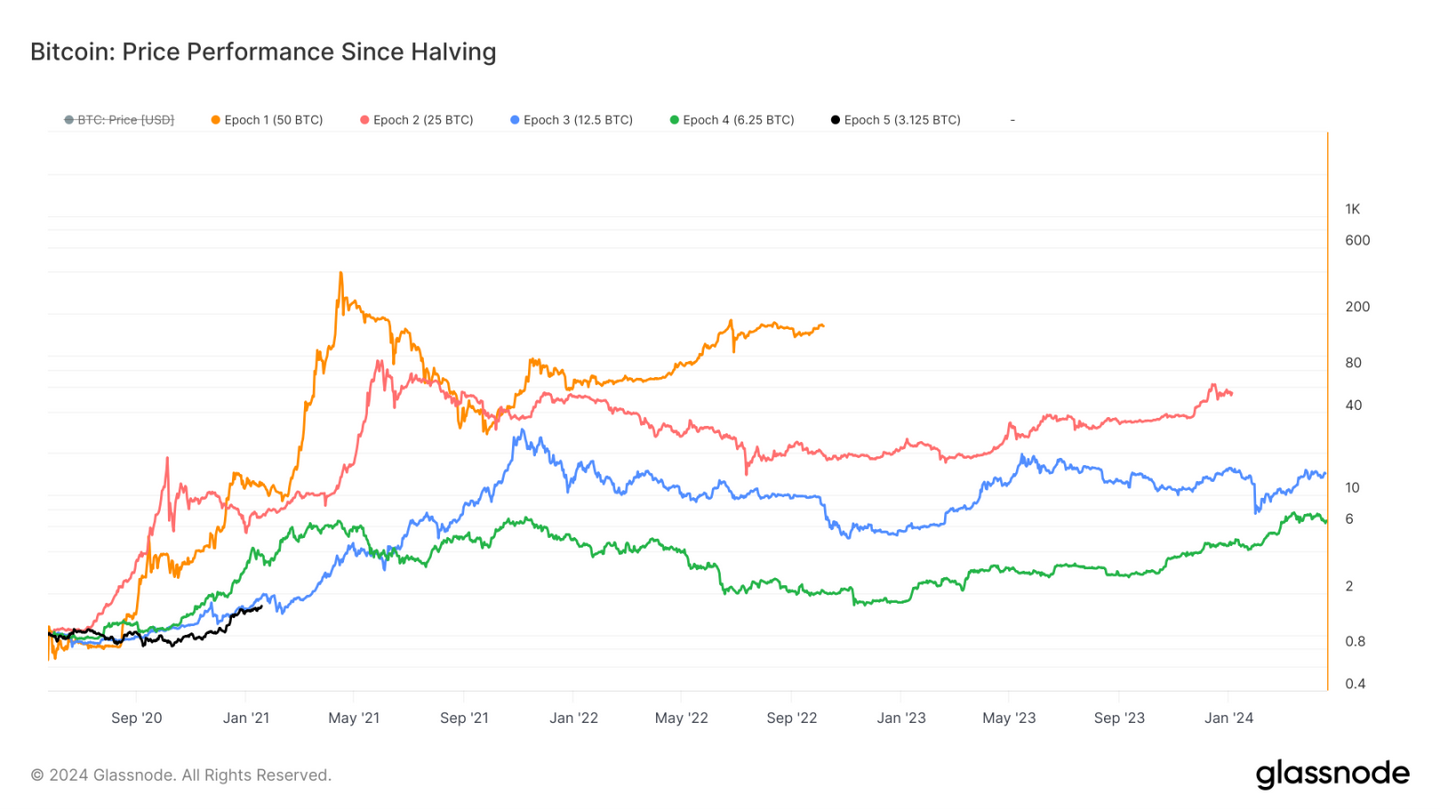
The "halving" has always been a key event in the Bitcoin market, representing a technical node of block reward reduction and an important catalyst for market sentiment and capital flow. The historical price trend starting from the halving day shows that the market performance in different halving cycles varies significantly, reflecting the gradual maturation of the market and the complex interplay between supply-demand dynamics and market expectations. The first halving cycle saw a 5315% increase in Bitcoin price, with a maximum drawdown of 85%; the second halving cycle saw a 1336% increase, with a maximum drawdown of 83%; the third halving cycle saw a slower growth of 569%, with a maximum drawdown of 77%.
This gradually smoother volatility indicates that the expansion of market scale and the increase in capital flow are buffering the diminishing returns effect brought by the halving.

From the perspective of supply-demand relationship, the halving rally is not simply driven by the reduction in supply, but rather the result of the dynamic balance between supply and demand and the interplay of market expectations. The early entry and long-term positioning of institutional capital have established new price support for the market, while the FOMO sentiment of retail investors has further amplified the gains.
It is worth noting that this halving cycle is the first time the market has broken through the historical high (ATH) before the halving. Looking at the overall performance before and after the halving, the current market is still in an upward phase, and future growth may continue to find a new balance point in the supply-demand dynamics.
The current bull market correction is much smaller than previous cycles
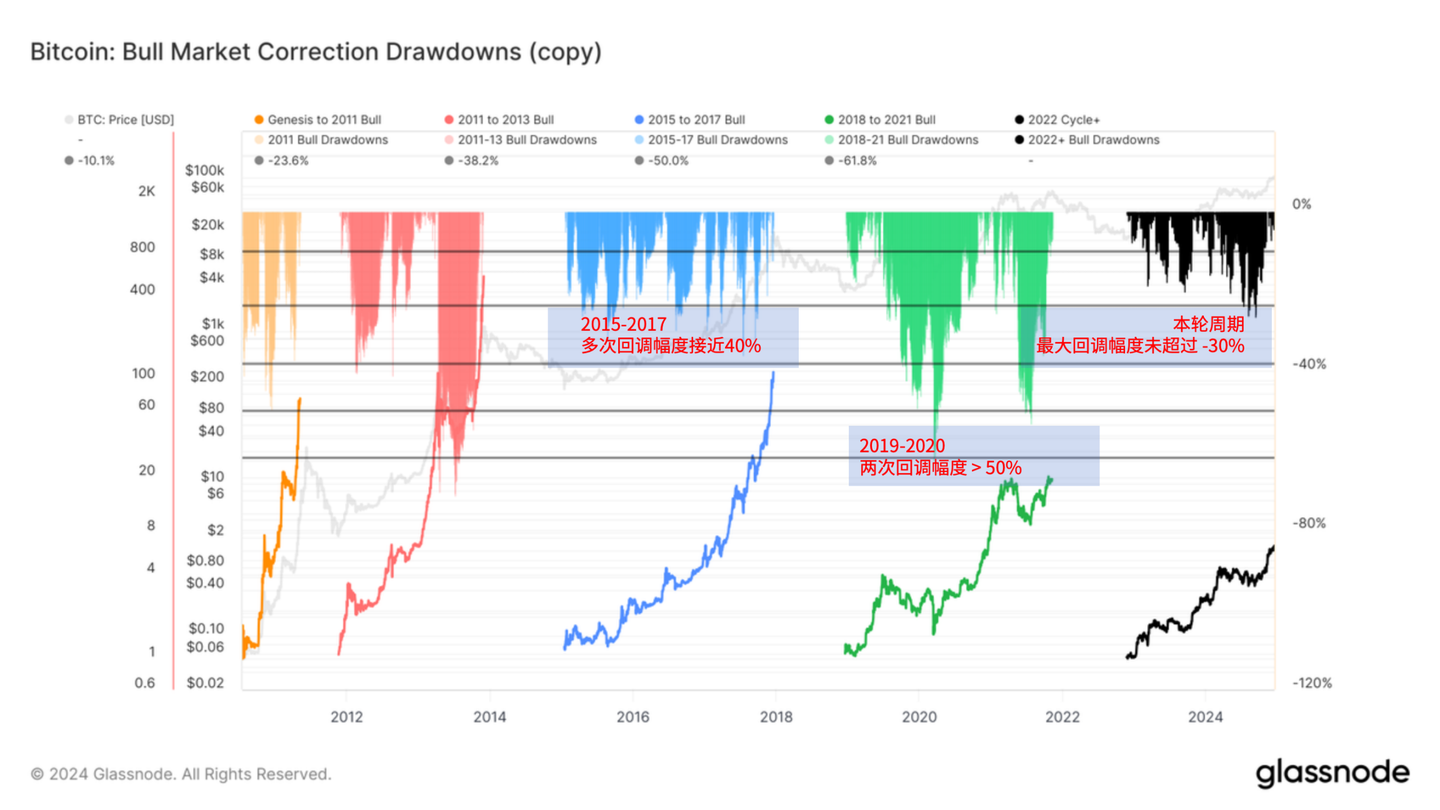
A significant feature of the current Bitcoin market is the significantly reduced correction range, demonstrating unprecedented buying power and market resilience. Compared to the deep corrections of 30% or even over 50% in previous cycles, the deepest correction this time was only around 30%, which indirectly reflects the improvement in the overall supply-demand relationship of the market, as well as the dual support from institutional capital and policy tailwinds. Particularly, the approval of the US Bitcoin spot ETF and the positive changes in the policy environment have injected long-term capital into the market and boosted investor confidence.

This phenomenon of shallow corrections can be seen as a sign of the gradual maturation of the market structure. With the deep involvement of institutional investors, the Bitcoin market is transitioning from the high-volatility stage driven by early retail investors to a more stable development led by institutional capital. Meanwhile, the launch of spot ETFs has also provided a convenient entry channel for long-term capital, reducing the severe corrections caused by short-term market sentiment fluctuations.
Bitcoin's market dominance hits a multi-year high
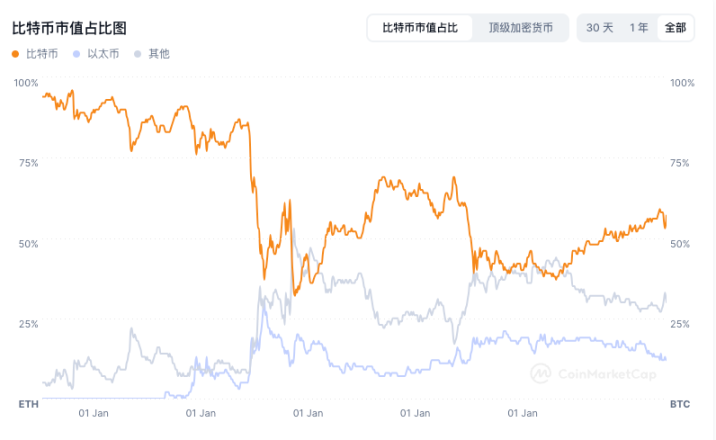
The Bitcoin Dominance Index (BTC.D) is an important indicator that measures the proportion of Bitcoin's market capitalization in the entire crypto market. Since September 2022, Bitcoin's market dominance has shown an overall upward trend, reaching over 60% at one point in 2024, with an annual increase of more than 10%, setting a new high since April 2021. This phenomenon has a traceable pattern in Bitcoin's historical cycles, usually signaling the concentration of capital inflows in the early stage of a bull market.
According to past patterns, the rise in Bitcoin's market dominance often accompanies the start of a bull market, as capital flows more to Bitcoin as the core market asset at this stage, while the performance of other altcoins lags behind. When Bitcoin's market dominance reaches its peak, market liquidity and investment sentiment are often approaching a critical point. At this time, investors start to take profits, and Bitcoin's market dominance declines, with the market gradually shifting capital to Altcoins, forming the so-called "Altcoin Season".

However, the current rise in Bitcoin's market dominance differs from the past in that the deep involvement of institutional capital and the approval of spot ETFs have further strengthened Bitcoin's leading position, making it significantly more attractive compared to other assets. This may mean that the peak of Bitcoin's market dominance will be more persistent in future bull markets, and the arrival of the "Altcoin Season" may be delayed or weakened, leading to a gradually more concentrated market structure.


