

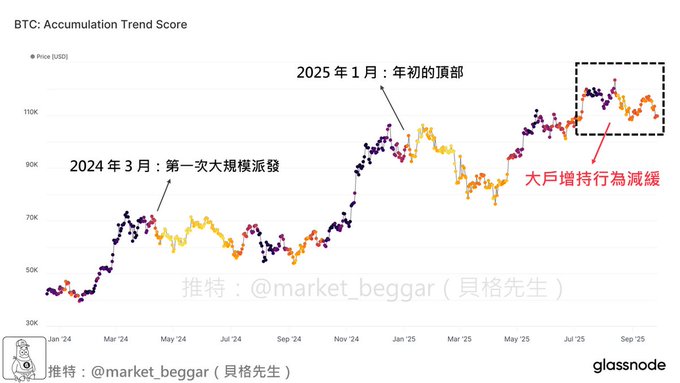
BTC Accumulation Trend Score Update: Big Players Are Slowing Down Their Buys ⚠️ Last time, I talked about “Conviction Buyers” and how their actions fit into BTC’s bull/bear cycles (see quoted thread below). Today, let’s dive into another interesting on-chain metric: Accumulation Trend Score. Here’s a quick rundown of how this metric works, how it’s calculated, and a new risk signal I’m seeing 👇 📊 Accumulation Trend Score Explained: ➡️ Tracks the monthly change in wallet balances across different cohorts to measure the intensity of accumulation ➡️ Score ranges from 0 to 1 ➡️ Closer to 1 = aggressive accumulation by large entities in the past month ➡️ Closer to 0 = large entities have stopped accumulating, or are even distributing ➡️ Removes miners, exchanges, and other specific groups from calculations ➡️ Uses a 90-day rolling window and normalizes data for cross-period comparability As shown in the chart: 🟪 Darker color = score near 1, meaning strong accumulation by whales 🟨 Lighter color = score near 0, meaning whales have stopped accumulating or are distributing Let’s look at the current market situation using this chart: 1️⃣ March 2024: Color shift from dark to light First large-scale distribution event (see pinned post). BTC went sideways for over 200 days, alts went full bear. Indicator shifted from dark (aggressive accumulation) to light (distribution/sell-off). 2️⃣ January 2025: Color shift from dark to light Second large-scale distribution event (see pinned post). Indicator turned light in Jan, market topped right after. 3️⃣ Now: Color is turning lighter again As shown, the score is gradually lightening. Not fully yellow yet (lightest), but this is an early risk signal‼️ Combine this with other major top signals I’ve shared: - RUP triple divergence - Massive Realized Profit (x.com/market_beggar/status/195...…) - Price/PSIP correlation breaking down (x.com/market_beggar/status/194...…) - BTC daily chart new high stop hunt (x.com/market_beggar/status/195...…) - Technical chart Lower High confirmation (x.com/market_beggar/status/197...…) - Short-term holder average cost breakdown (x.com/market_beggar/status/197...…) ...and more. IMO, BTC is getting closer and closer to a major cycle top ⚠️ Quick update for everyone: My previously disclosed “low-leverage long-term short” positions remain unchanged. Both entries average out to ~118K, total leverage = 1.11x: x.com/market_beggar/status/194...… That’s it for today—hope this helps! Risk management first. May you all protect your hard-earned gains 🫡
This article is machine translated
Show original

貝格先生
@market_beggar
09-24
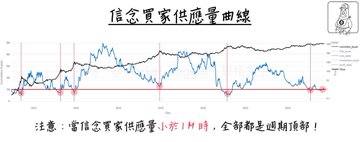
以信念買家的角度剖析 BTC 牛熊週期🔬
先前我曾介紹過「五大買方族群熱力圖」(https://x.com/market_beggar/status/1927539239903764555…),
其中有一族群被稱為「信念買家(Conviction Buyers)」,
是指「在 BTC 下跌時買入」的族群💎
平時五大族群熱力圖監測的是他們的中短期行為,
但如果把時框拉大,則可以得出有趣的現象👇:
Sector:
From Twitter
Disclaimer: The content above is only the author's opinion which does not represent any position of Followin, and is not intended as, and shall not be understood or construed as, investment advice from Followin.
Like
Add to Favorites
Comments
Share
Relevant content


