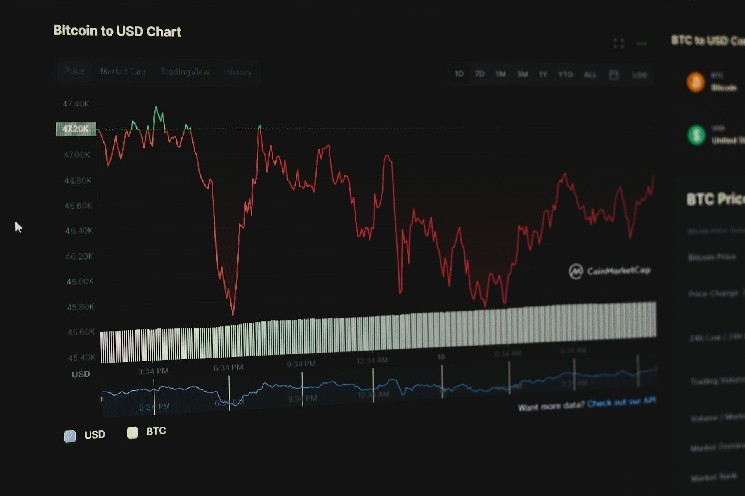
Bitcoin's sharp drop of $16,700 in less than eight hours shows volatility Dai in the era of spot ETFs, with leverage and thin liquidation amplifying market-wide losses.
Unusual movements in Derivative, margin issues and risk rumors have pushed perpetual contracts 5% off spot prices, as market makers exercise caution ahead of a US holiday.
- BTC Price Plunges to $16,700, Liquidations of Over $5 Billion Highlight Leverage Risk and Liquidation Collateral.
- Portfolio margin issues also forced closing of profitable positions; some altcoins fell over 40% causing collateral loss.
- BTC/ USDT perpetual contract is discounted about 5% compared to spot, reflecting low liquidation , insolvency rumors and US market holidays.
What happened to Bitcoin price on Friday?
In less than eight hours, Bitcoin fell $16,700, or 13.7%, to $105,000. About 13% of total open interest in BTC Futures Contract was wiped out, and more than $5 billion in positions were liquidated, but this level is not uncommon in Bitcoin's history.
Excluding the March 12, 2020 COVID crash with an intraday drop of 41.1%, there were 48 other sessions that saw deeper corrections. Most recently, on November 9, 2022, BTC fell 16.1% intraday to $15,590 coinciding with the FTX event, after it was revealed that approximately 40% of Alameda’s assets were tied to FTT (source: TradingView/Cointelegraph; CoinDesk, November 2, 2022).
Today’s drop is on par with the big crashes from 2017, suggesting that leverage resets are still recurring. The difference is that the market structure has changed: DEX activity has surged and spot ETFs have created new Capital flows but have not eliminated volatility.
| Time | Intraday discount | Price milestone | Context | Source |
|---|---|---|---|---|
| March 12, 2020 | 41.1% | — | COVID Crash; BitMEX Hits Liquidation Issue and 15-Minute Outage | TradingView/Cointelegraph |
| November 9, 2022 | 16.1% | 15,590 USD | FTX Crisis After Revelation of Alameda Asset Tied to FTT | CoinDesk (November 2, 2022) |
| Friday (recent) | 13.7% | 105,000 USD | Liquidation spread, high leverage, thin liquidation on weekends | TradingView/Cointelegraph |
Why is volatility still high despite the existence of spot ETFs?
The US spot ETF (launched 01/2024) has helped the market mature, but has not significantly reduced volatility: 08/05/2024, BTC fell 15.4% intraday; 03/05/2024 fell 13.3%; and 10.5% just 2 days after the ETF launched.
The large declines show that Bitcoin's 4-year cycle and liquidation structure still dominate significantly. While ETFs attract institutional Capital , the Order Book depth on CEX/DEX exchanges is uneven, which can easily create a domino effect when leverage is called for simultaneously.
The regulator also emphasized that ETFs do not “back” Bitcoin, so expectations of stabilizing the entire market are premature in the short term.
“While we approved the listing and trading of several Bitcoin spot ETPs today, we do not approve or endorse Bitcoin.”
– Gary Gensler, SEC Chairman, January 10, 2024, SEC.gov
How leverage and thin liquidation amplified the crash?
Over $5 billion in positions were liquidated, with Hyperliquid alone reporting $2.6 billion in forced closing of long positions. As altcoin collateral fell above 40%, margin values plummeted, triggering auto-deleveraging on DEXs and margin calculation issues on some platforms.
With portfolio margin, losses in one asset can spread to the entire position, unlike isolated margin which only limits the risk of each pair. In a crash, even profitable accounts can be liquidated if the total net asset value falls below the protection threshold.
This is not necessarily due to a “fault” or fraud on the part of the exchange, but rather reflects the nature of leverage in an liquidation market. When many collateral assets are reduced at the same time, a chain effect of liquidation is inevitable.
Why is the BTC/ USDT perpetual contract 5% off the spot price?
During the crash, the BTC/ USDT perpetual contract traded about 5% lower than the BTC/USD spot and has not yet recovered to pre-event levels. Normally, this gap creates an arbitrage opportunity, but market makers were cautious due to thin liquidation , risk rumors, and the holiday that closed parts of the U.S. market.
As liquidity wanes and hedging liquidation rise, funds may scale back their creation. As a result, the balance between spot and perp is slow to recover. Prolonged negative spreads reflect risk-off sentiment, funding, and unusually volatile basis.
To return to equilibrium, the market needs time to assess the damage, restore confidence and re-establish Order Book depth. This often cannot happen overnight after large liquidation shocks.
What are the triggers for a mass liquidation?
In addition to high leverage and low liquidation , rumors of insolvency can cause makers to reduce risk, amplifying volatility. Mishandled or slow-updated portfolio margins further increase the likelihood of unwanted position closures.
During the FTX 2022 wave, the market saw how centralized collateral exacerbated the crisis. The lesson repeated itself when altcoins plunged, pulling collateral values below safety thresholds, triggering chain liquidations on both CEX and DEX.
Platforms advertise auto-deleveraging as a system defense. However, with high asset correlations, contagion risks remain high if multiple collateral assets are liquidation .
“The majority of Alameda's balance sheet is made up of FTT Token issued by FTX.”
– Ian Allison, Reporter, November 2, 2022, CoinDesk
Could $105,000 be support?
No confirmation yet. The Derivative market will need a few days to reassess the risk and assess the extent of the damage. The perp-spot spread and maker sentiment will be important indicators before a reliable support zone around $105,000 forms.
History shows that Bitcoin can form a mid-term Dip after crashes due to leverage liquidation, but the probability depends on Capital flows, macro news and liquidation. Rushing to guess the Dip is often risky when the margin mechanism is not stable.
Looking at funding rates, basis, Order Book depth and margin rebalancing helps assess the sustainability of any post-shock recovery.
How should investors manage risk during periods of high volatility?
Prioritize isolated margin over portfolio margin if collateral correlation is not well controlled. Limit leverage, diversify liquidation collateral, and set clear stop-loss levels.
Avoid using volatile altcoins as collateral during market stress. Monitor ADL status, system notifications, and perp–spot spreads; temporarily reduce position size when market makers reduce risk.
Prepare for infrastructure failures, order matching disruptions, or margin calculations. System-level risk management is as important as technical analysis in a liquidity liquidation .
Historical milestones help put events in context
Compared to historical crashes, this 13.7% drop is within the “new normal” of Bitcoin. The difference is that the participation of ETFs and DEXs makes the cash flow and the multi-layered deposit mechanism more complicated.
The large fluctuations after the ETF launch (10.5% in January 2024; 13.3% on March 5, 2024; 15.4% on August 5, 2024) show that the stabilization period can last from months to years.
Overall, the leverage liquidation cycle remains a periodic risk-clearing mechanism. Monitoring Derivative and liquidation data will help mitigate portfolio shocks.
Frequently Asked Questions
Will a Spot ETF Reduce Bitcoin Volatility?
Not clear. While ETFs attract institutional Capital , intraday crashes of 10–15% are likely to occur after January 2024. Historical data suggests the stabilization process could be lengthy (source: TradingView/Cointelegraph).
Why is portfolio margin riskier than isolated margin in a crash?
Portfolio margin pools risk across assets: a single asset that falls sharply can drag the entire account below safety thresholds. Isolated margin limits risk per position, providing better control in turbulent markets.
Is a 5% difference between perp and spot normal?
During liquidation crunches, large spreads can occur as makers withdraw risk. As liquidation recovers, spreads typically narrow, but the timing of the adjustment is not fixed.
What does the $5 billion liquidation figure reflect?
Reflecting high leverage, liquidation collateral and chain margin calls, Hyperliquid alone recorded $2.6 billion in forced closings of long positions.
Is the $105,000 mark a reliable buy?
No strong support confirmation yet. Need to monitor perp–spot spread, funding and Order Book depth. Decisions should be based on risk management and objective data.


