

Bitcoin’s current price stands at $107,891, with a commanding market cap of $2.15 trillion and a 24-hour trading volume of $33.63 billion. Price action flirted between $106,222 and $108,142 in the past day, serving up volatility with a side of whiplash.
Bitcoin Chart Outlook
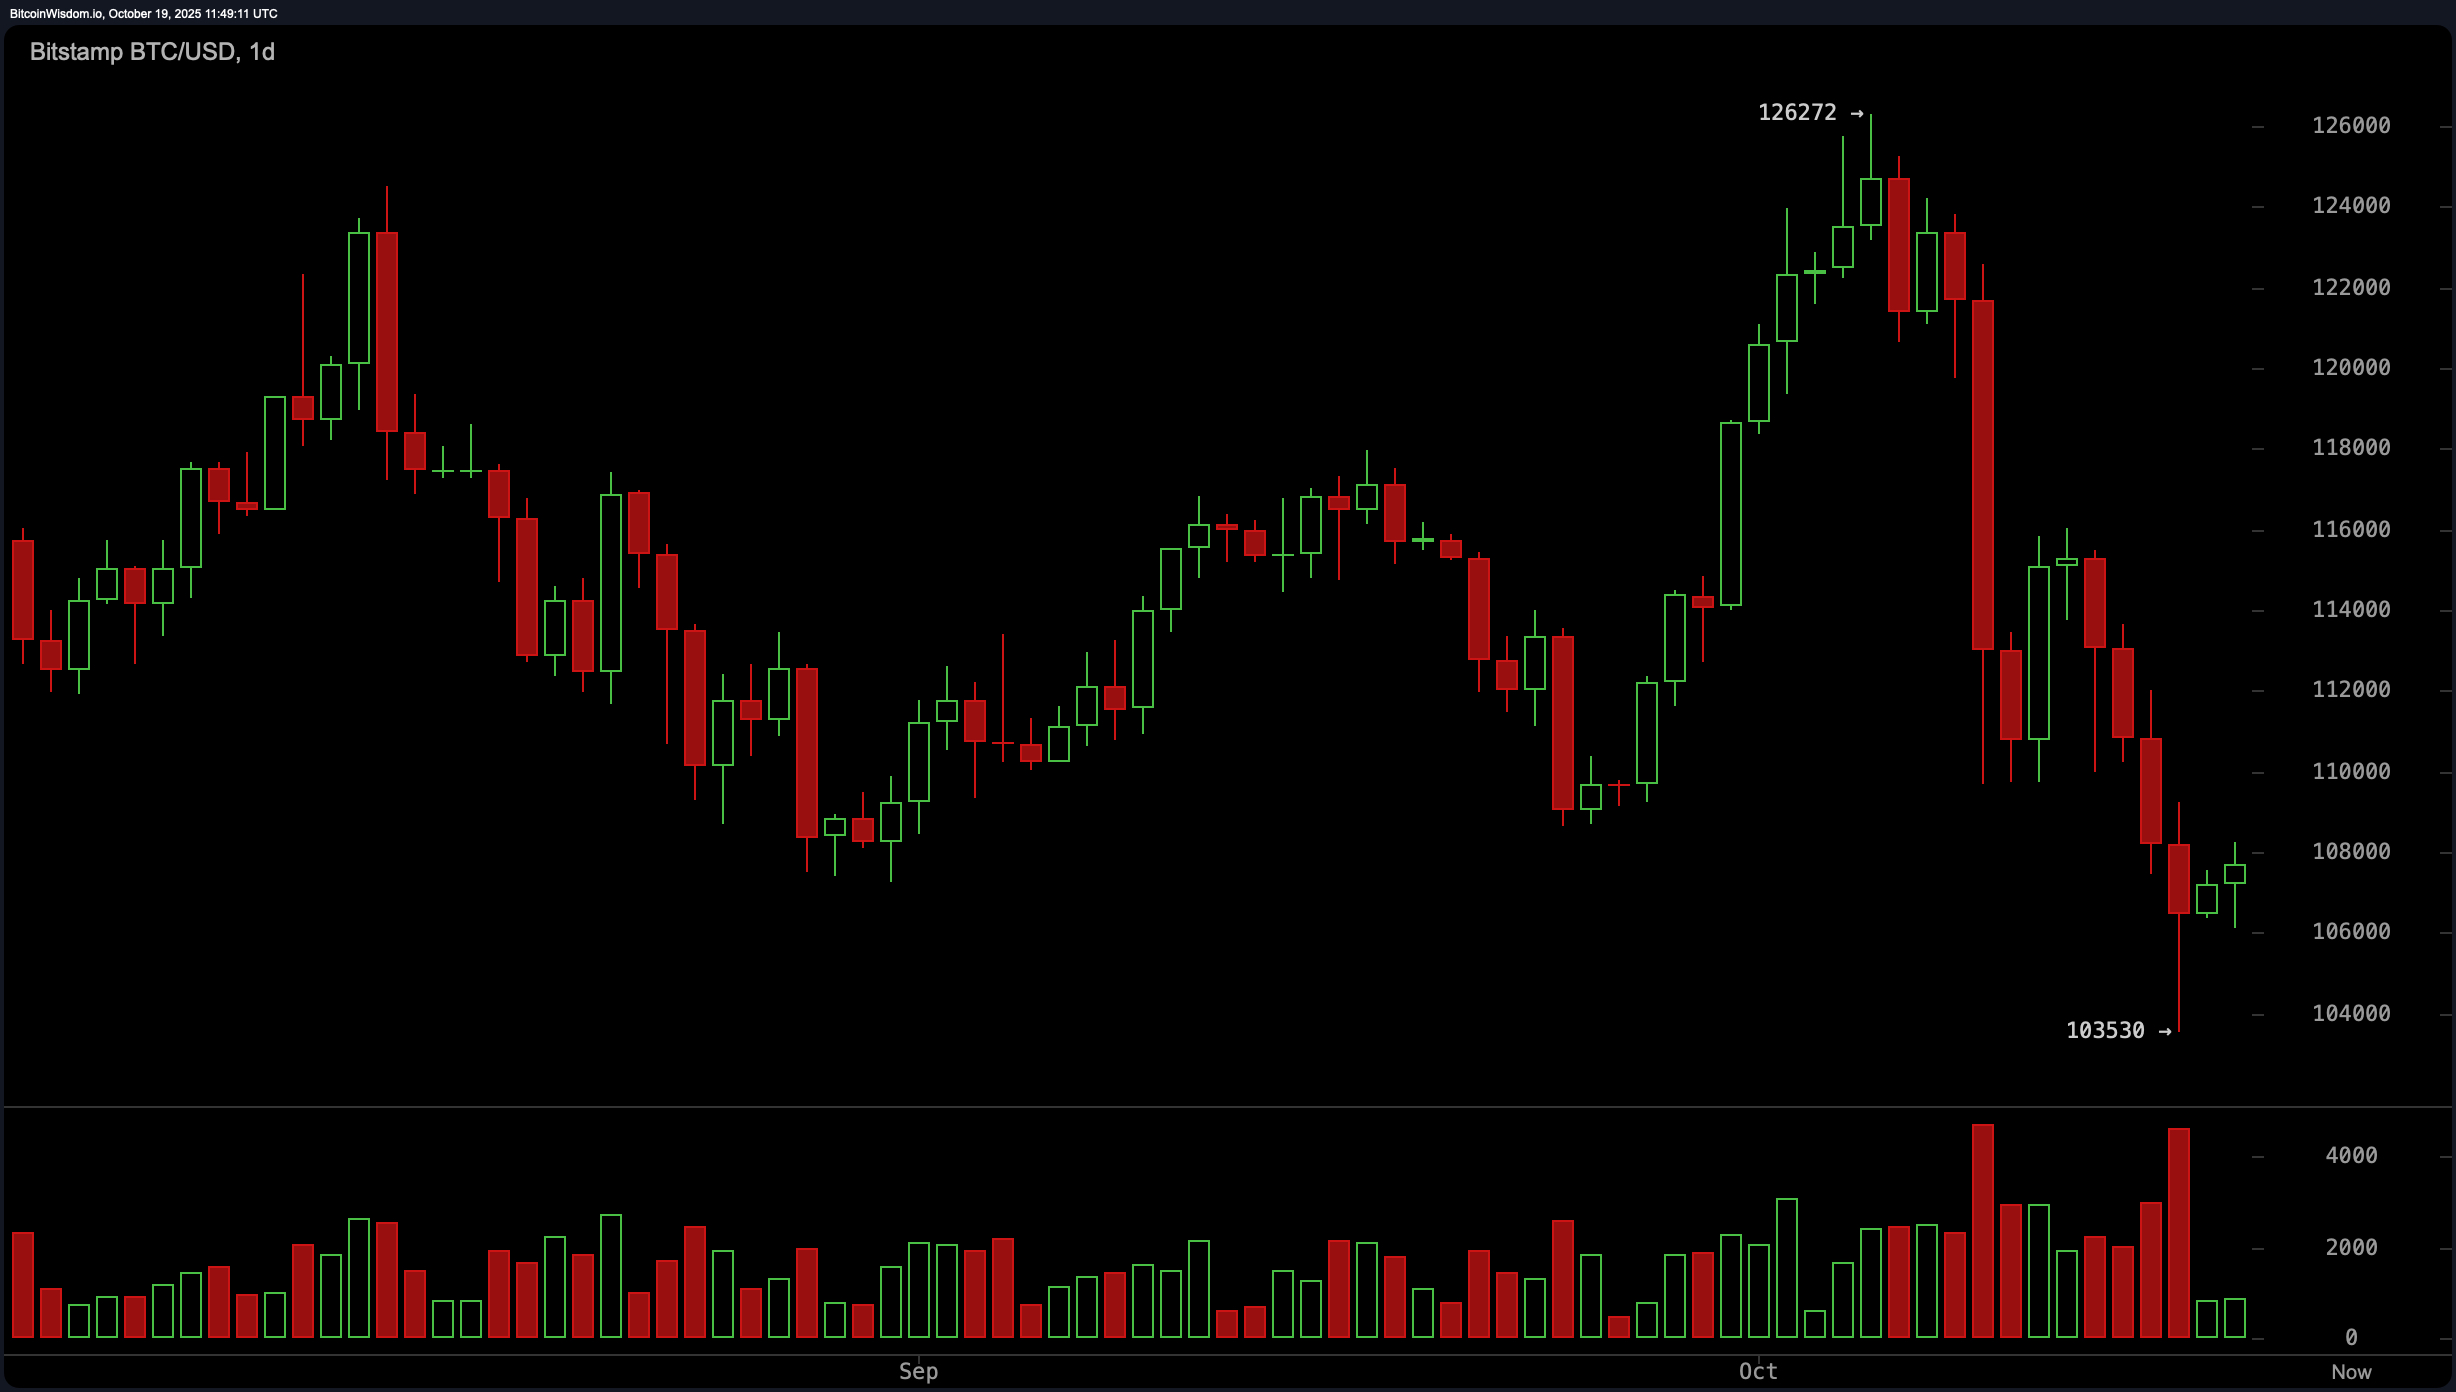
The daily chart paints a dramatic arc. After peaking near $126,272 earlier in October, bitcoin nosedived to $103,530, slicing nearly 18% in days. This aggressive correction was no silent slip — volume surged at the lows, hinting at a bout of panic selling. Recent candles are playing coy, showing smaller bodies and indecision.
Translation: the bears are tired, and the bulls are peeking through the curtains. Momentum and commodity channel index (CCI) indicators both suggest the potential for a rebound, with momentum sitting at -13,883 and the CCI at -109, signaling bullish divergence.
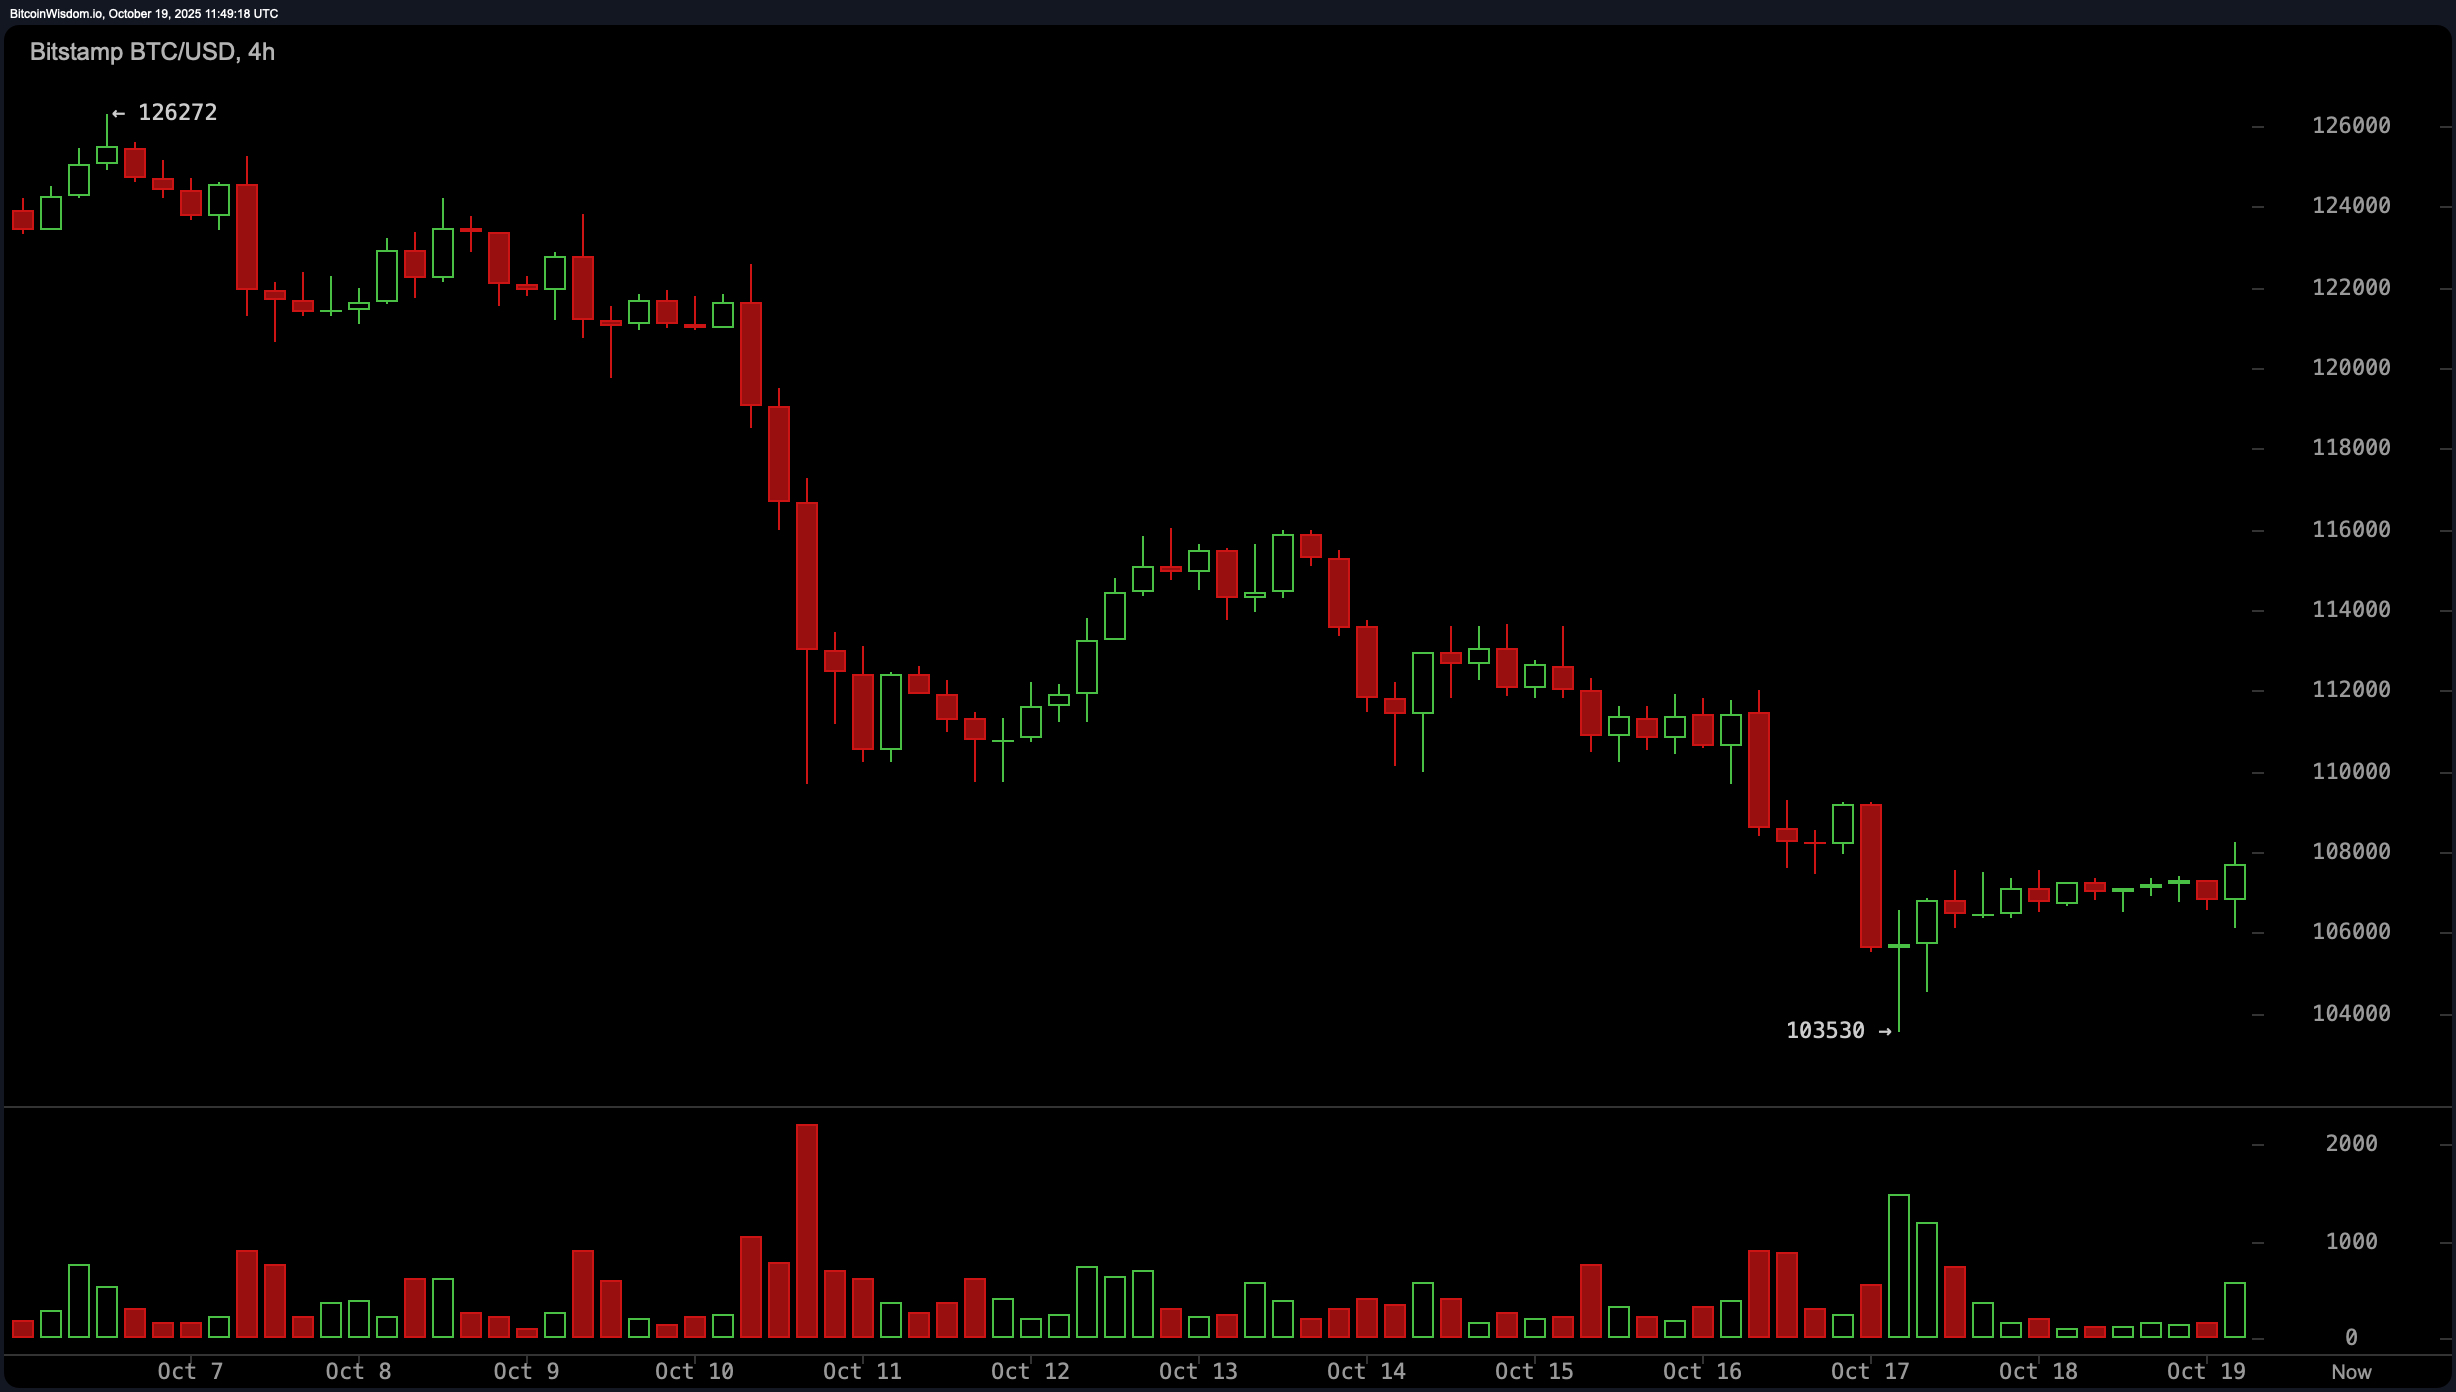
Moving into the four-hour chart, bitcoin looks like it’s building a base — or baiting traders into a bear flag. The asset is consolidating between $106,000 and $108,000 after the plunge, and while price action remains cautious, it’s not quiet. Higher lows are forming, and that’s a subtle shift in tone. Volume confirms the move, as green bars rise post-bounce. The exponential moving averages (EMAs) and simple moving averages (SMAs) across the 10, 20, 30, 50, and 100 periods are all flashing red lights, with every one of them above the current price. Translation? The path of least resistance remains down — unless the bulls bring backup.
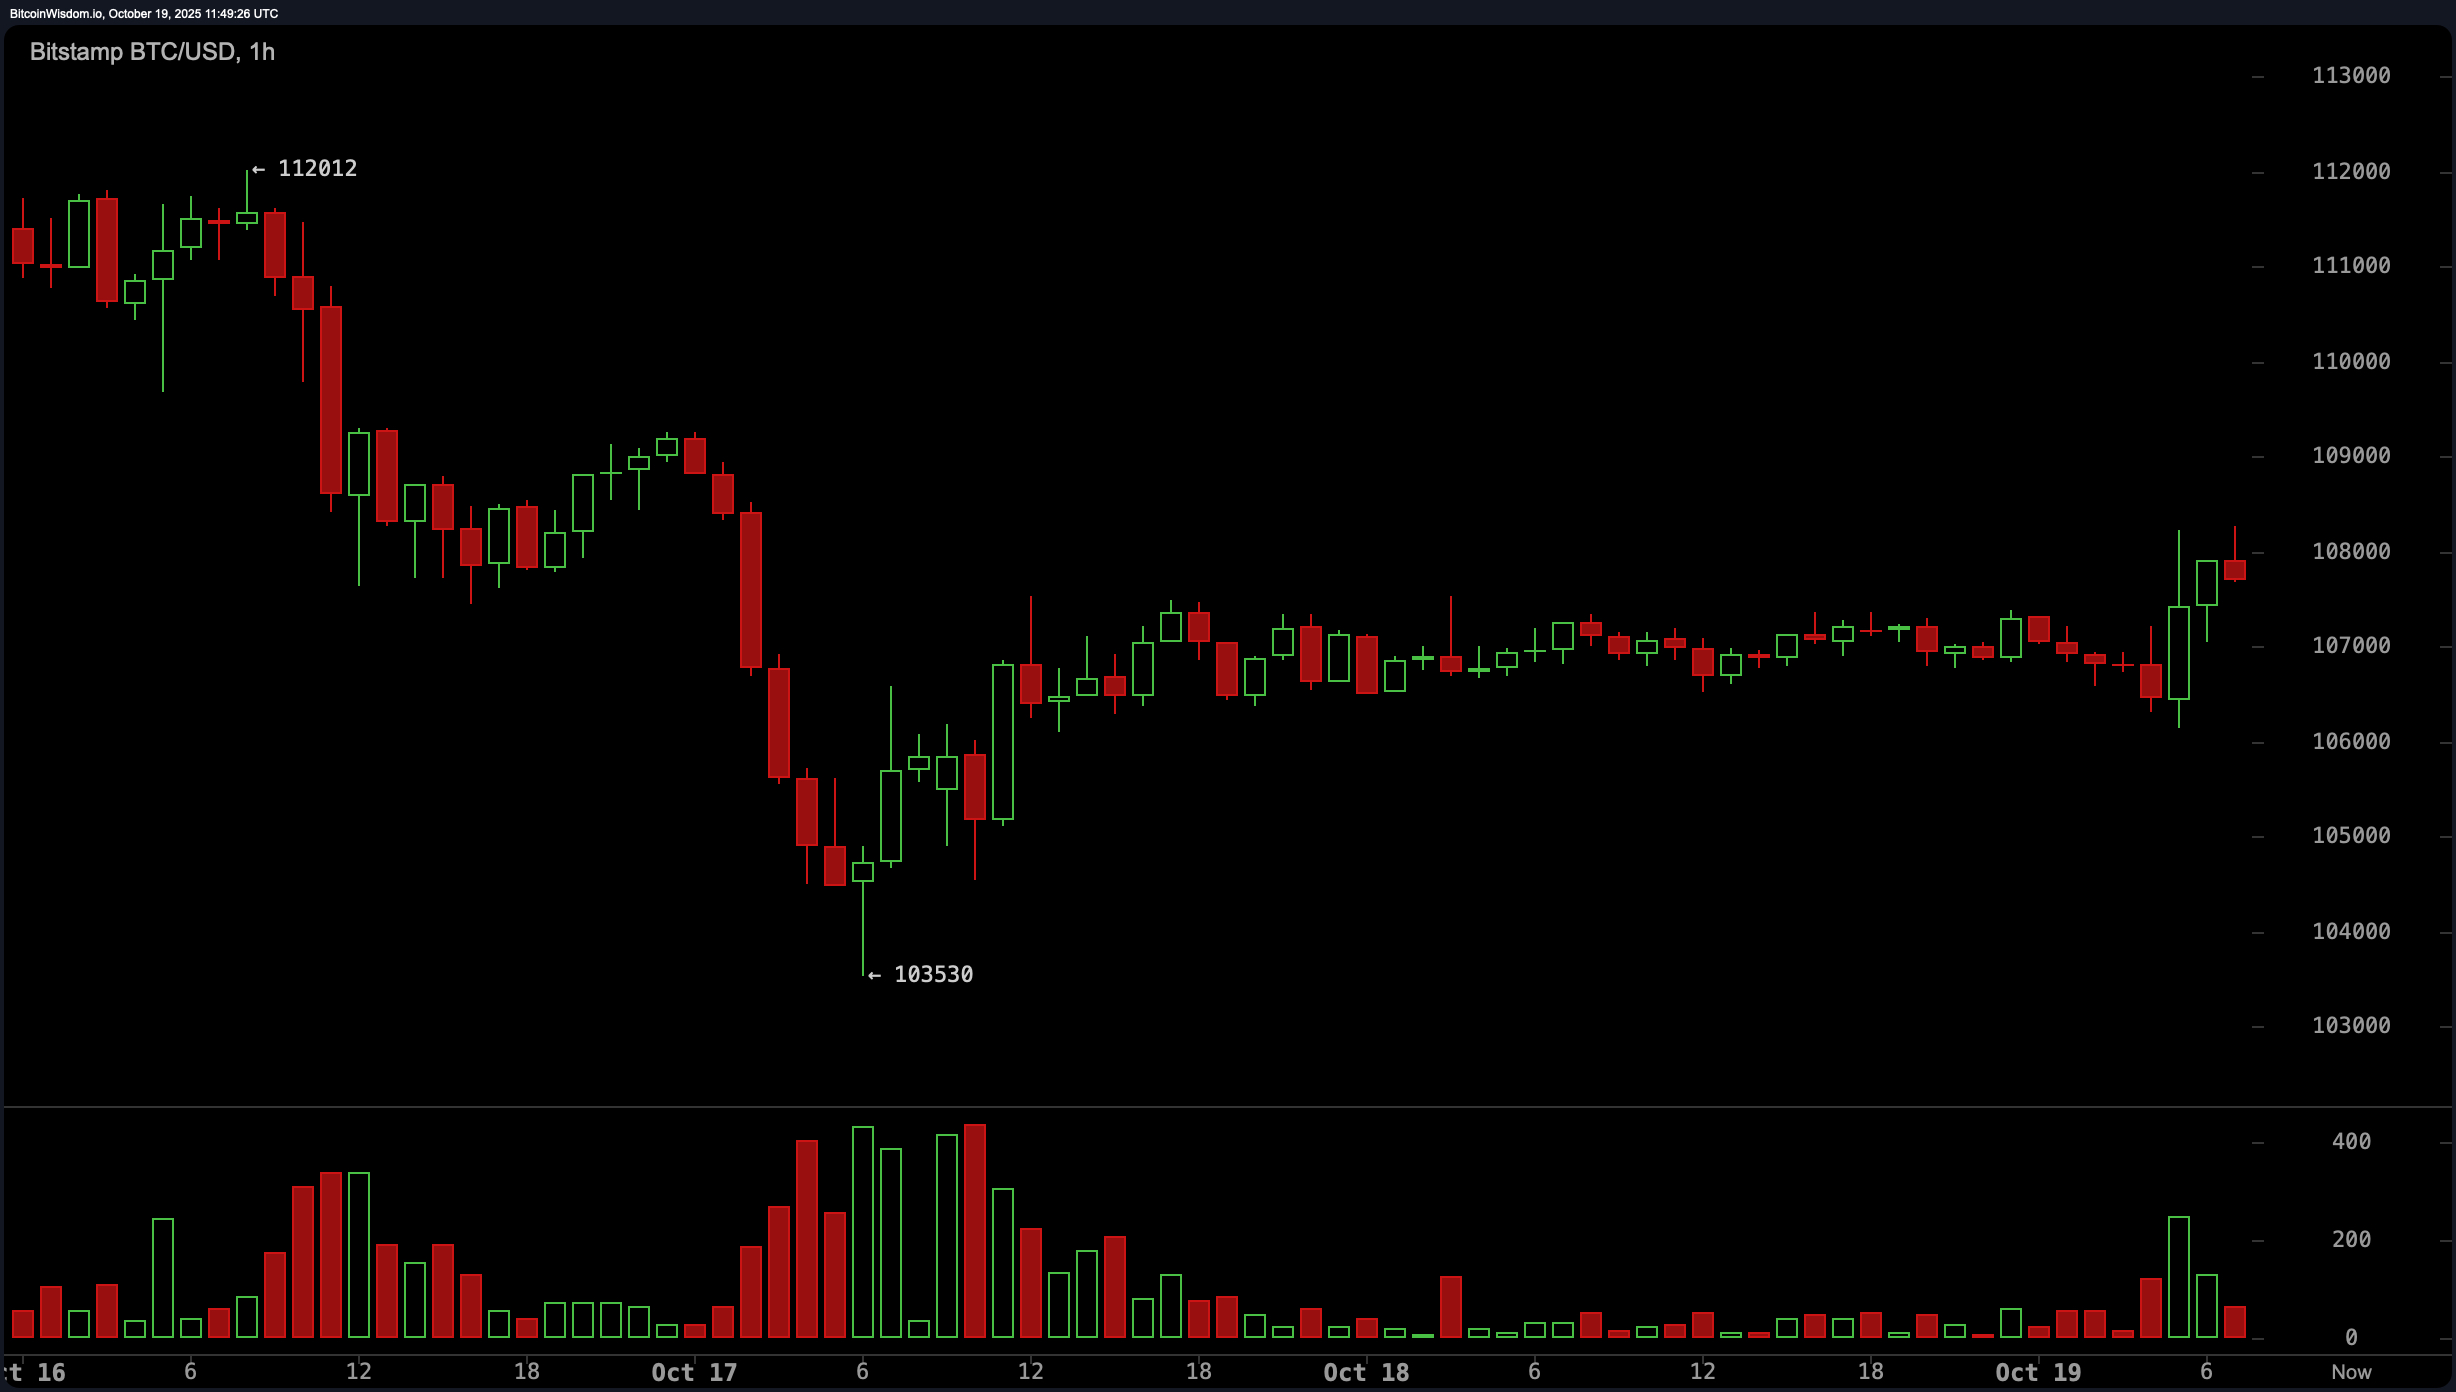
On the one-hour chart, short-term traders have more to cheer about. A double-bottom near $103,530 set the stage for a recovery, with the price breaking out on volume around the $107,000 level. This isn’t a runaway rally, though. Traders are tentative, waiting for macro confirmation. Still, the awesome oscillator (AO) at -6,542 and the relative strength index (RSI) at 38 suggest we’re not in overbought territory — there’s room to run if momentum holds. The moving average convergence divergence (MACD) is dragging its feet at -2,087, still stuck in bearish mode, but the slow bleed could be setting up for a bullish cross.
Looking at the oscillators holistically, there’s a mix of shrugs and side-eyes. The relative strength index (RSI), stochastic, and average directional index (ADX) are all giving neutral readings — a classic “wait and see” posture. Only the momentum and commodity channel index (CCI) are leaning bullish, while the MACD stands alone in the bearish corner. That divergence in indicators echoes the overall sentiment: we’re in a transition phase, neither fully bearish nor convincingly bullish.
In summary, bitcoin is in limbo — but not without a pulse. Price is clinging to the lower end of the day’s range but refuses to roll over. The key levels to watch are $108,000 as a breakout trigger and $103,500 as a must-hold support. Until then, it’s all about playing the range, managing risk, and waiting for the market to declare its next move.
Bull Verdict:
If the higher lows hold and bitcoin can muster a close above $108,000 with volume to match, the stage could be set for a swift rebound toward $112,000 and beyond. Momentum is showing early signs of life, and the recent base-building behavior hints that buyers might be quietly preparing their next act.
Bear Verdict:
Despite the short-term bounce, bitcoin remains pinned below every major moving average, and the moving average convergence divergence (MACD) is still bleeding red. Until price breaks decisively above resistance, this rally risks being just another dead cat in a long descent.
FAQ 🧭
- Where is bitcoin trading now? Bitcoin is currently trading at $107,891, consolidating just below key resistance at $108,000.
- What’s driving bitcoin’s price action today?A sharp pullback from early October highs and mixed technical signals are fueling market indecision.
- Is this a good time to enter the bitcoin market?Traders are watching for a breakout above $108,000 or a breakdown below $106,000 for clarity.
- What regions are showing the most trading activity?North America and East Asia are leading volume, especially on U.S.-based and South Korean exchanges.


