Written by YQ
Compiled by AididiaoJP, Foresight News
Amazon Web Services has suffered another major outage, severely impacting crypto infrastructure. Issues in AWS’s US East 1 region (Northern Virginia data center) crippled Coinbase and dozens of other major crypto platforms, including Robinhood, Infura, Base, and Solana.
AWS has acknowledged an "increased error rate" affecting Amazon DynamoDB and EC2, core database and compute services relied upon by thousands of companies. The outage provides immediate and stark validation of this article's central argument: crypto infrastructure's reliance on centralized cloud service providers creates systemic vulnerabilities that repeatedly manifest under pressure.
The timing is grimly instructive. Just ten days after the $19.3 billion liquidation cascade exposed infrastructure failures at the exchange level, today's AWS outage demonstrates that the problem extends beyond a single platform to the foundational cloud infrastructure layer. When AWS fails, the cascading impact simultaneously impacts centralized exchanges, "decentralized" platforms with centralized dependencies, and countless other services.
This isn't an isolated incident, but a pattern. The following analysis documents similar AWS outages in April 2025, December 2021, and March 2017, each of which crippled major encryption services. The question isn't whether the next infrastructure failure will occur, but when and what will trigger it.
The October 10-11, 2025 Liquidation Chain Event: A Case Study
The liquidation cascade of October 10-11, 2025, provides an instructive case study in infrastructure failure modes. At 20:00 UTC, a major geopolitical announcement triggered a market-wide sell-off. Within an hour, $6 billion in liquidations occurred. By the time Asian markets opened, $19.3 billion in leveraged positions had evaporated across 1.6 million traders' accounts.
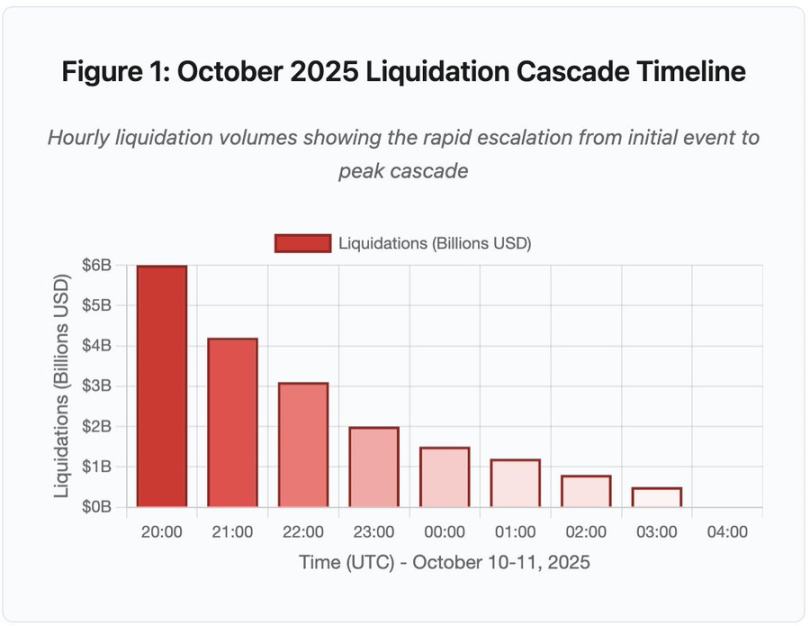
Figure 1: Timeline of the liquidation chain events in October 2025
This interactive timeline chart shows the dramatic progression of hourly liquidations. $6 billion was wiped out in the first hour alone, followed by an even more dramatic second hour as the chain accelerated. The visualization shows:
20:00-21:00: Initial impact - $6 billion liquidated (red zone)
21:00-22:00: Chain peak period - $4.2 billion, when the API starts to throttle
22:00-04:00: Continued deterioration period - $9.1 billion liquidated in a thin liquidity market
Key turning points: API rate limits, market maker withdrawal, and thinning order books
Its scale is at least an order of magnitude larger than any previous crypto market event, and historical comparisons show the step function nature of this event:
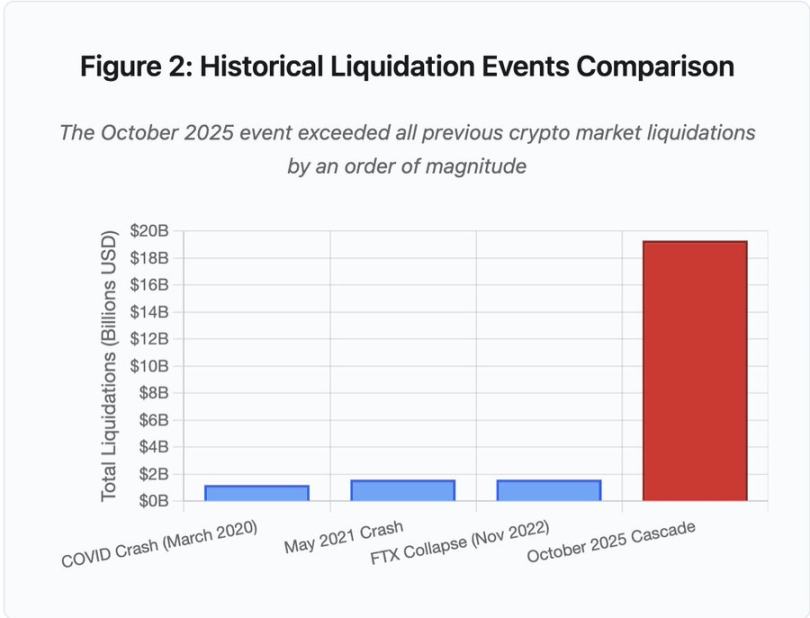
Figure 2: Comparison of historical liquidation events
The bar chart illustrates quite dramatically the prominence of the October 2025 event:
March 2020 (COVID): $1.2 billion
May 2021 (crash): $1.6 billion
November 2022 (FTX): $1.6 billion
October 2025: $19.3 billion, 16 times larger than the previous record
But liquidation numbers only tell part of the story. The more interesting question concerns the mechanisms: How did external market events trigger this specific failure mode? The answer reveals systemic weaknesses in the design of centralized exchange infrastructure and blockchain protocols.
Off-chain failures: centralized exchange architecture
Infrastructure overload and rate limiting
Exchange APIs implement rate limits to prevent abuse and manage server load. During normal operations, these limits allow legitimate trades while blocking potential attacks. During periods of extreme volatility, when thousands of traders simultaneously attempt to adjust their positions, these same rate limits become a bottleneck.
CEXs limit liquidation notifications to one order per second, even when processing thousands of orders per second. This created a lack of transparency during the October chain reaction. Users were unable to determine the severity of the chain reaction in real time. Third-party monitoring tools showed hundreds of liquidations per minute, while official data sources showed far fewer.
API rate limits prevented traders from modifying their positions during the crucial first hour. Connection requests timed out, and order submissions failed. Stop-loss orders went unexecuted, and position queries returned outdated data. This infrastructure bottleneck transformed a market event into an operational crisis.
Traditional exchanges configure their infrastructure for normal loads, adding a safety margin. However, normal loads differ significantly from stress loads, and average daily trading volume is a poor predictor of peak stress demand. During a cascading event, trading volume surges 100x or more, and queries for position data increase 1,000x as every user checks their account simultaneously.
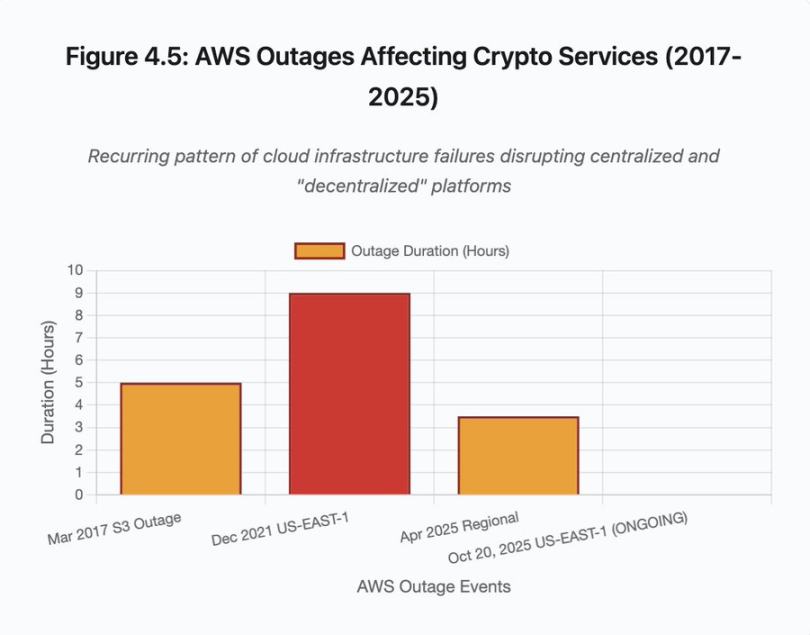
Figure 4.5: AWS outage affecting encryption services
The auto-scaling cloud infrastructure helped, but the response wasn't instantaneous: spinning up additional database read replicas took minutes. Creating new API gateway instances took several more minutes. During those minutes, the margin system continued to mark position values based on corrupted price data from the overloaded order book.
Oracle Manipulation and Pricing Vulnerabilities
During the October cascading events, a key design choice in the margin system became apparent: some exchanges calculated collateral values based on internal spot market prices rather than external oracle data feeds. Under normal market conditions, arbitrageurs maintain price consistency across venues. But when the infrastructure comes under stress, this coupling breaks down.
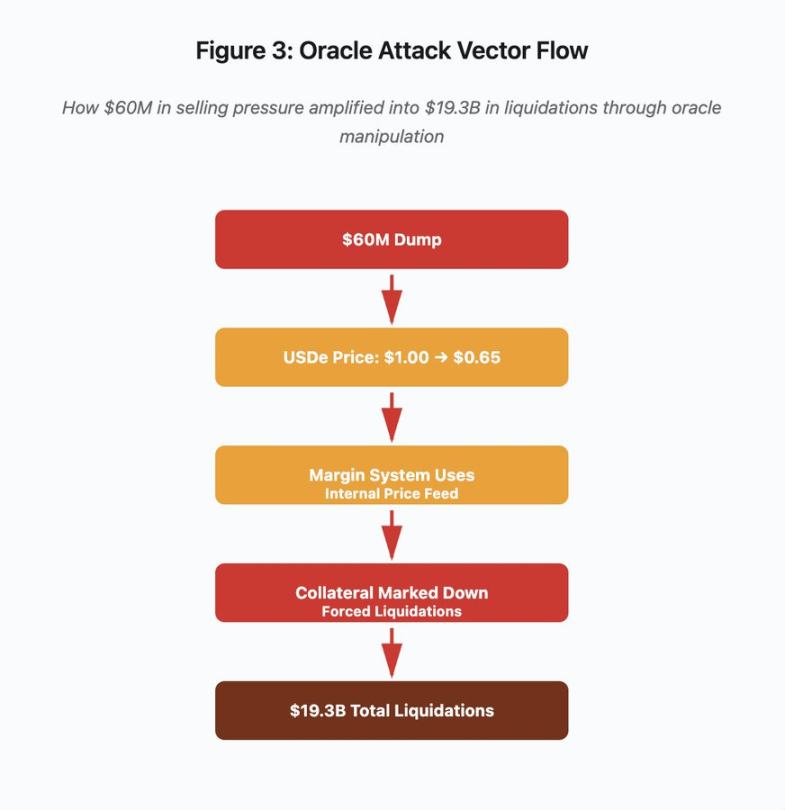
Figure 3: Oracle manipulation flow chart
This interactive flowchart visualizes the five-stage attack vector:
Initial sell-off: $60 million in selling pressure on USDe
Price Manipulation: USDe Plummets from $1.00 to $0.65 on a Single Exchange
Oracle failure: Margin system uses corrupted internal price feed
Chain trigger: Collateral is downvalued and forced liquidation begins
Zoom in: $19.3 billion in liquidations (magnified 322x)
The attack exploited Binance's use of spot market prices for wrapped synthetic collateral. When the attacker dumped $60 million in USDe into a relatively thin order book, the spot price plummeted from $1.00 to $0.65. The margin system, configured to mark collateral to the spot price, revalued all USDe-collateralized positions downward by 35%. This triggered margin calls and forced liquidations for thousands of accounts.
These liquidations forced more sell orders into the same illiquid market, further depressing prices. The margin system observed these lower prices and marked up the value of even more positions, a feedback loop that amplified $60 million in selling pressure into $19.3 billion in forced liquidations.
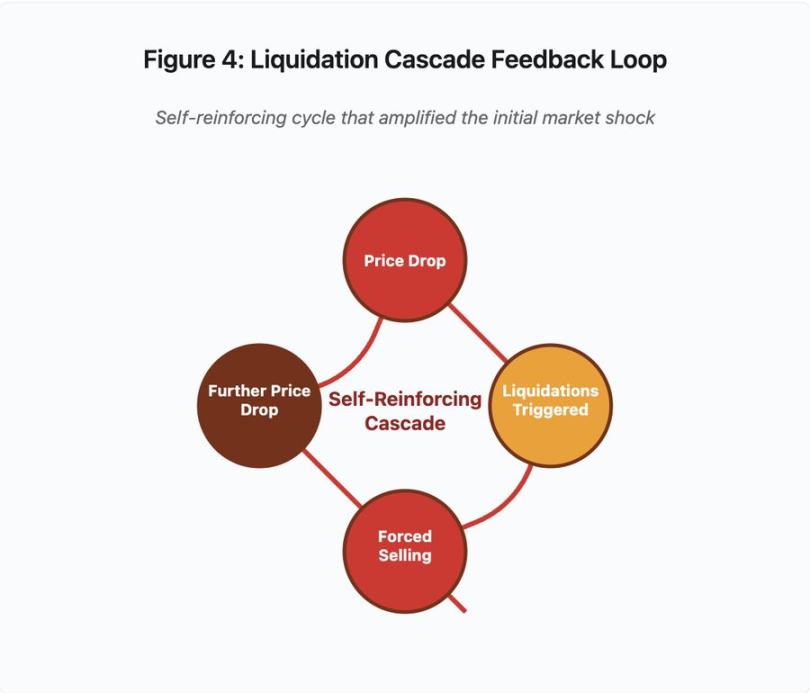
Figure 4: Liquidation chain feedback loop
This feedback loop diagram illustrates the self-reinforcing nature of the chain:
Price falls → triggers liquidation → forced sell → price falls further → [cycle repeats]
With a properly designed oracle system, this mechanism wouldn't work. If Binance had used a time-weighted average price (TWAP) across multiple exchanges, instantaneous price manipulation wouldn't have affected collateral valuations. If they had used an aggregated price feed from Chainlink or other multi-source oracles, the attack would have failed.
The wBETH incident four days ago demonstrated a similar vulnerability. wBETH is supposed to maintain a 1:1 exchange ratio with ETH. During the cascading event, liquidity dried up, and the wBETH/ETH spot market experienced a 20% discount. The margin system accordingly lowered the valuation of wBETH collateral, triggering the liquidation of positions that were effectively fully collateralized by the underlying ETH.
Automatic Deleveraging (ADL) Mechanism
When liquidations cannot be executed at the current market price, exchanges implement automatic liquidation (ADL) to distribute losses to profitable traders. ADL forces profitable positions to close at the current price to cover the shortfall in the liquidated position.
During the October cascading events, Binance executed ADLs on multiple trading pairs. Traders holding profitable long positions saw their trades forcefully liquidated, not due to their own risk management failures, but rather because other traders’ positions became insolvent.
ADL reflects a fundamental architectural choice in centralized derivatives trading. The exchange guarantees that it will not lose money. This means that losses must be borne by one or more of the following parties:
Insurance Fund (funds reserved by the exchange to cover liquidation shortfalls)
ADL (Forced Closing of Profitable Traders)
Socialized loss (spreading the loss across all users)
The size of the insurance fund relative to open interest determines the frequency of ADLs. Binance's insurance fund totaled approximately $2 billion in October 2025. This provided 50% coverage relative to the $4 billion in open interest on BTC, ETH, and BNB perpetual contracts. However, during the October cascading events, total open interest across all trading pairs exceeded $20 billion. The insurance fund was unable to cover the shortfall.
Following the October cascading events, Binance announced that it would guarantee against ADL on BTC, ETH, and BNB USDⓈ-M contracts as long as total open interest remained below $4 billion. This created an incentive structure: exchanges could maintain larger insurance funds to avoid ADL, but this would tie up funds that could be profitably deployed.
On-chain failures: The limitations of blockchain protocols
The bar chart compares downtime across different incidents:
Solana (February 2024): 5 hours - Voting throughput bottleneck
Polygon (March 2024): 11 hours - Validator version mismatch
Optimism (June 2024): 2.5 hours - Sequencer Overload (Airdrop)
Solana (September 2024): 4.5 hours - Transaction spam attack
Arbitrum (December 2024): 1.5 hours - RPC provider failure
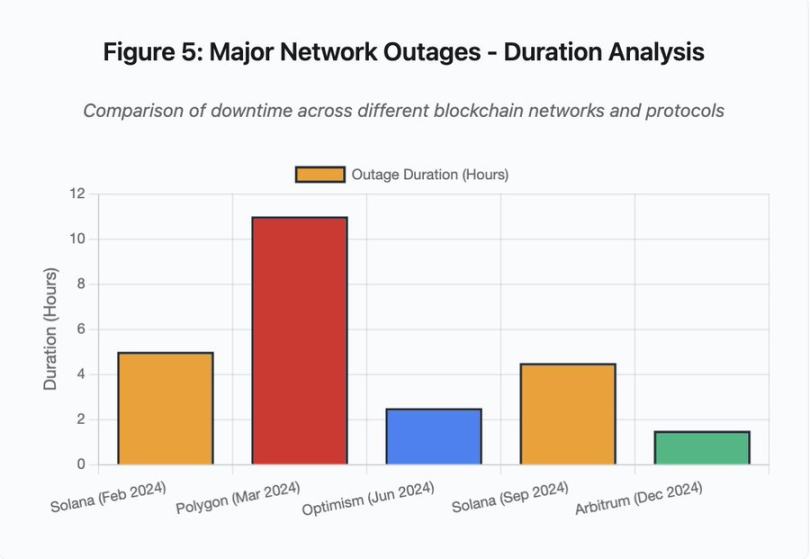
Figure 5: Major Network Outages - Duration Analysis
Solana: Consensus Bottleneck
Solana experienced multiple outages during 2024-2025. The outage in February 2024 lasted approximately 5 hours, and the outage in September 2024 lasted 4-5 hours. These outages stemmed from similar root causes: the network was unable to handle transaction volume during spam attacks or periods of extreme activity.
Figure 5 Details: Solana’s outages (5 hours in February, 4.5 hours in September) highlight the recurring problem of network resilience under stress.
Solana's architecture is optimized for throughput. Under ideal conditions, the network processes 3,000-5,000 transactions per second with sub-second finality. This performance is orders of magnitude higher than Ethereum. However, during stress events, this optimization creates vulnerabilities.
The September 2024 outage stemmed from a flood of spam transactions that overwhelmed the validator voting mechanism. Solana validators must vote on blocks to reach consensus. During normal operations, validators prioritize voting transactions to ensure consensus progress. However, the protocol previously treated voting transactions like regular transactions for its fee market purposes.
When the transaction mempool fills with millions of junk transactions, validators struggle to propagate voting transactions. Without sufficient votes, blocks cannot be finalized. Without finalized blocks, the chain stalls. Users with pending transactions see them stuck in the mempool. New transactions cannot be submitted.
StatusGator documented multiple Solana service outages in 2024-2025, which Solana never officially acknowledged. This created information asymmetry. Users couldn't distinguish between local connectivity issues and network-wide problems. Third-party monitoring services provide accountability, but the platform should maintain a comprehensive status page.
Ethereum: Gas Fee Explosion
Ethereum experienced extreme gas fee spikes during the 2021 DeFi boom, with simple transfers costing over $100 in fees. Complex smart contract interactions cost $500-1000. These fees made the network unusable for smaller transactions and enabled a different attack vector: MEV extraction.
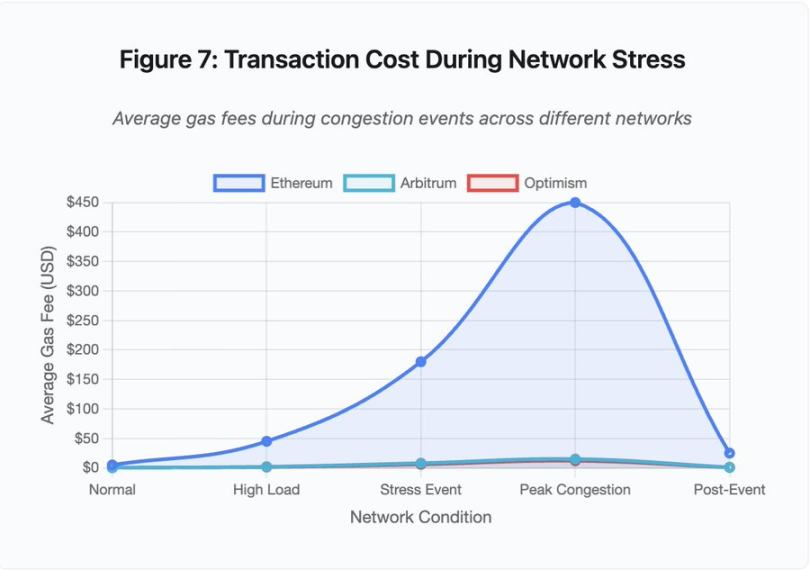
Figure 7: Transaction costs during periods of network stress
This line chart dramatically shows the gas fee escalation across networks during stress events:
Ethereum: $5 (normal) → $450 (peak congestion) — a 90x increase
Arbitrum: $0.50 → $15 – a 30x increase
Optimism: $0.30 → $12 – a 40x increase
The visualization shows that even Layer 2 solutions experience significant gas fee upgrades, albeit from a much lower starting point.
Maximum Extractable Value (MEV) describes the profit a validator can extract by reordering, including, or excluding transactions. MEV becomes particularly profitable in a high gas fee environment. Arbitrageurs compete to front-run large DEX trades, and liquidation bots compete to be the first to liquidate undercollateralized positions. This competition manifests as gas fee bidding wars.
Users who want to ensure their transactions are included during periods of congestion must outbid MEV bots. This creates a situation where transaction fees exceed the value of the transaction. Want to claim your $100 airdrop? Pay $150 in gas fees. Need to add collateral to avoid liquidation? Compete with bots paying $500 in priority fees.
Ethereum's gas limit restricts the total amount of computation per block. During periods of congestion, users bid for scarce block space. The fee market works as designed: the highest bidder gets priority. However, this design makes the network increasingly expensive during periods of high usage, precisely when users need access the most.
Layer 2 solutions attempt to address this problem by moving computation off-chain while retaining Ethereum's security through periodic settlements. Optimism, Arbitrum, and other Rollups process thousands of transactions off-chain and then submit compression proofs to Ethereum. This architecture successfully reduces the cost per transaction during normal operations.
Layer 2: Sequencer Bottleneck
But Layer 2 solutions introduce new bottlenecks. Optimism experienced an outage in June 2024 when 250,000 addresses simultaneously claimed an airdrop. The sequencer, the component that sorts transactions before submitting them to Ethereum, became overwhelmed, and users were unable to submit transactions for several hours.
The outage demonstrated that moving computation off-chain doesn't eliminate infrastructure requirements. Sequencers must process incoming transactions, order them, execute them, and generate fraud proofs or ZK proofs for Ethereum settlements. Under extreme traffic, sequencers face the same scaling challenges as standalone blockchains.
Multiple RPC providers must be available. If the primary provider fails, users should seamlessly failover to an alternative. During the Optimism outage, some RPC providers remained functional while others failed. Users whose wallets defaulted to connecting to the failed provider were unable to interact with the chain, even though the chain itself remained online.
AWS outages have repeatedly demonstrated the existence of concentrated infrastructure risks in the crypto ecosystem:
October 20, 2025 (today): An outage in the US East region affected Coinbase, as well as Venmo, Robinhood, and Chime. AWS acknowledged increased error rates for its DynamoDB and EC2 services.
April 2025: Regional outages affect Binance, KuCoin, and MEXC simultaneously. Multiple major exchanges become unavailable when their AWS-hosted components fail.
December 2021: An outage in the eastern United States region paralyzed Coinbase, Binance.US, and the "decentralized" exchange dYdX for 8-9 hours, while also affecting Amazon's own warehouses and major streaming services.
March 2017: An S3 outage prevented users from logging into Coinbase and GDAX for five hours, accompanied by widespread internet outages.
The pattern is clear: these exchanges host critical components on AWS infrastructure. When AWS experienced a regional outage, multiple major exchanges and services simultaneously became unavailable. Users were unable to access funds, execute trades, or modify positions during the outage—precisely when market volatility might require immediate action.
Polygon: Consensus version mismatch
Polygon (formerly Matic) experienced an 11-hour outage in March 2024. The root cause involved a mismatch in validator versions, with some validators running older software versions and others running upgraded versions. These versions calculated state transitions differently.
Figure 5 Details: The Polygon outage (11 hours) was the longest of the major events analyzed, highlighting the severity of the consensus failure.
When validators reach different conclusions about the correct state, consensus fails and the chain cannot produce new blocks because validators cannot agree on the validity of the blocks. This creates a deadlock: validators running the old software reject blocks produced by validators running the new software, and validators running the new software reject blocks produced by validators running the old software.
Resolution requires coordinated validator upgrades, but coordinating validator upgrades during an outage takes time. Every validator operator must be contacted, the correct software version must be deployed, and their validators must be restarted. In a decentralized network with hundreds of independent validators, this coordination can take hours or days.
Hard forks typically use a block height trigger. All validators upgrade by a certain block height to ensure simultaneous activation, but this requires prior coordination. Incremental upgrades, where validators gradually adopt a new version, risk creating an exact version mismatch that could disrupt Polygon.
Architectural Trade-offs
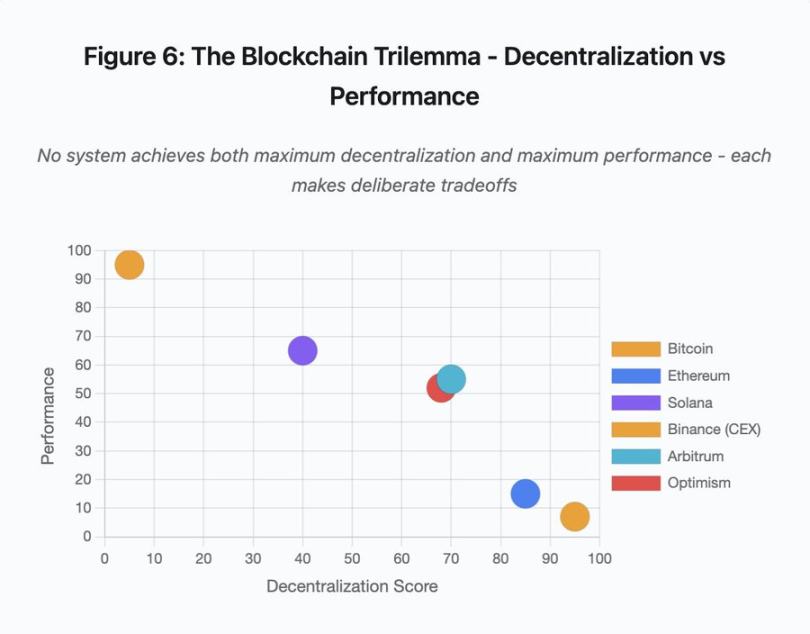
Figure 6: Blockchain Trilemma - Decentralization vs. Performance
This scatter plot visualization maps different systems onto two key dimensions:
Bitcoin: High decentralization, low performance
Ethereum: High decentralization, medium performance
Solana: Moderate Decentralization, High Performance
Binance (CEX): Minimum Decentralization, Maximum Performance
Arbitrum/Optimism: Medium-to-high decentralization, medium performance
Key Insight: No system can achieve both maximum decentralization and maximum performance; each design makes deliberate trade-offs for different use cases.
Centralized exchanges achieve low latency through architectural simplicity. Matching engines process orders in microseconds, and state resides in centralized databases. The lack of a consensus protocol introduces overhead, but this simplicity creates a single point of failure. When the infrastructure comes under pressure, cascading failures propagate through the tightly coupled system.
Decentralized protocols distribute state across validators, eliminating single points of failure. High-throughput chains maintain this property during outages (no funds are lost, only liveness is temporarily impaired). However, reaching consensus across distributed validators introduces computational overhead; validators must reach agreement before state transitions are finalized. When validators run incompatible versions or face overwhelming traffic, the consensus process can be temporarily halted.
Adding replicas improves fault tolerance but increases coordination costs. In a Byzantine fault-tolerant system, each additional validator increases communication overhead. High-throughput architectures minimize this overhead through optimized validator communication, achieving superior performance but being vulnerable to certain attack patterns. Security-focused architectures prioritize validator diversity and consensus robustness, limiting base-layer throughput while maximizing resiliency.
Layer 2 solutions attempt to provide both properties through a layered design. They inherit Ethereum's security properties through L1 settlement while providing high throughput through off-chain computation. However, they introduce new bottlenecks at the sequencer and RPC layers, demonstrating that architectural complexity creates new failure modes while solving some problems.
Scaling remains a fundamental issue
These events revealed a consistent pattern: systems provisioned for normal loads and then failed catastrophically under pressure. Solana handled regular traffic efficiently but collapsed when transaction volume increased by 10,000%. Ethereum gas fees remained reasonable until DeFi adoption triggered congestion. Optimism's infrastructure performed well until 250,000 addresses simultaneously claimed an airdrop. Binance's API functioned normally during normal trading but was throttled during the on-chain liquidation.
The events of October 2025 showcased this dynamic at the exchange level. During normal operations, Binance's API rate limits and database connectivity were sufficient, but during the liquidation cascade, when every trader simultaneously attempted to adjust their positions, these limits became a bottleneck. The margin system, designed to protect exchanges through forced liquidations, amplified the crisis by creating forced sellers at the worst possible moment.
Autoscaling provides insufficient protection against step-function-like increases in load. Spinning up additional servers takes minutes, and during those minutes, the margin system marks the value of positions based on corrupted price data from thin order books. By the time the new capacity comes online, the chain reaction has already propagated.
Overprovisioning resources for rare stress events costs money during normal operations. Exchange operators optimize for typical loads, accepting occasional outages as an economically justifiable option. The cost of downtime is externalized to users, who experience liquidations, stuck trades, or inability to access funds during critical market movements.
Infrastructure improvements
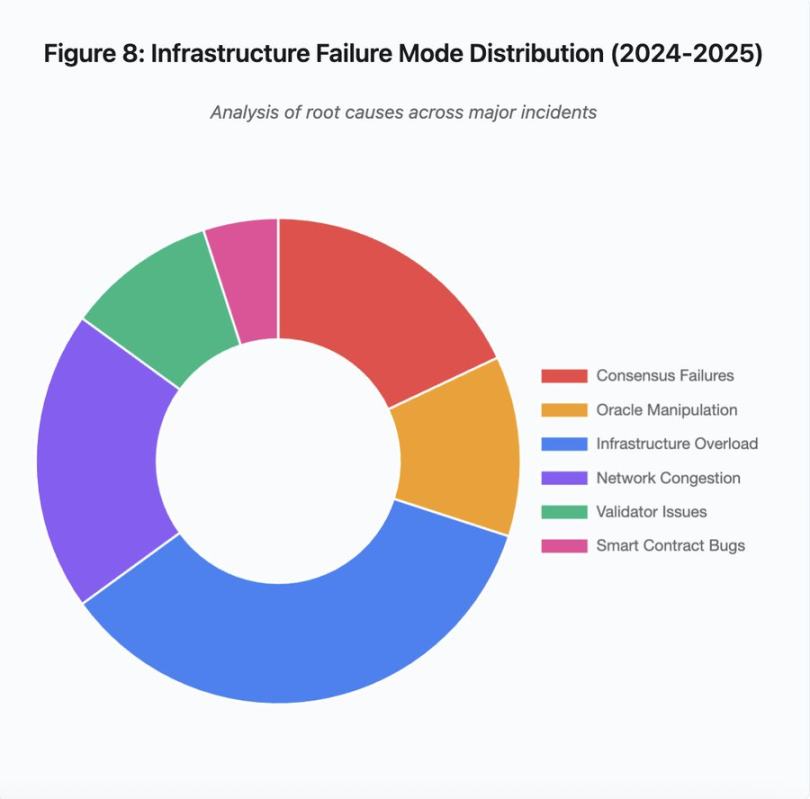
Figure 8: Infrastructure failure mode distribution (2024-2025)
The pie chart breakdown of the root causes shows:
Infrastructure overload: 35% (most common)
Network congestion: 20%
Consensus failure: 18%
Oracle manipulation: 12%
Validator issues: 10%
Smart contract vulnerabilities: 5%
Several architectural changes can reduce failure frequency and severity, although each involves trade-offs:
Separation of pricing system and clearing system
The October issue stemmed in part from coupling margin calculations to spot market prices. Using a redemption ratio for the wrapped asset rather than the spot price could have avoided the mispricing of wBETH. More generally, critical risk management systems should not rely on potentially manipulated market data. Independent oracle systems with multi-source aggregation and TWAP calculations provide more robust price data feeds.
Overprovisioned and redundant infrastructure
The AWS outage that affected Binance, KuCoin, and MEXC in April 2025 demonstrated the risks of centralized infrastructure reliance. Running critical components across multiple cloud providers increases operational complexity and costs, but eliminates correlated failures. Layer 2 networks can maintain multiple RPC providers with automatic failover. The additional cost may seem wasteful during normal operations, but it prevents hours of downtime during peak demand.
Enhanced stress testing and capacity planning
A system's pattern of functioning well until it fails indicates inadequate testing under stress. Simulating 100x normal load should be standard practice; identifying bottlenecks in development is less expensive than discovering them during a real outage. However, realistic load testing remains challenging. Production traffic exhibits patterns that synthetic tests cannot fully capture, and user behavior during a real outage differs from that during testing.
The way forward
Overprovisioning offers the most reliable solution but conflicts with economic incentives. Maintaining 10x excess capacity for rare events costs money every day to prevent a problem that occurs once a year. Until catastrophic failures impose sufficient costs to justify overprovisioning, the system will continue to fail under stress.
Regulatory pressure could force change. If regulations mandate 99.9% uptime or limit acceptable downtime, exchanges will need to overprovision. But regulations often follow disasters, not prevent them. The collapse of Mt. Gox in 2014 led to formal cryptocurrency exchange regulations in Japan. The chain reaction of events in October 2025 is likely to trigger a similar regulatory response. Whether these responses specify outcomes (maximum acceptable downtime, maximum slippage during liquidations) or how they are implemented (specific oracle providers, circuit breaker thresholds) is uncertain.
The fundamental challenge is that these systems operate continuously in global markets, yet rely on infrastructure designed for traditional business hours. When stress strikes at 02:00, teams scramble to deploy fixes while users face mounting losses. Traditional markets cease trading during stress; crypto markets simply collapse. Whether this represents a feature or a bug depends on perspective and perspective.
Blockchain systems have achieved remarkable technical sophistication in a short period of time. Maintaining distributed consensus across thousands of nodes represents a true engineering feat. However, achieving reliability under pressure requires moving beyond prototype architectures to production-grade infrastructure. This transition requires funding and prioritizing robustness over feature development speed.
The challenge is prioritizing robustness over growth during a bull market, when everyone is making money and downtime seems like someone else's problem. When the next cycle stress-tests the system, new weaknesses will emerge. Whether the industry learns from October 2025 or repeats a similar pattern remains an open question. History suggests that the next critical vulnerability will be discovered through another multi-billion-dollar failure under stress.