

Following a sharp correction from its $126,000 peak, Bitcoin is currently trading below $102,000. This price range is prompting concerns among investors that it could signal the start of a deeper downtrend.
However, historical data, technical indicators, and macroeconomic factors suggest that Bitcoin still has room to grow before the current bull cycle ends.
The Technical Structure Remains Bullish Despite the Correction
According to analyst Colin, Bitcoin’s (BTC) uptrend has not been broken as long as the price remains above the 50-week Simple Moving Average (SMA), despite slowing ETF inflows and limited liquidity. This key threshold separates bull and bear markets. Currently, Bitcoin hovers around this crucial level, with the 50-week SMA sitting near $102,000, which has historically provided strong support in previous post-halving cycles.
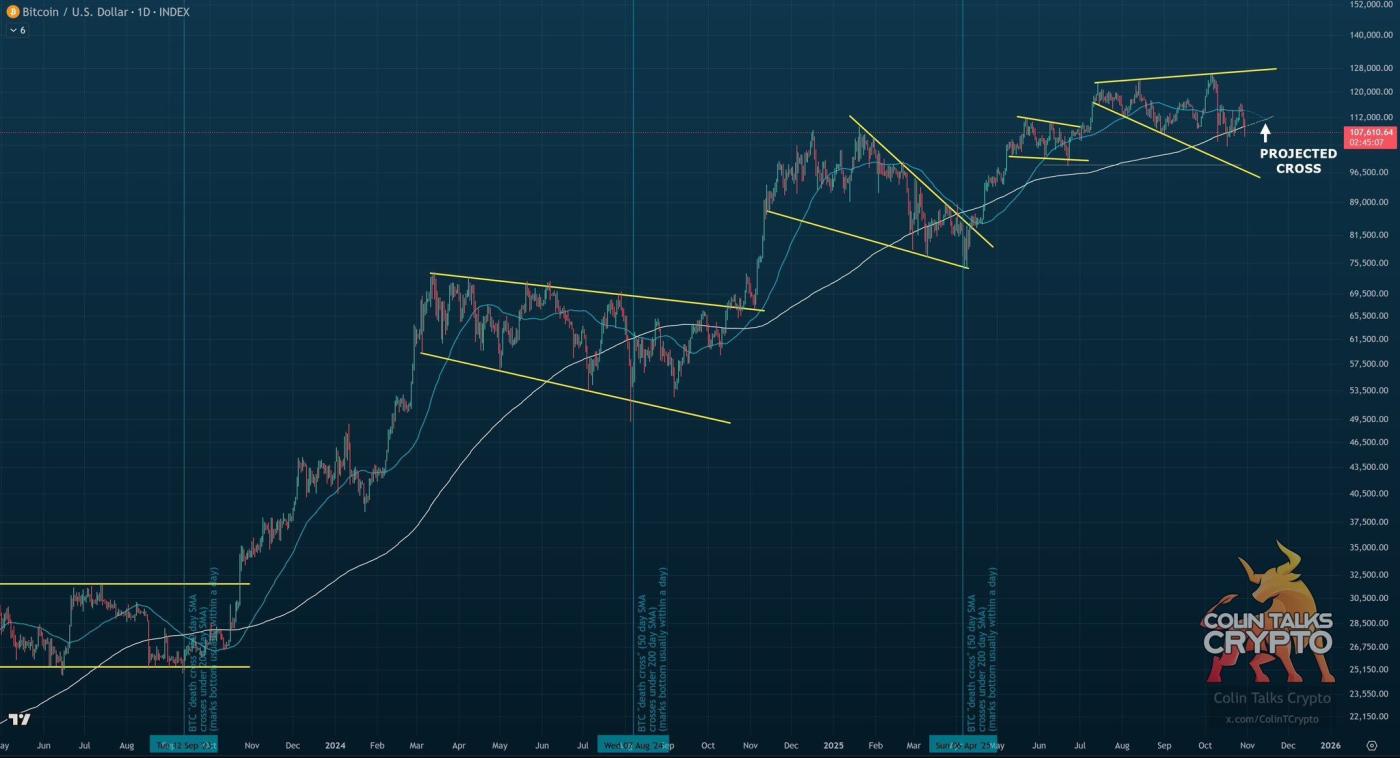 The 50-day SMA (blue line) and 200-day SMA (white line) are projected to intersect in mid-November — a signal that has marked most past local bottoms. Source: Colin.
Another analysis reinforces this view. Each time Bitcoin has touched the 50-week SMA during past bull runs, it has rebounded strongly to retest or surpass previous highs, without closing a weekly candle below this level. This pattern emerged in both the 2016-2017 and 2020-2021 cycles, where deep pullbacks launched the next leg higher.
Analyst Lark Davis emphasized that as of November 7, Bitcoin was trading around $103,400, holding above the same SMA that has supported the uptrend since 2023. He called this level the “line in the sand”, warning that a weekly close below it could lead to a steep 60% correction toward $40,000, based on model projections.
“We’re sitting right at the 50-week SMA – the line in the sand. If we close below, things could get complicated,” Lark cautioned.
Meanwhile, Scott Melker provided a historical perspective: Bitcoin has only lost the 50-week SMA support four times (in 2014, 2018, 2020, and 2022), each time leading to a retest of the 200-week SMA, signaling a prolonged bearish phase. Since Bitcoin has not yet closed below the $102,000 region, the potential for recovery remains.
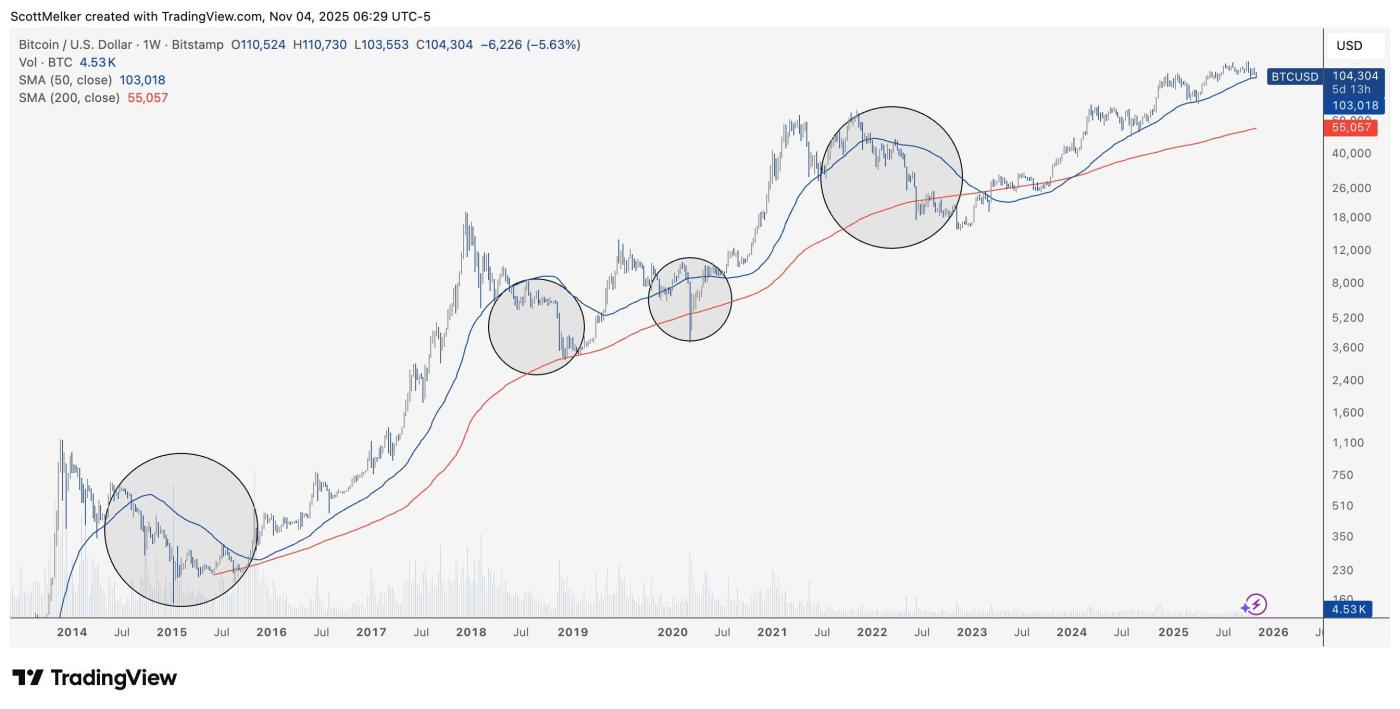 BTC/USD 1W chart. Source: X
In short, these signals suggest that Bitcoin’s technical structure still favors an uptrend but warrants caution. A solid weekly close above $106,000 could confirm a rebound, paving the way for a retest of the $120,000-$125,000 zone.
Macroeconomic Conditions Still Support the Bitcoin Uptrend
Beyond technical charts, macroeconomic factors are increasingly aligning in Bitcoin’s favor. According to Colin, one major reason selling Bitcoin now would be a mistake is the shifting monetary policy backdrop. This backdrop is particularly influenced by signals of an end to Quantitative Tightening (QT) and the potential for the Fed to cut rates.
Data compiled by analyst Brett shows that in 2019, when the US Federal Reserve ended QT and began lowering interest rates, Bitcoin and Ethereum initially fell by 35% and 45%, respectively, before rallying strongly as Quantitative Easing (QE) resumed in early 2020.
The current macro setup bears striking similarities. Analyst Momin noted that QT appears to be ending, and rate cuts could return within the next few quarters, a shift that could inject liquidity back into risk assets, such as Bitcoin.
“With signs of QT ending & more rate cuts to come… there are good odds we see $BTC go higher till the end of Q4,” he remarked.
Colin also predicts that Bitcoin could resume its uptrend by mid-November, citing cyclical indicators that often precede new growth phases. He further anticipates a decline in Bitcoin Dominance (BTC.D) over the next 1-3 weeks, potentially signaling the start of an altseason —a period when altcoins outperform after Bitcoin stabilizes near a significant support level or a cycle high. However, to date, only three of the 55 major altcoins have outperformed BTC.
“My guess for a Bitcoin price top is $140K-$180K in early 2026. This seems reasonable to me,” Colin added optimistically.
In conclusion, if the Federal Reserve pivots toward monetary easing and global liquidity expands, Bitcoin could mirror the 2020 scenario, where macroeconomic liquidity became the primary driver of the bull market. However, policy effects often lag, meaning the market’s reaction may take several weeks to materialize.


