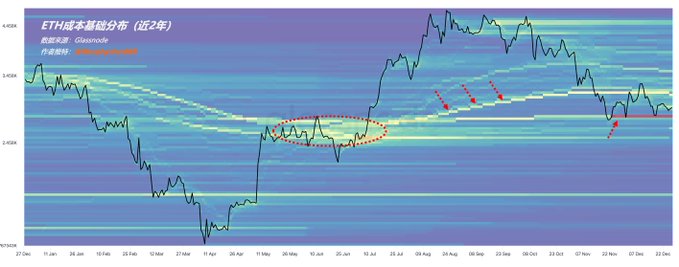
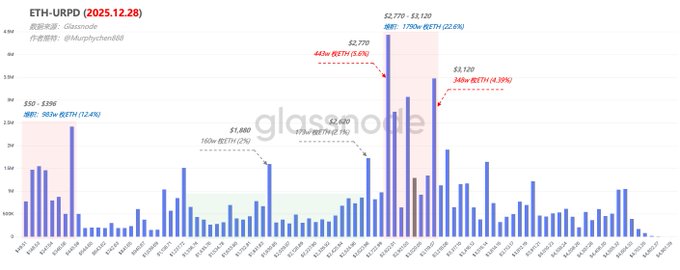
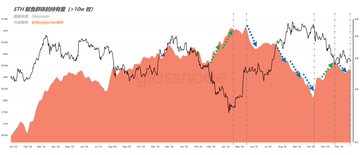
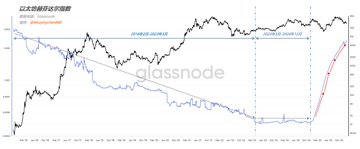
Is ETH still worth looking forward to in 2026? —— Year-End Data Analysis & Summary (Long Read) By popular demand, I've sorted through the latest ETH data and summarized two key areas you might care about: "Fundamental Analysis" and "Bottom Structure Assessment." Today, let’s start with the fundamentals, breaking down on-chain behavior, holder distribution, whale activity, and concentration. TL;DR: The real issue with ETH right now isn’t overhead resistance, but the fragmented structure below. $2700 is one of the few consensus support zones left—if it breaks, we’re entering a price vacuum with no clear anchor. But the major whales aren’t giving up—just getting more cautious. Holder concentration is still climbing fast, signaling systematic accumulation. Institutionalization/capitalization is the right direction, but the road is bumpy. Details below: ------- Main Content ------- 1. On-chain Behavior ETH-CBD data shows that around Sept 18, a ton of capital bought in at ~$4500. When ETH spiked on Dec 6, these holders didn’t sell, and as ETH dumped, they started capitulating. This left the $3300-$4500 band with a super even distribution—no strong hands, no aggressive bottom-fishers. (Figure 1) Worth noting: there’s a heavy bagholder cluster around $3100, but tracking their behavior, these are whales who DCA’d in at $2600-$2700 back in May-July and kept adding. Their average is now $3100. So, logically, these are long-term players, not sweating short-term price moves. If ETH breaks out, $3100 isn’t likely resistance. But if ETH nukes, will they paper hand? Unclear. Also, around Nov 23, big money aped in at $2700-$2800, creating a thick red accumulation zone—no signs of them offloading yet. ----------------------------------- 2. Holder Distribution Right now, ETH’s most stacked zone is $2700-$3100—17.9M ETH, 22.6% of circulating supply. That’s huge. $2700 is the single fattest column—4.43M ETH swapped hands there; same at $3100. From on-chain behavior, $3100 isn’t much of a ceiling, but $2700 is solid support. ETH is ranging here, and some institutional “consensus” is holding the line (absorbing sell pressure). (Figure 2) But for those familiar with BTC’s holder distribution, there’s a red flag for ETH: 🚩 The biggest accumulation zone under $2700 is $50-$396, holding 9.83M ETH (12.4%). That leaves a massive void between $396-$2700—no double-anchor structure. 🚩 If ETH loses $2700, price can drift anywhere in that gap. The next likely stop? The $1800-$2600 dead zone. 🚩 The problem for ETH isn’t bagholders above, but too much profit below still sitting (45.7M ETH). There’s almost 10M ETH in the $50-$396 band, and the rest is scattered. Bottom line: below $2700, there’s no clear structural support—the unknown is the scariest part. ----------------------------------- 3. Whale Activity Among ETH whales, wallets holding >100K ETH are this cycle’s “smartest money.” For example, when ETH dropped from $2700 to $1500 (Feb-April), these guys were the main buyers. (Figure 3) When ETH bounced to $3500, they started dumping—right at the local tops (Aug-Oct). Then, as ETH retraced to $2700 on Nov 21, they started stacking again. Not perfect bottom/top ticks, but their timing is elite. Makes you wonder: are they just good, or do they set the tempo? Lately, their buy pace is slowing, and total holdings are still below April’s peak. From their moves, my take: whales are “long-term bullish, short-term cautious.” ----------------------------------- 4. Holder Concentration The Herfindahl–Hirschman Index (HHI) measures market concentration—high HHI = monopoly, low HHI = competition. On Glassnode, HHI doesn’t track exchange market share, but ETH supply concentration—i.e., is ETH getting more centralized in whale hands, or more spread out? (Figure 4) 🚩 Phase 1: Early 2016 - Mar 2023 (7 years), HHI trended down. ICOs, DeFi, NFTs, airdrops, miners, CEX liquidity—all mechanisms to distribute ETH from early holders to more participants. Price gains here came from “new entrants,” not “token re-accumulation.” 🚩 Phase 2: Mar 2023 - Dec 2024, HHI flatlines in a tight range. Structurally, most sellers are out, but no systemic re-accumulation yet. Price stabilizes, no more wild swings. 🚩 Phase 3: Late 2024 - now, the key shift—HHI goes near parabolic as price dumps. This means weak hands panic sold, and whales scooped it all up. Back in March, I first called this “distribution to reaccumulation”/strong shakeout phase. The spike in HHI shows systematic ETH absorption is on. After ETH hit $1500 in April, it ripped hard—and this rally wasn’t “retail driven,” but “concentration driven.” Looks like ETH is copying BTC’s script: “mature asset → institutionalization → long-cycle pricing power shift.” ----------------------------------- Final Thoughts: The macro trend is bullish, but the ride will be rough. If the ETH ecosystem can’t generate enough burn, total ETH supply could be uncapped—so it’s up to Ethereum to create bigger narratives and lock liquidity with stronger conviction. Because, as the data shows, there’s still a ton of profit below that hasn’t been flushed out. At key moments this cycle, every ETH pump sees big wallets taking profit. Right now, DAT and ETF inflows alone aren’t enough. So for us regular investors: where is ETH actually high value for bottom-fishing? Stay tuned for the next thread! ----------------------------------- Bitget VIP: Lower fees, bigger perks.
This article is machine translated
Show original

Murphy
@Murphychen888
12-28
有小伙伴要看ETH的数据吗?
最近的重点都在BTC,一直没时间看ETH。也是因为在当前的大环境下,ETH不太可能走出独立行情。还得看大饼脸上。如果感兴趣的小伙伴比较多,我今天可以开始整理数据,主要想分2篇来写:
1、基本面:筹码结构、大户持仓、链上行为、集中度;
From Twitter
Disclaimer: The content above is only the author's opinion which does not represent any position of Followin, and is not intended as, and shall not be understood or construed as, investment advice from Followin.
Like
Add to Favorites
Comments
Share
Relevant content