

During November, the crypto market experienced a rapid decline due to large-scale outflows from ETFs and a concentrated clearing of leverage and high-beta risks, leading to a significant contraction in risk appetite. However, entering December, the Fed's interest rate cut, the formal exit from quantitative tightening, and improved short-term liquidity conditions propelled the market from a "passive risk-reduction" phase to a "recovery phase constrained by costs and liquidity." Ultimately, price stabilization stemmed more from the formation of support levels than from a recovery in upward momentum.
The core characteristic of the current market lies in the reconfirmation of the value center, rather than the selection of a directional trend. The holding costs of Bitcoin spot ETFs are highly concentrated in the $80,000–$85,000 range, coupled with the dense distribution of on-chain tokens and the long-term allocation attributes of institutional investors, providing clear downside support for prices. Meanwhile, the yield curve remains steep due to constraints from fiscal supply and term premiums, making it difficult for long-term interest rates to fall significantly, thus suppressing the potential for valuation expansion in risk assets. Under this combination of "short-term support and long-term constraints," crypto assets exhibit a range-bound trading pattern with upward pressure and downward support.
From an asset allocation perspective, we believe that prioritizing risk management and maintaining a neutral to defensive risk exposure structure is more suitable at this stage. Bitcoin remains the best core asset after risk adjustment, with its ETF cost zone, shareholding structure, and institutional holding stability forming key anchors for its price. In contrast, Ethereum and some mainstream altcoins offer structural opportunities, but in the absence of clear liquidity expansion or policy catalysts, they are more suitable as a phased rotation allocation rather than a direction for active position building.
Looking ahead to 2026, the core game in the crypto asset market will continue to revolve around whether the US economy achieves a soft landing and the evolution of the inflation path. Essentially, this is a judgment on how the Federal Reserve's policy function will be repriced under the "growth-inflation" constraint. Before macroeconomic uncertainties are eliminated, the market is more likely to consolidate its value center by trading time for space; a genuine trend-driven market will depend on clearer liquidity expansion or policy signals.
November's sharp decline: a typical example of liquidity withdrawal and valuation restructuring
In November, the entire crypto market faced significant downward pressure, continuing the liquidation-level decline from October. The total market capitalization of cryptocurrencies fell by 15.43% in November, closing at approximately $2.8 trillion at the end of the month, a sharp drop from $4.2 trillion in October.
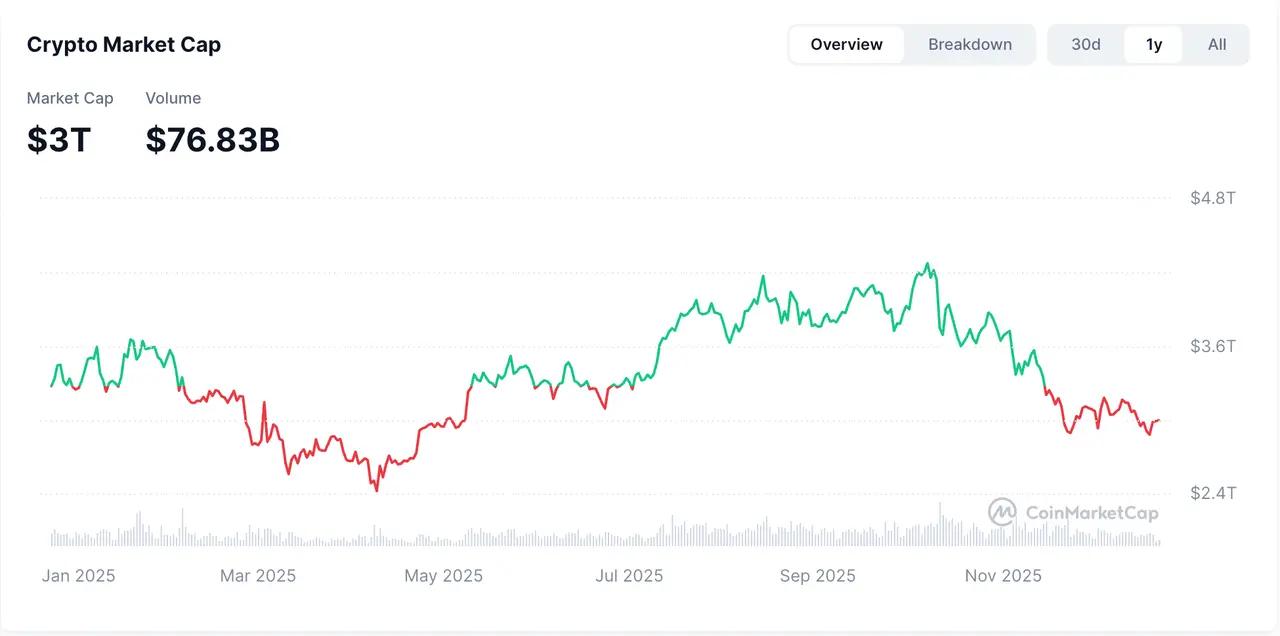
Figure 1. Total Market Capitalization of Cryptocurrencies (from CoinMarketCap)
BTC, a market bellwether, fell 16.7% to around $87,000, with its market share dropping to 58.7%. ETH fell 21.3% to below $2,900, with its market share dropping to 11.6%. Altcoin performed even worse: Solana fell 28.5% despite ETF inflows, and other major cryptocurrencies such as BNB (-19.6%) and XRP (-14.5%) reflected a broader risk aversion.
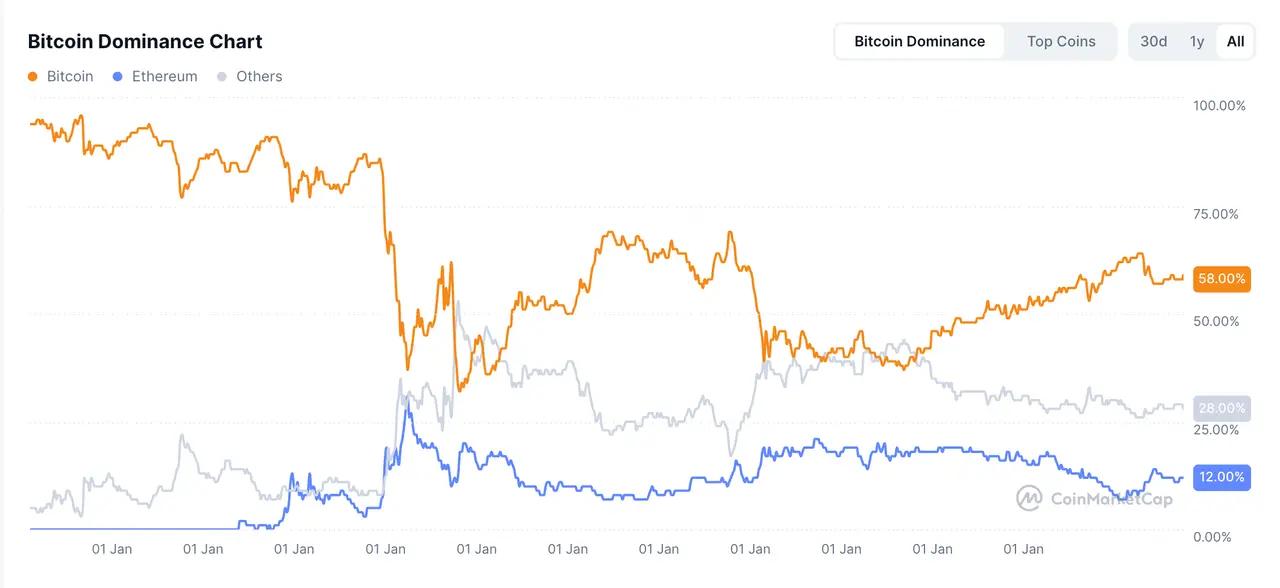
Figure 2. Changes in BTC and ETH market share (from CoinMarketCap)
DeFi TVL contracted by 16.8% to $130 billion, impacted by stablecoin de-pegging and liquidity losses caused by hacks targeting projects like Balancer. Stablecoin market capitalization fell 0.37%, its first decline since 2022 (currently totaling approximately $287 billion), indicating slower inflows of new funds, tighter overall liquidity, and decreased investor risk appetite.
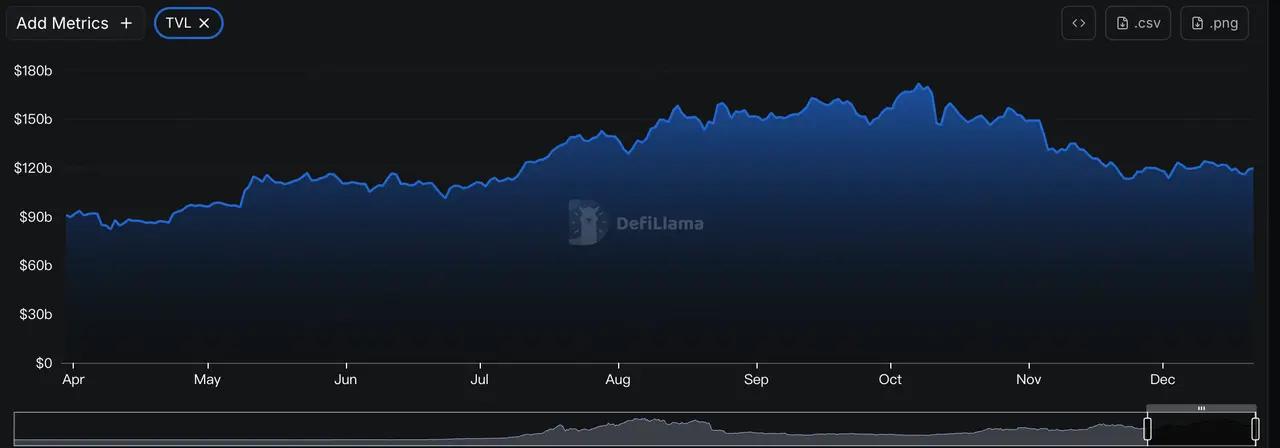
Figure 3. Total TVL of DeFi (from DefiLlama)
The spot BTC ETF experienced its largest monthly outflow since its inception, exceeding $3.5 billion, with a weekly peak outflow of nearly $1 billion. In contrast, newly launched Altcoin ETFs (SOL, XRP) attracted inflows, but their overall fund size was smaller compared to mainstream ETFs such as BTC and ETH.
This round of correction was not triggered by a single risk event, but rather by the combined effects of macro liquidity expectations, institutional position adjustments, and the contraction of valuations of high-beta assets, reflecting a typical "deleveraging-premium" process.
December Rebound: Liquidity Support for a Sharp Drop to a Period of Consolidation
In December, the market entered a recovery phase, rebounding from the bottom to range-bound trading. As of December 20, BTC was close to $88,000 and ETH was around $2,950. Major Altcoin such as Solana and XRP rebounded weakly, hitting new lows before bottoming out in mid-December. Currently, their trends remain stable. The Fear & Greed Index has risen to 25 (fear), indicating that the market still lacks confidence. The weak performance of altcoins also reflects the gradual deterioration of market liquidity after the large-scale liquidation on October 11.
Thanks to the gradual return of investors after the market stabilized, the supply of stablecoins tended to stabilize in December, with a 30-day growth of about 1.72%, ending the downward trend in November. On-chain TVL gradually stabilized and rebounded slightly. Net outflows from BTC and ETH ETFs slowed down and recorded continuous small inflows, indicating that ETF funds have shifted from withdrawal to reallocation.
This recovery was driven by seasonal factors (December has historically been a month of year-end rebound) and supported by the Fed’s rate cut and lower-than-expected inflation data, which further boosted market risk appetite. This is a confirmation process around the value center, rather than the start of a trend-driven rise.
Macroeconomics: Steepening Yield Curve and Short-Term Liquidity Support
The US economy is projected to experience a K-shaped recovery by 2025, with tech giants driving significant profit and market capitalization growth through AI investments, while low-income groups face stagnant wages and job losses. GDP growth is projected at 1.9% in 2025 and approximately 2.0% in 2026. However, signs of a cooling labor market are evident, with the unemployment rate rising to 4.6% in November, the highest since 2021. Non-farm payrolls increased by only 64,000, below expectations, with October's figure revised to -105,000. The labor force participation rate remains at 62.5%, but the increase in involuntary part-time employment has partially supported the employment-to-population ratio while also exposing underlying structural weaknesses in the labor market.
The recent steepening of the US Treasury yield curve (especially the 2Y/10Y and 3M/10Y term spreads) reflects the market's repricing of future policy paths, fiscal conditions, and economic fundamentals. This steepening is mainly driven by expectations of interest rate cuts at the front end, but long-term yields are constrained by rising term premiums and fiscal supply pressures, resulting in an atypical steepening characteristic of the yield curve: a bullish front end and a bearish back end.
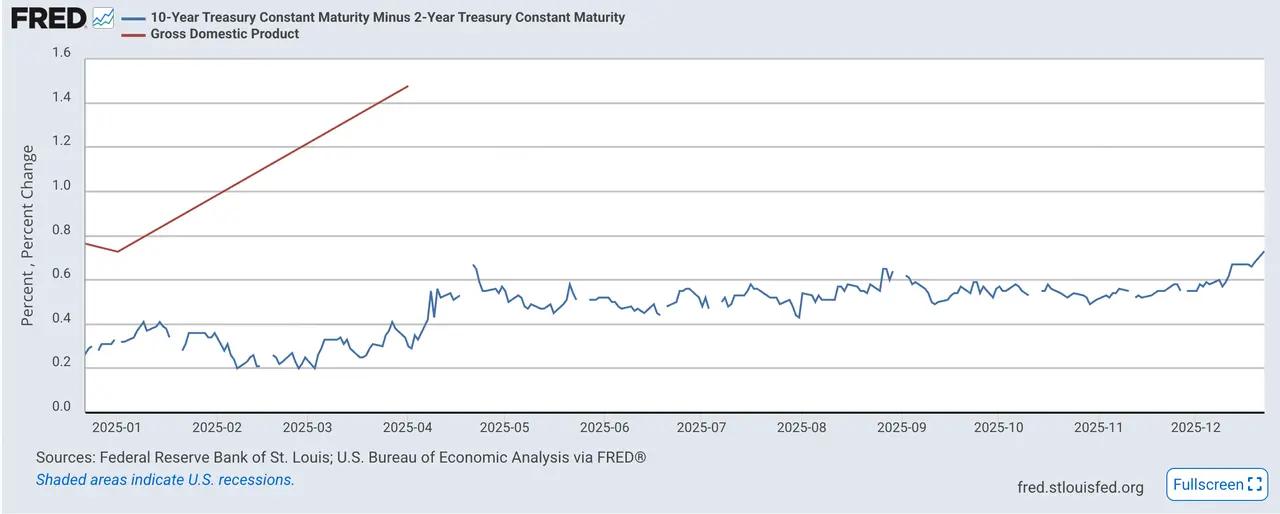
Figure 4. Difference between 10-year and 2-year Treasury yields (from FRED)
Key driving factors include:
The decline in expectations for rate cuts in 2026-2027 – the Fed's dot plot suggests only one additional 25bp rate cut in 2026;
The pressure of a huge fiscal deficit – the federal deficit will reach $1.8 trillion in fiscal year 2025, accounting for 5.9% of GDP, with a deficit of $173 billion in November alone;
Structural inflation concerns – The latest inflation data shows that the November CPI rose 0.3% month-on-month and 2.7% year-on-year, while the core CPI rose about 2.6% year-on-year. If confounding factors are excluded, inflation stickiness still exists.
In terms of liquidity, the Federal Reserve ended quantitative easing (QT) on December 1st, halting a nearly three-year balance sheet contraction process. The exit from QT marks the end of the liquidity tightening cycle. Simultaneously, the Fed announced the resumption of short-term Treasury purchases starting December 12th, initially at approximately $40 billion per month, potentially adjusting to $20-25 billion per month after the 2026 tax season. Officials emphasized that this is technical reserve management (RMP), not stimulative QE, aimed at preventing liquidity tightening and maintaining control over short-term interest rates. Considering the scale, purchase targets, and current fiscal policy, overall short-term market liquidity will improve. However, since RMP cannot suppress long-term yields, the valuation expansion of risky assets will be limited, creating a current "dilemma" of limited upside potential and temporary downside support in the market.
Specifically, looking at liquidity indicators: as of December 18, the Treasury's TGA account balance was $86.1 billion, a decrease from the previous period, releasing funds into the market; commercial bank reserves were approximately $2.94 trillion, showing a significant rebound since December, indicating an improvement in interbank dollar liquidity. Regarding key interest rates, the SOFR-IORB ratio also fell from its previous high, indicating a slight easing of the persistently tight liquidity situation.
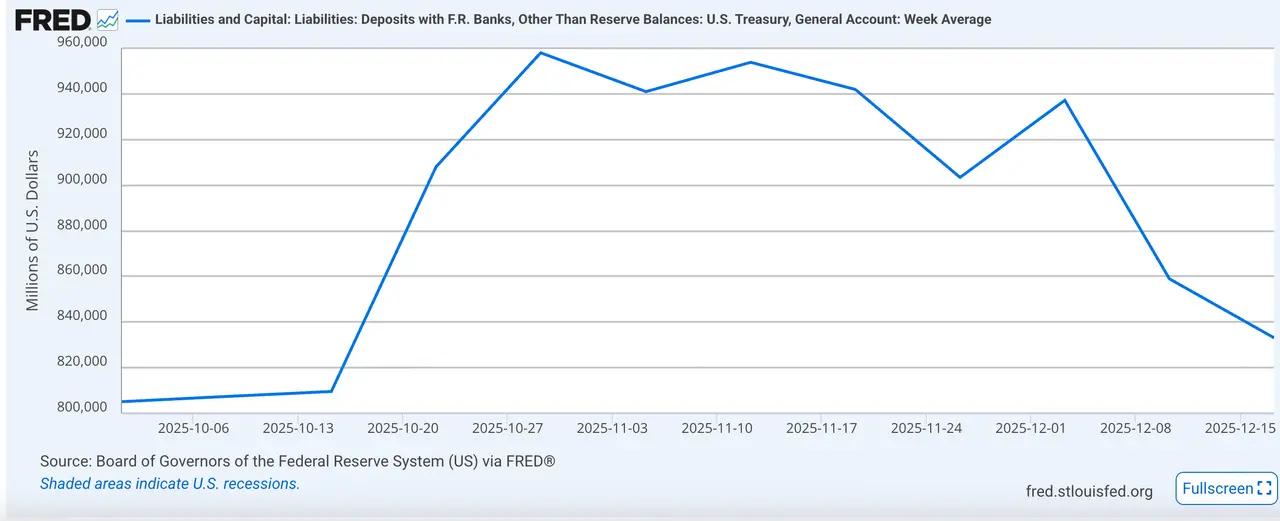
Figure 5. TGA Balance (from FRED)
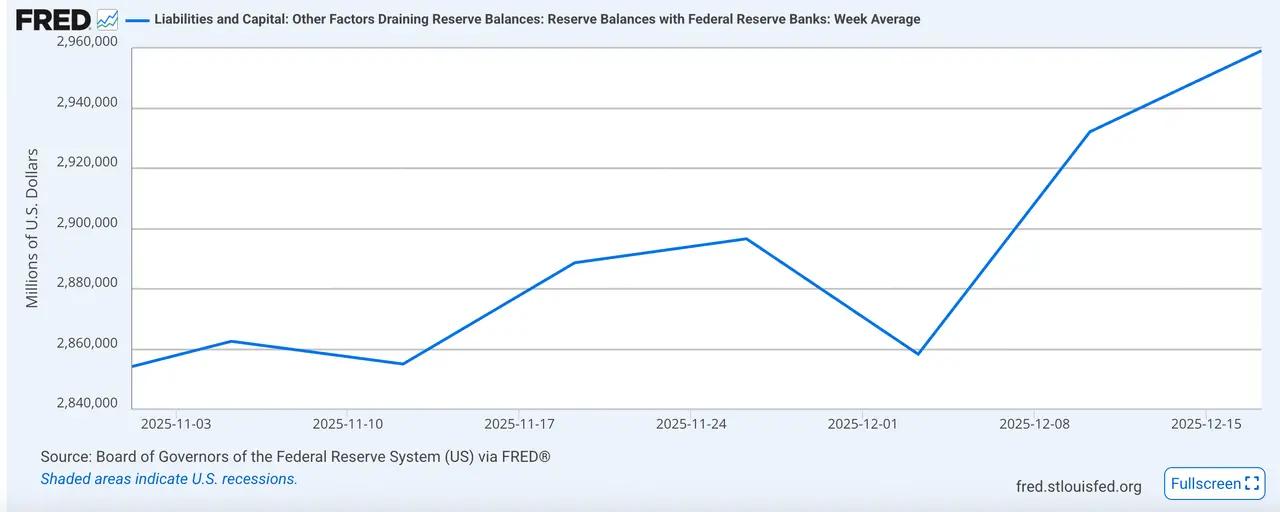
Figure 6. Commercial Bank Reserves (from FRED)
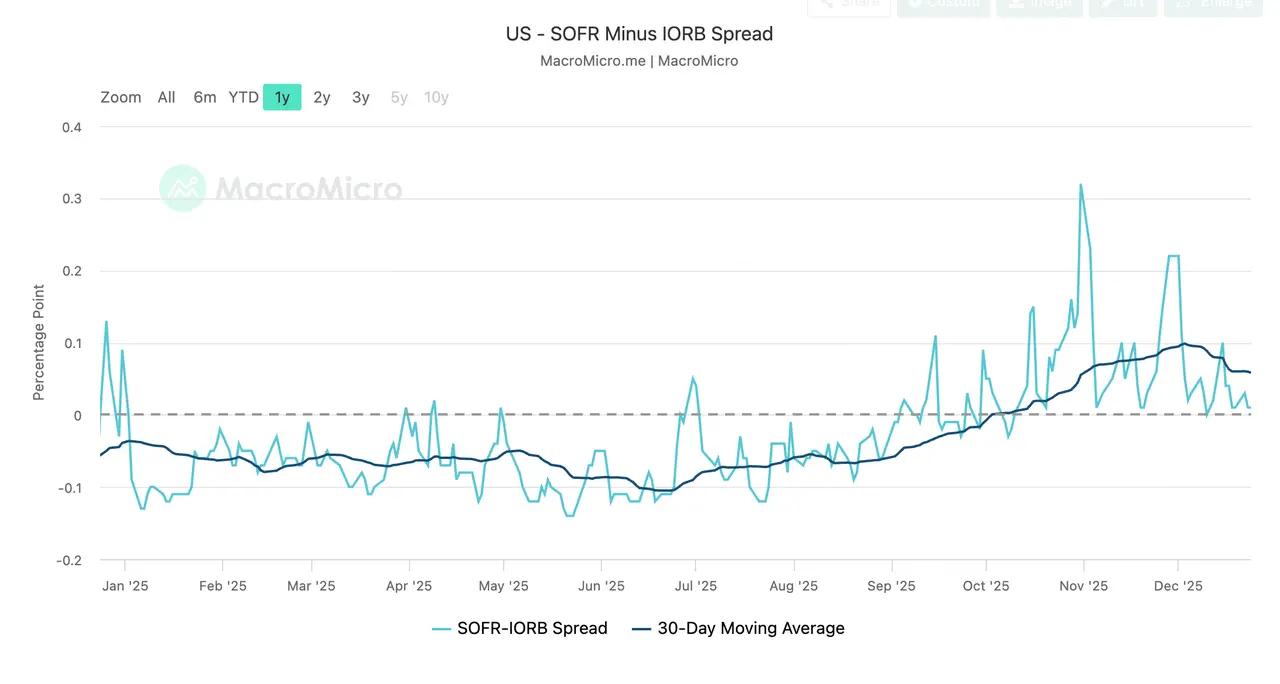
Figure 7. SOFR - IORB Spread (from MacroMicro)
Bitcoin: Value Reconstruction with Resistance Above and Support Below
Bitcoin plunged to around $80,000 in November and recovered to around $88,000 in December. The lows have gradually risen, but volatility has narrowed. The rebound is expected to continue, and a wide trading range of $80,000 to $94,000 has formed.
In November, BTC ETFs experienced a net outflow of $3.5 billion, becoming the main trigger for the rapid price decline that month. Entering December, the outflow from BTC ETFs slowed, with several consecutive days of small net inflows. As of December 12th, the monthly net inflow exceeded $200 million, marking a shift in the market from passive risk-averse to institutional reallocation. In November, ETH ETFs saw a net outflow of $1.4 billion, but in December, they experienced a net inflow of $120 million. Although the overall inflow was smaller than that of BTC ETFs, this reversal reflects the resilience of demand for ETH within this range.
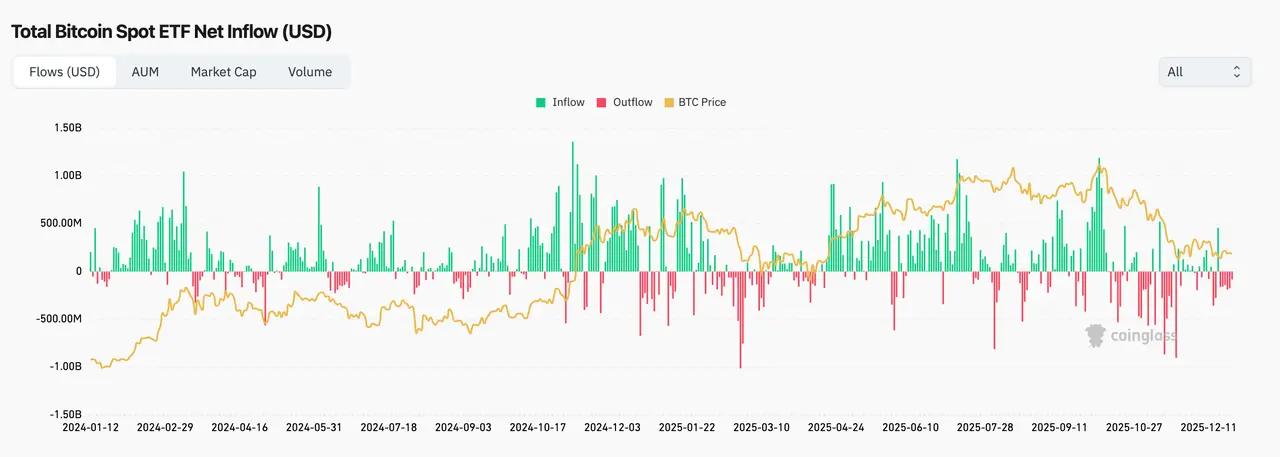
Figure 8. Net Inflows and Outflows of BTC Spot ETFs (from coinglass)
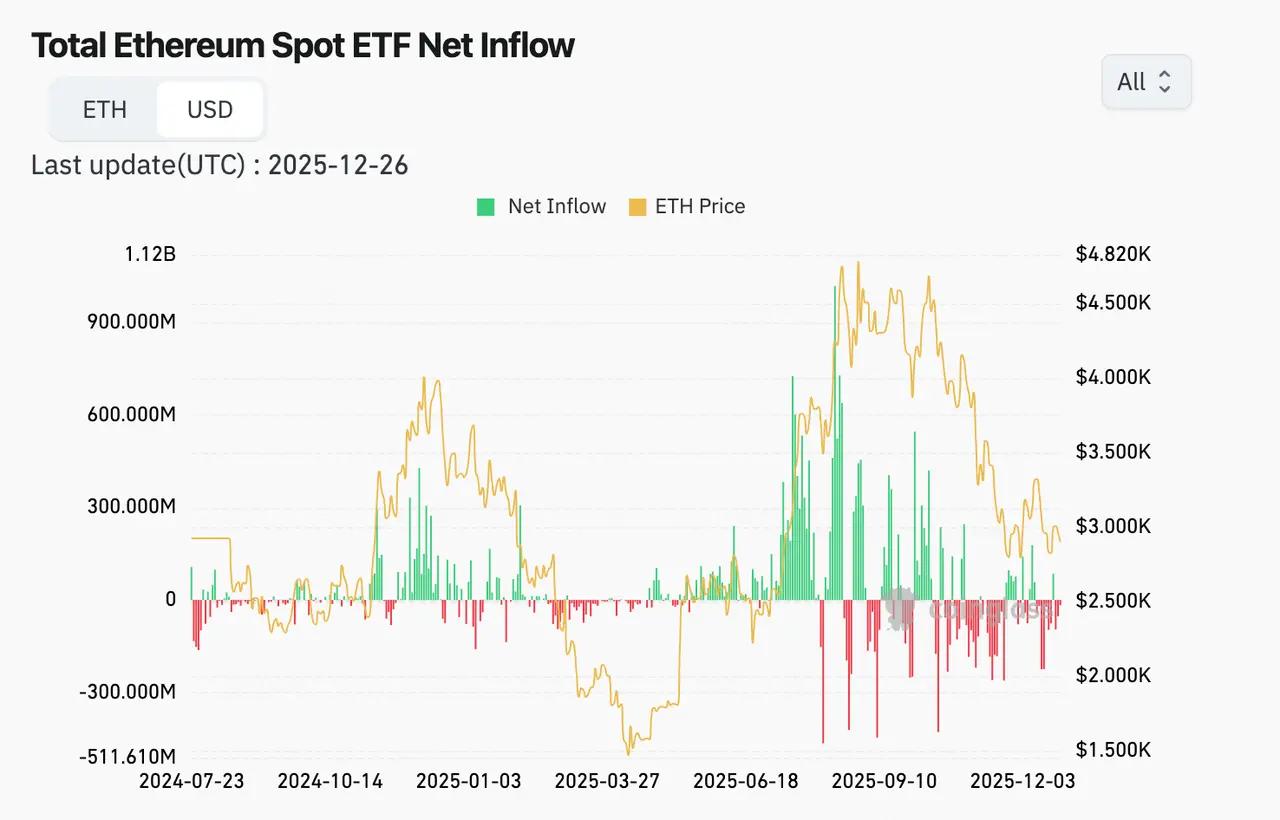
Figure 9. Net Inflows into ETH Spot ETFs (from coinglass)
On-chain data shows that the current BTC price structure shows a significant accumulation in the $80,000-$85,000 range. This price level also represents the consolidation and recovery range of the past month, corresponding to the cost basis of a large influx of short- to medium-term holders and institutional ETFs. While holders have limited unrealized profits, there has been no large-scale selling, indicating strong support at this level. If the price effectively stabilizes above this range, it can be seen as a signal of restored bullish confidence, potentially leading to a further challenge of the $90,000-$95,000 resistance level.
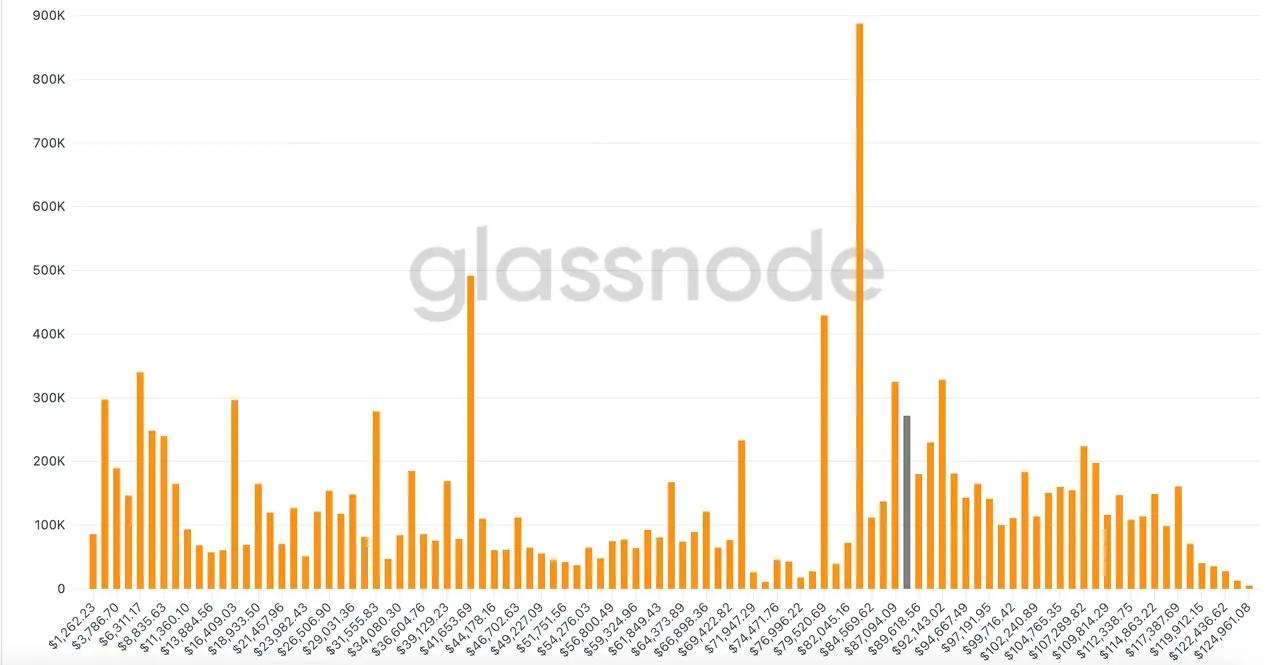
Figure 10. BTC chip distribution structure (from glassnode)
On-chain data for ETH also shows a similar chip structure, with a large amount of chips accumulating in the $2,800-$3,100 price range. Above $3,500, there are some trapped chips forming upward pressure. The huge accumulation of chips on both sides makes it difficult for the price to show a clear trend in the short term without sufficient triggering factors.
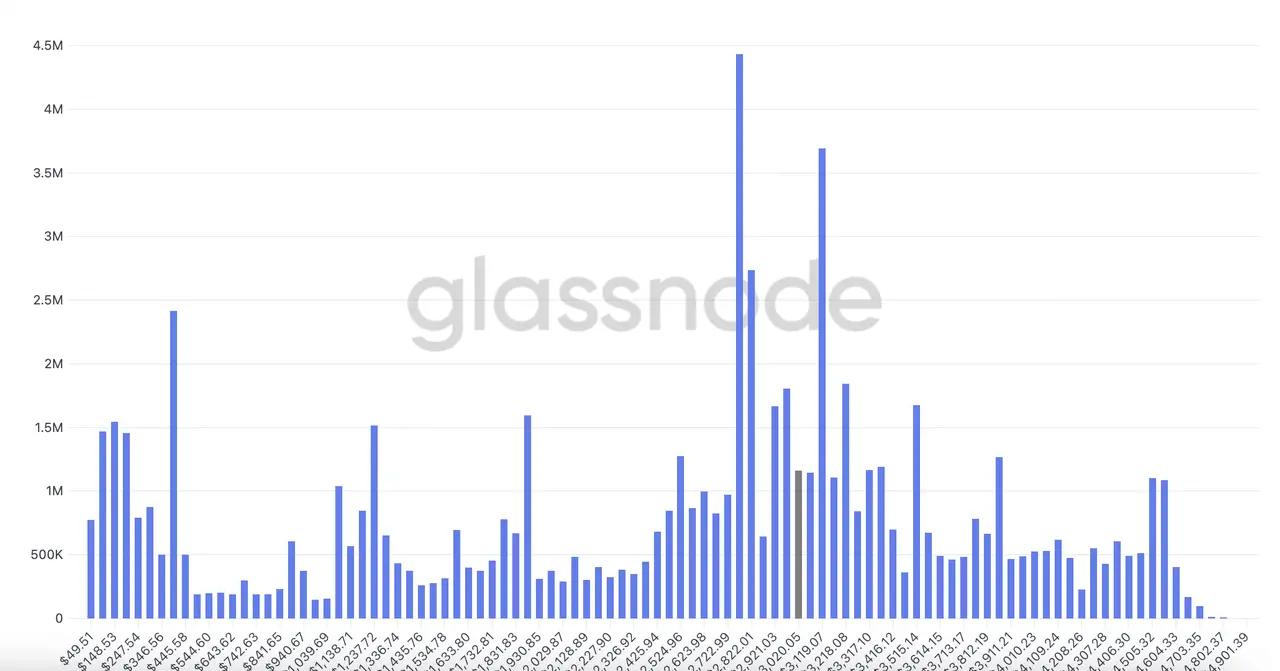
Figure 11. ETH token distribution (from glassnode)
Conclusions and Outlook
Based on a comprehensive assessment of the macroeconomic environment, changes in liquidity, and the internal structure of crypto assets, we expect the market to have completed its systematic digestion of the sharp decline in November and has entered a period of consolidation and recovery centered on the confirmation of value centers. In the short term, crypto assets lack catalysts to drive a trend breakout and are generally characterized by a wide range of "pressure above and support below".
In terms of allocation and operation, we currently maintain a neutral to defensive risk exposure management recommendation, focusing on core assets and waiting for clearer liquidity expansion or policy signals before gradually increasing risk exposure. Bitcoin remains the best-performing asset after risk adjustment, with its ETF cost zone ($80,000-$85,000), dense on-chain token holdings, and stable institutional holdings forming core support levels below the price. We expect BTC to mainly trade within the $80,000-$95,000 range in the short term, and without significant liquidity expansion or a rapid decline in interest rates, the sustainability of a breakout above the upper limit of this range is limited.
Looking ahead to 2026, the core game for crypto assets will still revolve around whether the US economy achieves a soft landing and the evolution of the inflation path. Essentially, it lies in how the Federal Reserve's policy function will be repriced under the "growth-inflation" constraint. We believe the following scenarios will diverge significantly in the coming year:
- The first scenario is a hard landing: if employment and demand weaken rapidly, and inflation falls in tandem, the economy enters a clear downturn, and risk assets will face a typical risk-off shock in the short term, with the crypto market unlikely to be immune. However, historical experience shows that after a recession is confirmed and prompts a significant dovish shift in policy, the recovery in liquidity often provides a second-stage repricing opportunity for risk assets, and crypto assets may experience a structural rebirth after the initial decline.
- The second scenario is a soft landing but with sticky inflation: If economic growth remains resilient while the rate of inflation decline is limited, the Federal Reserve's room for interest rate cuts will be constrained, and policy will enter a longer period of observation and maintenance. In this context, real interest rates and financial conditions are unlikely to ease significantly, the expansion of risk asset valuations will be limited, and the crypto market is more likely to exhibit characteristics of repeated oscillations around a predetermined value center. The overall trend will lean towards "time for space," with structural and relative return opportunities significantly outweighing trend-based rallies.
- The third scenario is a soft landing but with a resurgence of inflation: If inflation shows signs of accelerating again, accompanied by rising inflation expectations or significantly looser financial conditions, the Federal Reserve may end its rate-cutting cycle earlier than planned, or even reassess its tightening stance. In this scenario, the expectation of "higher for longer" interest rates will continue to put downward pressure on high-beta risk assets, and the valuation pressure on the crypto market will increase significantly.
- The fourth scenario is a soft landing with continued decline in inflation: If economic growth is moderate, employment remains stable, and the downward trend in inflation is confirmed, the Federal Reserve's policy space will further expand, and a decline in real interest rates is expected to improve the overall liquidity environment. This combination is most favorable for risk assets, and crypto assets have better conditions for valuation repair and upward trend in this context.
In summary, we believe the market in early 2026 is more likely to operate in a liquidity environment of "support rather than expansion," and the switching between different scenarios will be highly dependent on marginal changes in employment, inflation, and overall financial conditions. Before macroeconomic uncertainties are eliminated, crypto assets may continue to be characterized by range-bound trading and structural opportunities, with a true trend selection depending on clearer policy and liquidity signals. Under the aforementioned multi-scenario framework, we prefer to maintain a core-asset-focused allocation strategy in early 2026, controlling tail risks, and gradually adjusting risk exposure based on macroeconomic trigger signals.


