

Ethereum's price continues to fall. ETH has dropped approximately 3.2% in the last 24 hours, extending its correction from the January peak around $3,390. On the surface, this looks like a normal correction phase within a larger uptrend. However, the chart structure shows signs of building internal stress.
The risk isn't immediately apparent at first glance; however, it becomes noticeable when various signals are combined.
Ethereum's bullish structure remains intact, but the upward momentum is gradually weakening.
Ethereum remains within an uptrend channel with the lower trendline holding firm since mid-November. This structure technically supports the current uptrend. However, the price failed to break through the upper resistance zone twice, on December 10th, and continued to peak near $3,390 on January 14th before reversing and falling.
A major warning sign comes from momentum behavior, which is the first bearish factor. The Relative Strength Index (RSI) is a momentum indicator that compares the most recent price increases and decreases to measure XEM buying or selling pressure is strengthening.
From December 10th to January 14th, Ethereum's price peaked lower while the RSI peaked higher. This combination reflects underlying downward pressure. It indicates an improvement in momentum, but the price didn't react, a pattern often seen at the peaks or end of uptrends.
Subsequently, from January 6th to January 14th, the price of ETH edged higher, but the RSI peaked lower. This movement further reinforces the traditional bearish divergence signal on the daily timeframe.
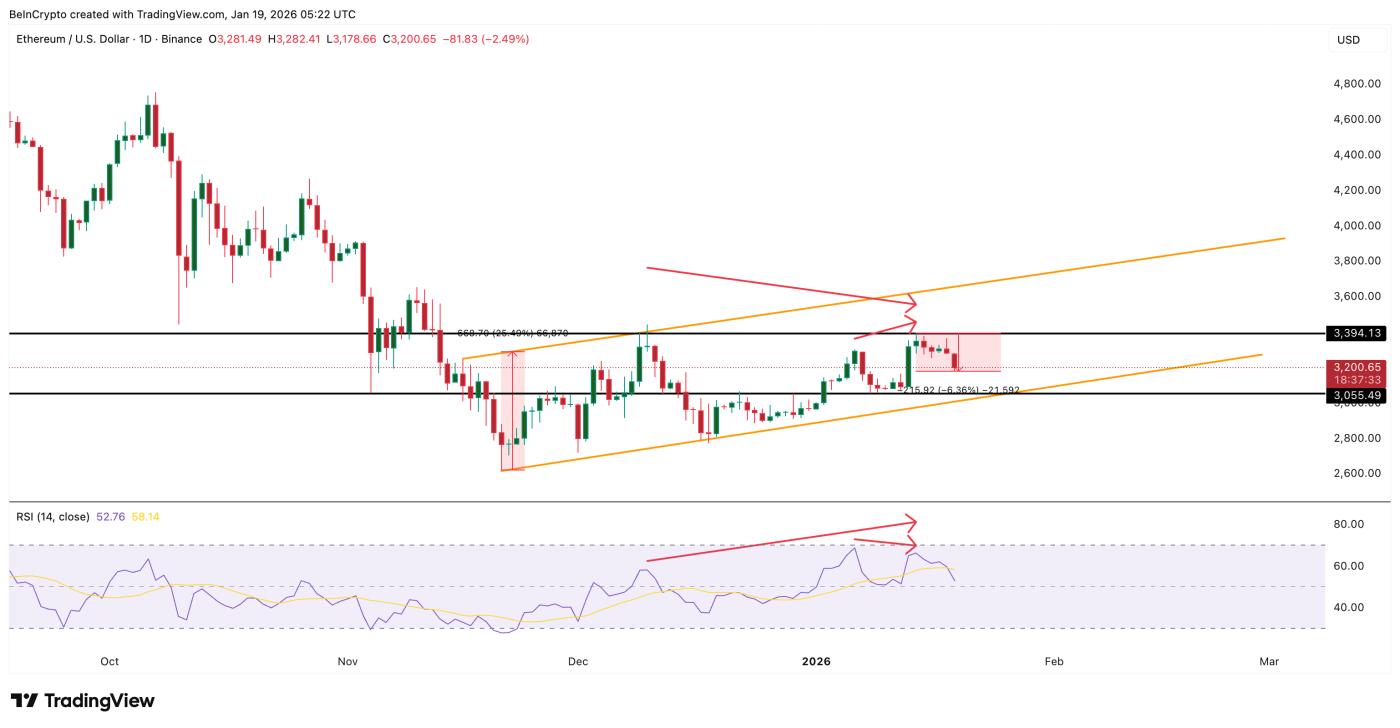 Bearish signals: TradingView
Want to read more Token analyses like this? Sign up for the daily Crypto Newsletter from Editor Harsh Notariya here .
Both RSI signals lead to the same conclusion: Momentum is weakening in both the major uptrend and the most recent wave, i.e., the January peak. However, this is not yet a definitive sign of a downtrend, but the risk is that the January peak will hold if buyers do not soon regain the upper hand.
If momentum continues to decline, Ethereum will be more likely to test the lower support zone. At that point, the market will also be paying attention to on-chain indicators.
There is profit-taking pressure, but spot sellers remain calm.
on-chain data shows that Ethereum holder have a significant amount of unrealized profit. The Net Unrealized Profit/Loss (NUPL) metric measures total profit or loss on paper by comparing the current price to the Medium purchase price of the coin.
Ethereum's aggregate NUPL, considering both short-term and long-term investors, is near its highest level this month. Even after a price correction of over 6% since its January peak, the NUPL has only fallen from around 0.31 to 0.30. This drop is only about 3% — far smaller than the price volatility.
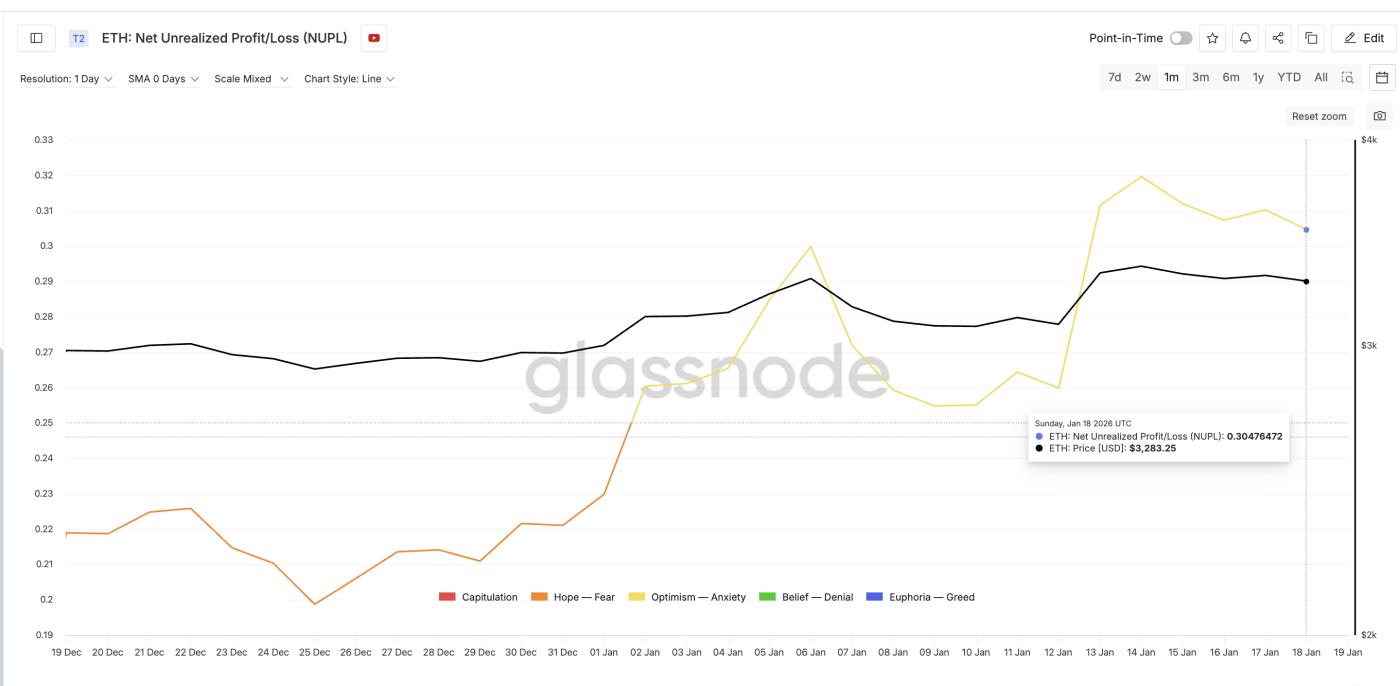 Profit-taking momentum remains: Glassnode
This is important because high NUPL will encourage profit-taking, especially when technical signals are weakening. In theory, Ethereum is at risk of profit-taking – this is the second bearish factor.
However, this has not actually happened in the spot market.
Spent Coins Age Band data – which tracks the actual amount of coins moved on the chain – shows the opposite trend. Since January 14th, coin movement across ETH age bands has sharply decreased from approximately 318,000 ETH to just 84,300 ETH (the lowest point of the month). This represents a drop of nearly 74%.
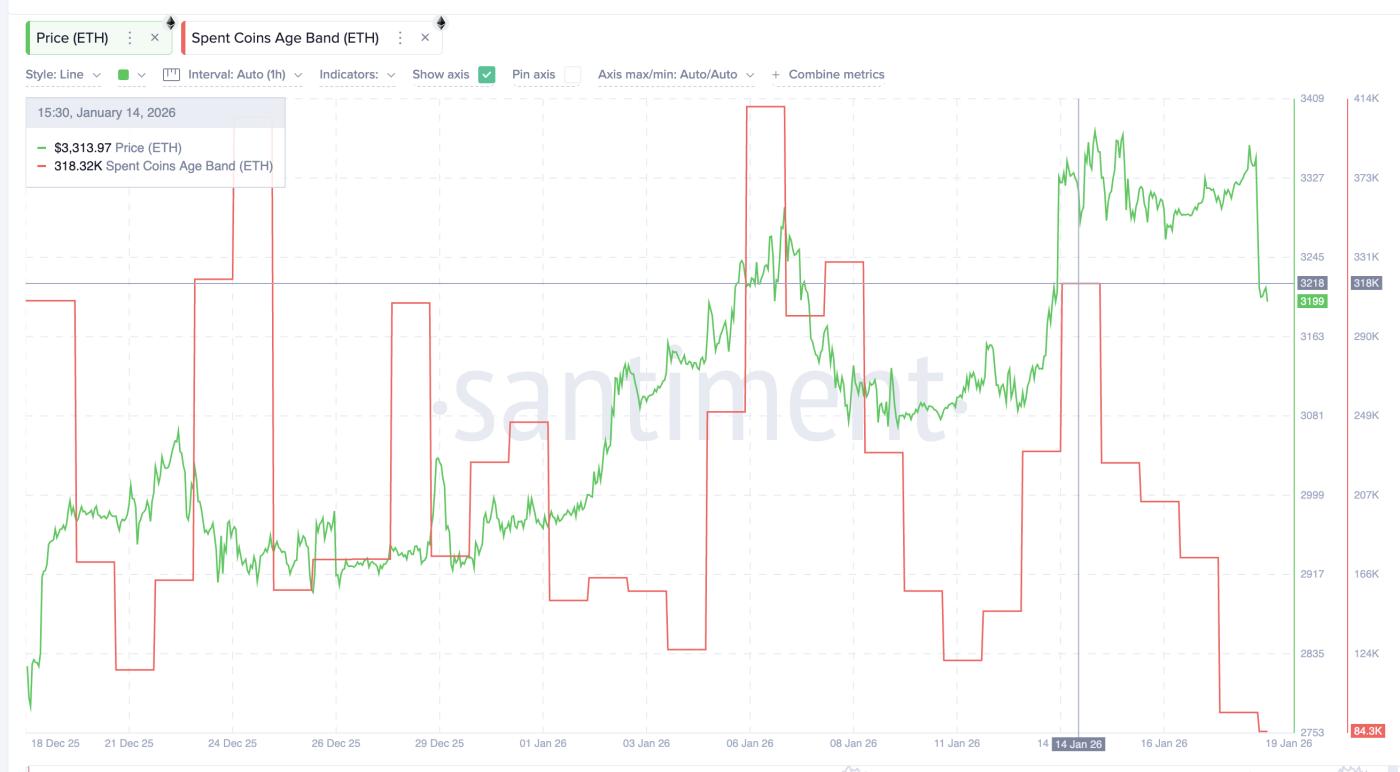 Coin transfer activity remains low: Santiment
Simply put, despite the price drop, fewer holder are moving their coins. This indicates that there is no panic selling or profit-taking. Spot holder are showing patience, willing to hold their coins through this dip instead of selling off.
So, if the spot market remains calm, where does the downside risk lie?
Derivative positions have turned $3,050 into a decisive price level for Ethereum.
The pressure has shifted with further analysis of the Derivative market.
On Binance's perpetual ETH- USDT market, the 30-day position outlook is strongly skewed towards Longing. Total accumulated Longing leverage is approximately $3.36 billion, while total Short positions are just over $1.93 billion. This creates a very strong Longing trend, with 80-90% of positions leaning in one direction.
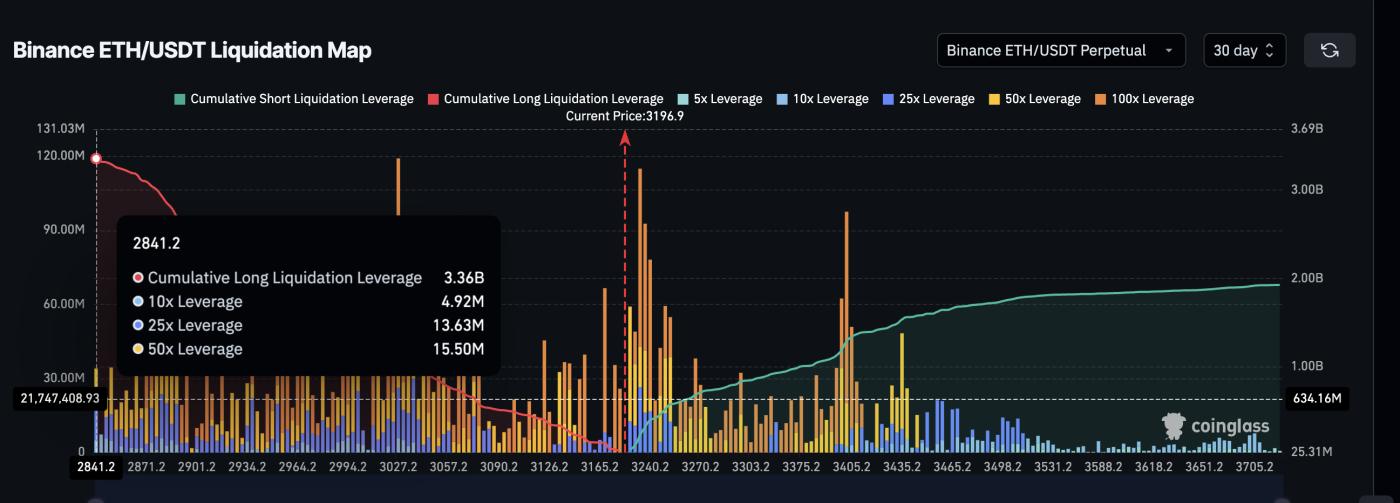 The Longing tilt clearly shows: Coinglass
This imbalance will become even more dangerous when prices reach key price levels.
The liquidation map shows a large amount of vulnerable Longing positions concentrated just below $3,050. Above this price level, liquidation pressure is not too great. However, if the price falls below this mark, a large portion of the $3.3 billion in leveraged Longing positions will be at high risk. This is the third significant potential risk factor to consider.
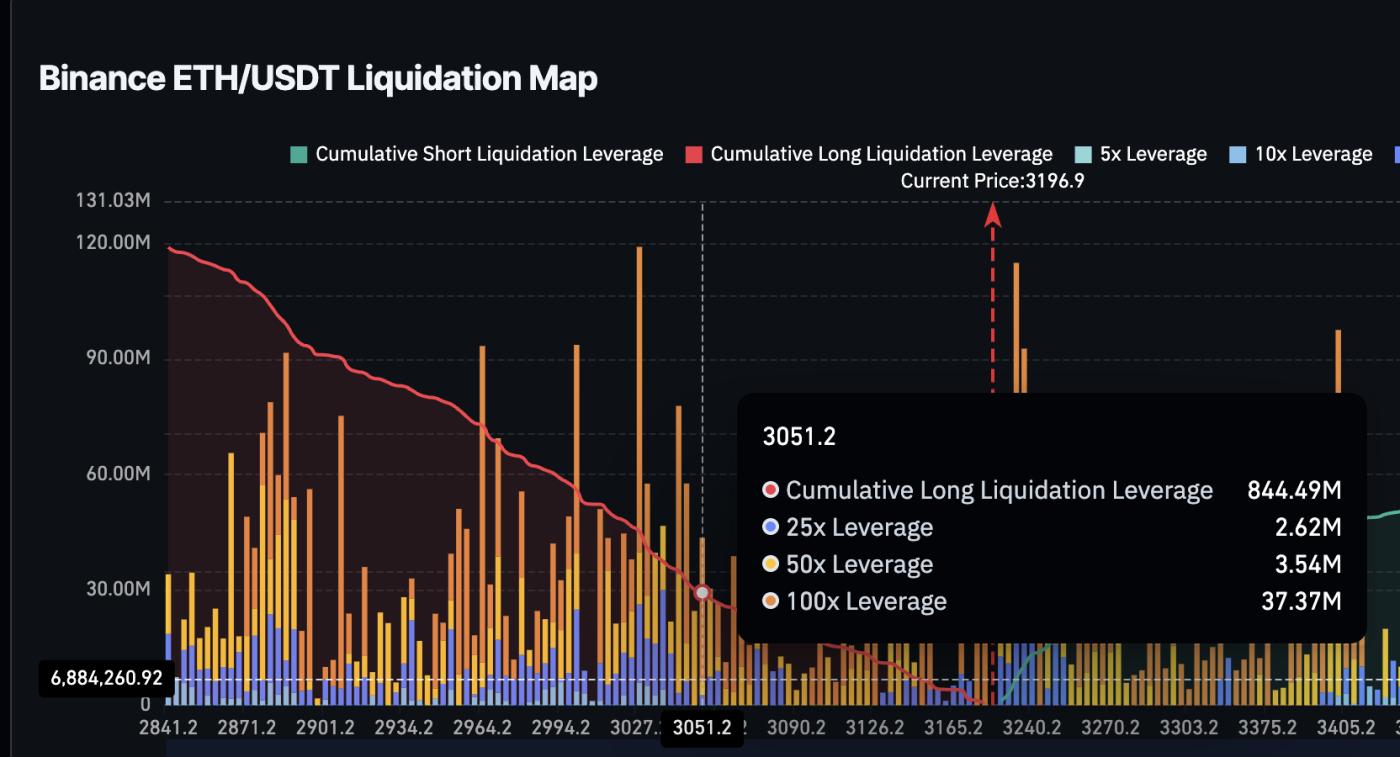 ETH liquidation map: Coinglass
These data perfectly match the technical charts.
The area around $3,050 is a crucial support zone for ETH from the beginning of 2026. If the price closes below this level on the daily chart, not only will many Longing positions be liquidated, but the ascending channel structure formed since November is also at risk of being broken. In that case, the price of ETH could fall sharply and quickly, with $2,760 being the next support zone to watch.
Conversely, Ethereum needs to reclaim the $3,390 mark to neutralize the current negative trend signals. If the price surpasses $3,480, a recovery will be more apparent. For a strong upward trend to resume, ETH needs to break through the $3,650 region, at which point a price of $4,260 would be entirely feasible in the near future.
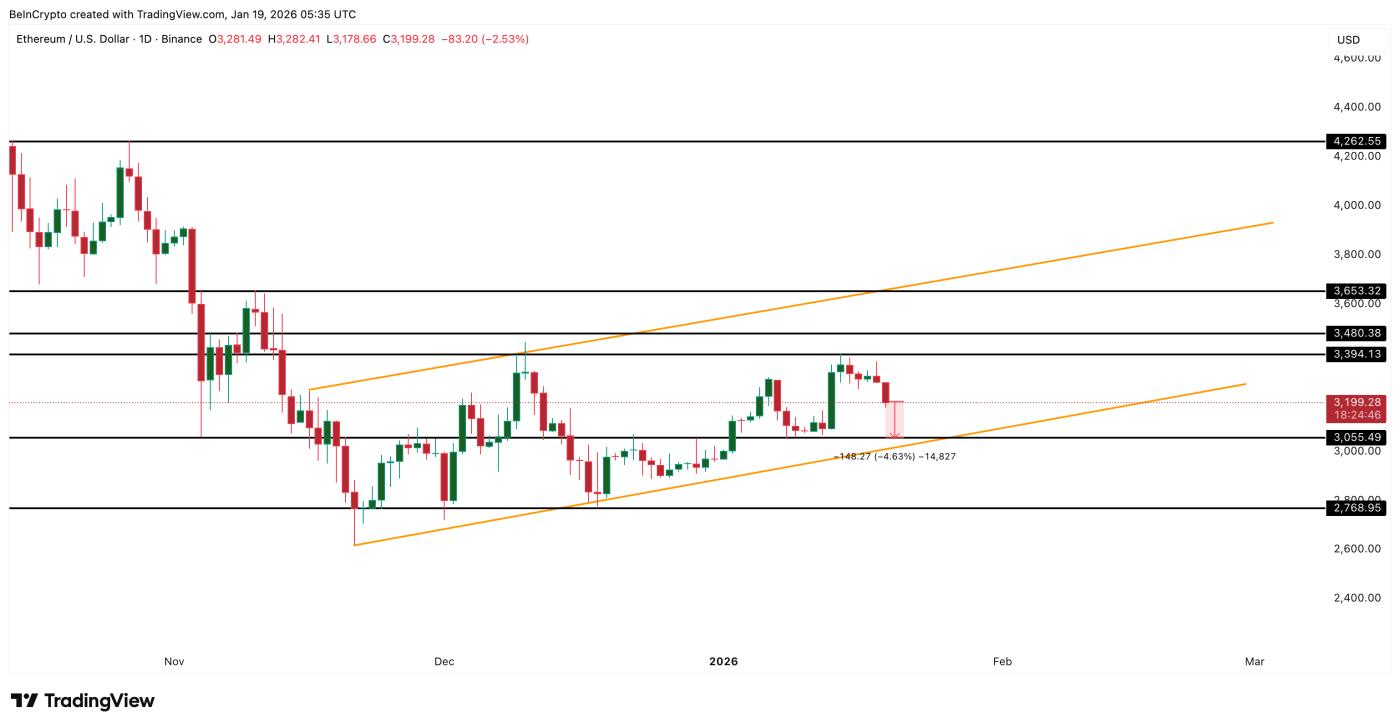 Ethereum Price Analysis: TradingView
In summary, the current picture is quite clear: the upward momentum is weakening, profit-taking remains, those holding spot ETH are still relatively secure, while the Derivative market is facing significant risks. ETH hasn't fallen sharply yet, but if the $3,050 mark is breached, the risks will no longer be purely theoretical.


