

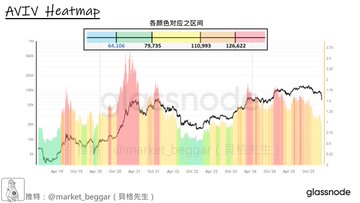
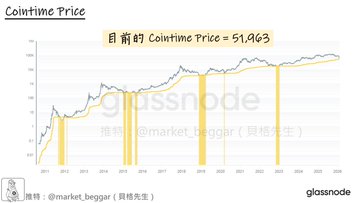
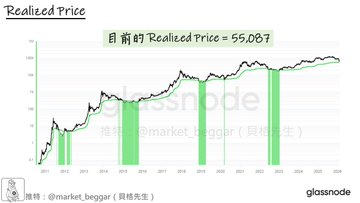
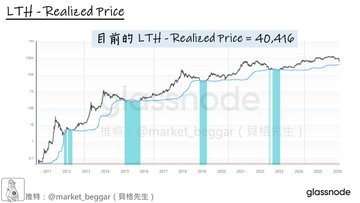
Golden Pit Tracking Series: Latest Updates on the “4 Major Deep Bear Bottom Models” 📊 I’ve shared with you before several “100% historical win-rate” deep bear valuation models, and lately, more and more people have been asking about their latest status. So, I’ve decided to start a weekly “Golden Pit Tracking Series” post to keep everyone updated with the latest numbers from these models. Check out this week’s update 👇: // 🟡 AVIV Heatmap 📝 Overview: ➡️ AVIV Heatmap is a custom model I developed ➡️ AVIV stands for “Active Value in Value,” essentially the profit multiple of active coins—an optimized MVRV ➡️ The Heatmap leverages AVIV’s mean-reversion properties ➡️ Inspired by Cointime Economics (by Ark & Glassnode) 🔗 Full tutorial: x.com/market_beggar/status/194...… AVIV Heatmap has been a highly accurate BTC cycle thermometer since genesis. Since the bear bottom at the start of 2023, BTC hasn’t returned to the blue zone. 📊 Current upper bound of AVIV Heatmap’s blue zone = $64,106 Historically, the blue zone marks the ultimate cycle bottom for BTC. While the Heatmap can’t pinpoint the exact bottom, color shifts signal phase transitions in the market. The blue area has always been the final stop for each bear market 🔵. // 🟡 Cointime Price 📝 Overview: ➡️ From the “Cointime Economics” framework by Ark & Glassnode ➡️ Uses time-weighted calculation for BTC’s moving supply—fair value estimation ➡️ Ignores ancient/lost coins, focuses only on “active” coins 🔗 Full tutorial: x.com/market_beggar/status/187...… Cointime Price is one of my personal favorites for valuation due to its logical design and strong historical performance. 📊 Current Cointime Price = $51,963 As shown in the chart, every time BTC drops below Cointime Price, it has marked a cycle bear bottom—no exceptions. // 🟡 Realized Price 📝 Overview: ➡️ Fundamental on-chain metric—represents the average cost basis of all BTC holders ➡️ Historically, BTC trading below Realized Price always marked cycle bottoms ➡️ Slightly looser compared to Cointime Price 🔗 Full tutorial: x.com/market_beggar/status/186...… 📊 Current Realized Price = $55,087 Notably, Realized Price and Cointime Price are now very close, and the zone between them might just point to the cycle’s best golden pit entry. // 🟡 LTH-Realized Price (LTH-RP) 📝 Overview: ➡️ Same concept as Realized Price, but for Long-Term Holders (LTH) only ➡️ LTH typically have lower cost bases, so LTH-RP is stricter ➡️ LTH-RP is more “anchored” compared to Cointime Price, so use with caution 🔗 Full tutorial: x.com/market_beggar/status/186...… 📊 Current LTH-RP = $40,416 As mentioned, bear market drops usually get halted at Cointime Price. With fresh institutional and corporate players this cycle, distribution patterns are changing. If you’re looking to bottom fish using LTH-RP, consider whether price will actually reach that level. // 🟡 TL;DR This is the first post in the “Golden Pit Tracking Series.” I hope this ongoing series helps you optimize your bottom-fishing strategies. Check out my detailed thoughts in the linked threads below—personally, I believe we’re just at the beginning of a wide-range chop. If you’re not clear on my macro view, I strongly recommend reading the threads below and mentally gearing up for a potential multi-month “shakeout” ahead. That’s it for today’s update—hope it helps! 🫡 // 📚 Further Reading BTC Returns to the Blue Support Zone for the First Time Since 2022: x.com/market_beggar/status/202...… “Golden Pit at Arm’s Length”: PSIP Cycle Bottom Signal Is Close x.com/market_beggar/status/202...…
This article is machine translated
Show original
Sector:
From Twitter
Disclaimer: The content above is only the author's opinion which does not represent any position of Followin, and is not intended as, and shall not be understood or construed as, investment advice from Followin.
Like
Add to Favorites
Comments
Share
Relevant content


