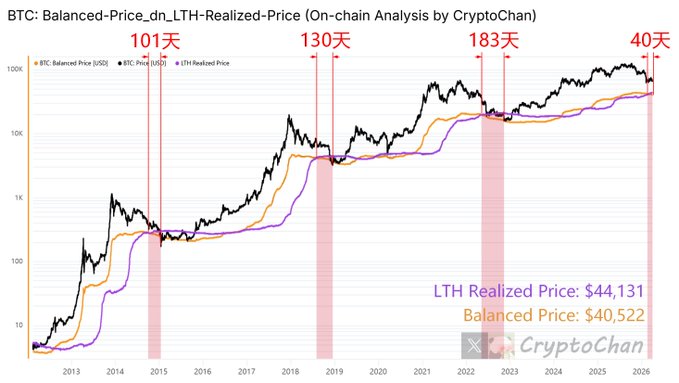
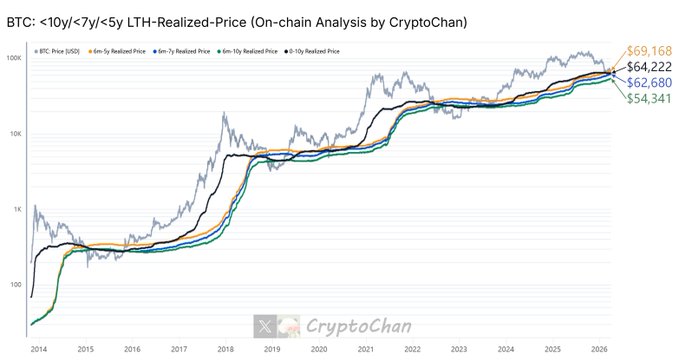
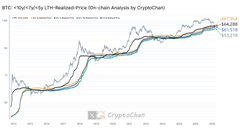
avatar
CryptoChan
57,167 Twitter followers
Follow
#Bitcoin on-chain & cycle analysis,比特币链上行情分析 || 不拉群不带单不收费 || TG频道: https://t.co/Q1ZKhF2mx9 || 内容纯分析交流,无任何投资建议
Posts
avatar
CryptoChan
Thread
【Four-Year Cycle Series (18)】The indicator in the current chart has fallen to 1.42. In 2014, the indicator fell to 1.42 and reached the bear market bottom in 76 days ($0.15k). In 2018, the indicator fell to 1.42 and reached the bear market bottom in 82 days ($3.1k). In 2022, the indicator fell to 1.42 and reached the secondary bear market bottom in 26 days ($17.6k). The gray line at the top of the chart is the #BTC price; the yellow line is the average cost price of BTC short-term holders; the magenta line is the average cost price of BTC long-term holders (excluding those who have held the BTC for more than 10 years). The indicator at the bottom of the chart is the ratio of "average cost price of BTC short-term holders" to "average cost price of BTC long-term holders (excluding those who have held the BTC for more than 10 years)" (i.e., yellow line / magenta line). The average cost price of BTC short-term holders is defined as the average cost of investors who have held Bitcoin for less than 155 days. Meaning: Reflects the cost basis of recent buyers, who are sensitive to price fluctuations and prone to selling during downturns. Often used as a short-term market sentiment indicator—prices are higher than this average in a bull market, and falling below it in a bear market may exacerbate selling. BTC Long-Term Holder Average Cost Definition: The average cost of investors who have held Bitcoin for >155 days, excluding those holding >10 years (these may be lost or never moved, such as Satoshi Nakamoto's coins). Meaning: Focuses on "active" long-term holders, providing a more realistic cost basis. Often used as a reference for market support levels—may become the price bottom in a bear market. Ratio (Short-Term Average Price / Long-Term Average Price) Meaning: Reflects market cycle stage and participant behavior: Ratio >1: High cost of short-term buyers (new funds entering at high prices), optimistic but potentially overheated sentiment. Ratio <1: Bear market or bottom signal, low cost of short-term buyers (entering at low prices), weak hands clearing out, market may recover. Overall Trend: Ratio rising = continuation of the bull market; falling = bear market or distribution phase. Excluding holdings older than 10 years allows the ratio to more accurately capture cyclical turning points; historically, a ratio <1 often presents long-term buying opportunities. twitter.com/0xCryptoChan/statu...
BTC
1.5%
avatar
CryptoChan
02-04
The indicator in the current chart has fallen to 1.45. In 2014, it took 119 days for this indicator to drop from 1.45 to 1. In 2018, it took 147 days. In 2022, it took 123 days. Note: An indicator reaching 1 generally indicates a bear market bottom. The gray line at the top of the chart represents the #BTC price; the yellow line represents the average cost price for short-term BTC holders; the magenta line represents the average cost price for long-term BTC holders (excluding those held for >10 years). The indicator at the bottom of the chart is the ratio of the "average cost price for short-term BTC holders" to the "average cost price for long-term BTC holders (excluding those with >10 years of holdings)" (i.e., yellow line / magenta line). The average cost price for short-term BTC holders is defined as investors or entities that have held Bitcoin for less than 155 days. This indicator reflects the cost basis of recent market entrants, who tend to be more sensitive to price fluctuations and more likely to sell their positions during market volatility or downturns. It is often seen as a barometer of short-term market sentiment and momentum: in a bull market, prices are typically above this average cost; in a bear market, prices falling below this level can trigger further selling pressure. The average cost of long-term BTC holders is defined as investors or entities that have held Bitcoin for more than 155 days. This indicator excludes holdings held for more than 10 years (lost or extremely long-term immobile assets, such as Satoshi's coins) to focus on a more "active" group of long-term holders. These extremely long-term holdings have extremely low costs and are unlikely to move, thus excluding them provides a more realistic LTH cost basis, reflecting the average holding price of long-term investors who are likely to actually participate in buying and selling throughout market cycles. This indicator is often seen as a reference for market fundamental support levels: in a bear market, it may serve as a potential price bottom. The ratio (average cost of BTC short-term holders / average cost of BTC long-term holders) reflects the stage of the Bitcoin market cycle and the dynamics of participant behavior: Ratio > 1: Indicates that the average cost of short-term holders is higher than that of adjusted long-term holders. This typically occurs in bull markets, where recent entrants buy at higher prices, while long-term holders have a lower cost basis (even excluding extremely long-term holdings). This suggests optimistic market sentiment and strong new capital inflows, but may also indicate overheated speculation or a potential pullback. Ratio < 1: Indicates that the average cost of short-term holders is lower than that of adjusted long-term holders. This is common in bear markets or market bottoms, where recent entrants buy at lower prices, while long-term holders have a higher cost basis (reflecting their holdings across the cycle). This is often a signal of surrender, suggesting that weak hands have been cleared out and the market may be heading towards recovery or the start of a bull market. General meaning: An upward trend in the ratio indicates that the cost of short-term holders is increasing relative to long-term holders, marking a "numerical rise" phase or the continuation of a bull market; a downward trend indicates that the cost of long-term holders is increasing relative to short-term holders, marking a bear market or distribution phase. Excluding holdings >10 years brings LTH's cost closer to active market participants, avoiding the distortion of the ratio by low-cost lost coins, thus more accurately capturing cyclical turning points (such as the transition from a bear market to a bull market). Historically, when the ratio falls below 1, it often presents a long-term buying opportunity.
BTC
1.5%
loading indicator
Loading..