Today
Intel
Market
Earn
Settings
Account
Theme Selection
Light
Dark
Language
English
简体中文
繁體中文
Tiếng Việt
한국어
Followin APP
Mine Web3 Possibilities
App Store
Google Play
Log in
alvin617.eth 🐻⛓️
20,369 Twitter followers
Follow
Building @CryptoWesearch I @allaboutbera I Crypto ‘17 I Dive into new narratives 💎 ⚙️ 新一代合規交易所 🎒 https://t.co/Arc1yjCrbS
Posts
alvin617.eth 🐻⛓️
Anthropic vs. OpenAI, MU Hits $1 Trillion w/ @cryptomeina [Guardians Echo ep. 61] /i/broadcasts/1MJgNNVeQQjGL
ECHO
6.76%
alvin617.eth 🐻⛓️
Thread
#Thread#
I remember last year, before Vibe Coding even became popular, and when Anthropic was valued at 400b, I liked them more than other LLM giants. Perhaps it was because they invested a lot of effort in education that impressed me, and also because they seemed to have explored humanities and philosophy more extensively than other institutions. (Continued bullish)
alvin617.eth
@Alvin0617
💡Amazing Discovery: The Number of People Jumping from OpenAI to Anthropic Is Eight Times the Reverse Long short Anthropic / OpenAI—could it be a good strategy? With Karpathy's joining, discussions on high-level talent turnover have spiked rapidly The top teams driving global x.com/CryptoWesearch…@@
alvin617.eth 🐻⛓️
Thread
#Thread#
💡Surprising discovery: The number of people jumping ship from OpenAI to Anthropic is eight times the number jumping ship in reverse order. Would a long short Anthropic/OpenAI strategy be a good one? With Karpathy's arrival, discussions about high-level talent turnover have surged. The top teams driving global technological development can actually offer insights by listing their members. - xAI's founding team essentially all left by the end of March this year. Kyle Kosic (@kylekosic) left for OpenAI. Igor Babuschkin (@ibab) started his own venture capital firm. 💡: Anthropic boasts an 80% employee retention rate within two years, the highest among companies with high-level talent retention. According to SignalFire's talent report, OpenAI engineers are 8 times more likely to jump ship to Anthropic than vice versa, and DeepMind's ratio to Anthropic is even higher at 11:1. 💡On February 2nd, SpaceX acquired xAI in an all-stock transaction, valuing the company at $1.25 trillion, the largest merger in history, but immediately caused the disintegration of the founding team. In AI In this era of rapid growth, the most irreplaceable asset with compounding returns is people. Besides mergers and acquisitions and financing news directly related to valuation, the retention and departure of talent also determine the upper limit of a tech giant's growth. twitter.com/Alvin0617/status/2...
alvin617.eth 🐻⛓️
Thread
#Thread#
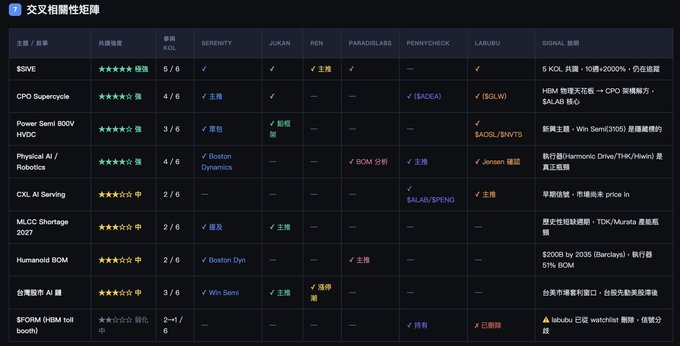
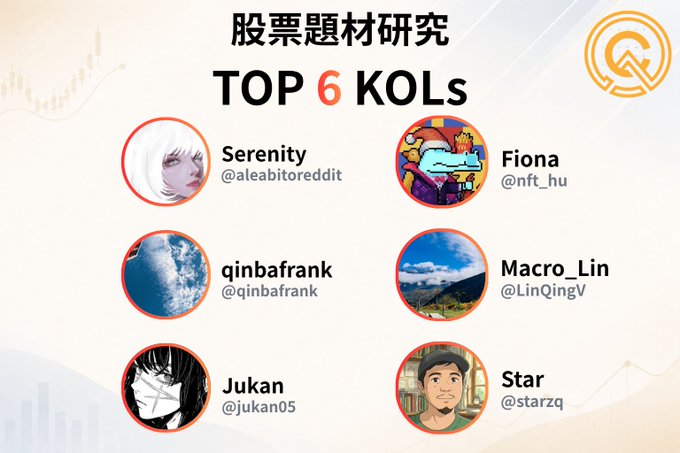
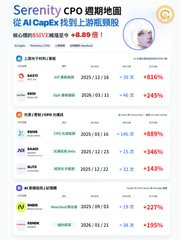
The crazy stock market doesn't require outside help. Here's a simple summary of the current consensus among a few KOLs: 💡$SIVE — Highest consensus 💡CPO Supercycle — Architectural shift 💡Power Semi 800V HVDC — Emerging strong signal 💡Physical AI / Humanoid — Next wave 💡CXL AI Serving — Early signal 💡Taiwan AI supply chain Actually, the cost of AI data scraping and analysis is already very low, but the proficiency in using it and the familiarity with the information dissemination chain will significantly affect the data produced. twitter.com/Alvin0617/status/2...
alvin617.eth 🐻⛓️
Thread
#Thread#
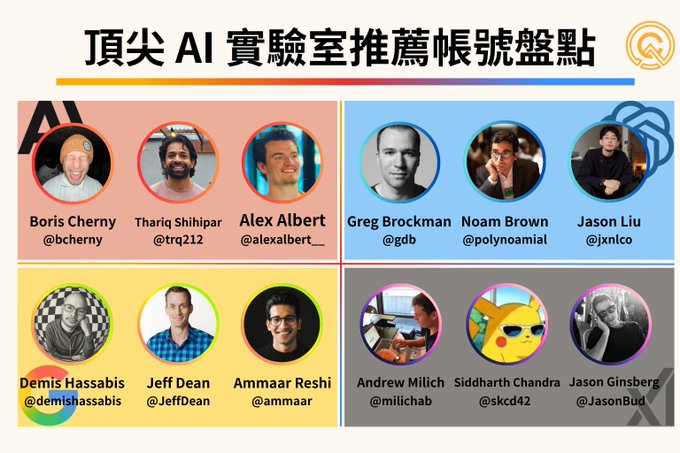
This post went way more popular than expected! I've also included the KOLs recommended by everyone in this list. I'll be updating it gradually, with an initial cap of around 20 names—quality over quantity! Besides the KOLs you all know, what other alpha can be identified using AI? That's something I'll be focusing on next. Any publicly available online content can be used for correlation analysis, and you can get very comprehensive results in less than half an hour. Link in the comments twitter.com/Alvin0617/status/2...
alvin617.eth 🐻⛓️
I'm honestly a little ashamed to be on this list; the others are all so strong and are also excellent sources of information for me. Adding a few more alpha contributors: @insane_analyst @labubu_trader @fi56622380 These are all treasure bloggers who provide powerful insights. twitter.com/nft_hu/status/2059...
LABUBU
297.94%
alvin617.eth 🐻⛓️
Thread
#Thread#
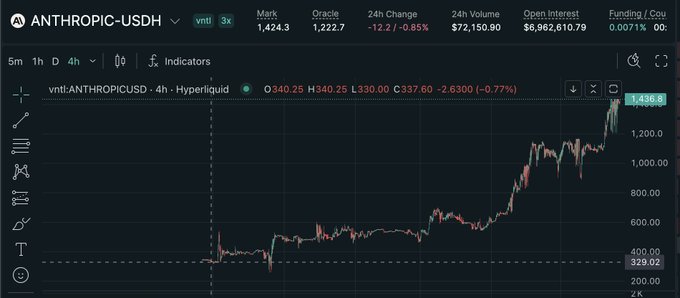
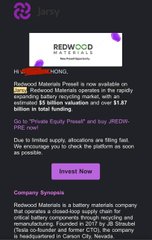
A 5x opportunity in a year? Hidden within the pre-IPO market of the crypto, most people believe the current AI bubble is real, but it may just be beginning to grow... When I first introduced @JarsyInc Anthropic's pre-market valuation of 200 billion was considered expensive. Now, both OpenAI and Anthropic are above 1TB. No more OpenClaw, no Hermes agent, no Capex supercycle – these terms are flooding the internet. It's the golden age before memory prices went crazy! 🤣 twitter.com/Alvin0617/status/2...
alvin617.eth 🐻⛓️
Thread
#Thread#
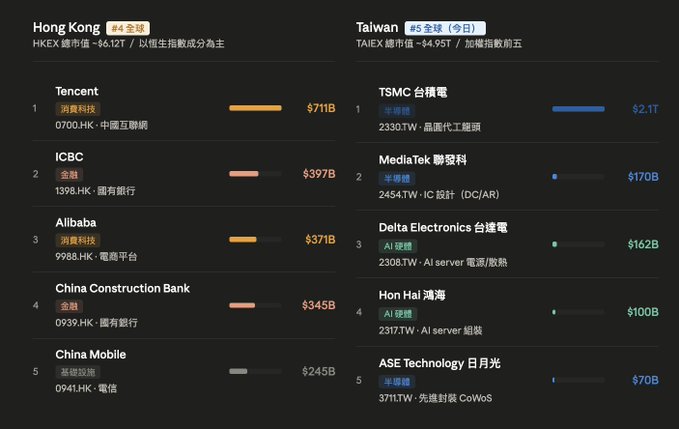
Taiwan's stock market has jumped to fifth globally! 💥 Is a 50,000 mark just around the corner? Is this why @aleabitoreddit started tweeting in Chinese? 😂 Taiwan's current market capitalization: 4.95T Hong Kong's market capitalization: 6.12T Japan: 6.5T China: 11.5T US: 60T It's clear that this explosive growth in recent years is related to TSMC. Every 10% increase in TSMC's market capitalization adds $180B to Taiwan's. Is there a chance it will surpass Hong Kong's stock market? Let's look at the differences between the top 5 stocks in Taiwan and Hong Kong: Taiwan: TSMC, MediaTek, Delta Electronics, Hon Hai Precision Industry, ASE Technology Holding Hong Kong: Tencent, Industrial and Commercial Bank of China, Alibaba, China Construction Bank, China Mobile 💡TSMC $2.1T = Approximately 42% of total market capitalization Tencent $711B = Approximately 11.6% of total market capitalization 💡The top 5 Hong Kong stocks are all Chinese companies, highly sensitive to policy changes. 💡Taiwan's competitive advantage comes from its AI supply chain, which boasts high vertical density. The second tier is also starting to emerge, with 16 trillion-dollar companies, a number surpassed only by the US globally. If the current monthly growth rate remains at 4%, and the overall market capitalization of Hong Kong stocks remains around 6T, the Taiwan stock market has a chance to rise to the top four by Q3 2026. At that time, the Taiwan market capitalization will reach 52K, currently at 43K. Left and right twitter.com/Alvin0617/status/2...
Loading..