

Mining industry confidence in Bitcoin continues to grow recently, with hash rates continuing to hit new highs. However, on-chain transaction volumes have been sluggish recently due to a clear lack of confidence in the market among investors.
summary
In the mining sector, the hash rate is slightly below its all-time high. Despite the recent decline in revenue, miners continue to increase their investment, indicating that this group is still optimistic about this market.
Investors are moving less money between exchanges and trading volumes are shrinking across the board, suggesting that investor interest in trading has waned.
Both Bitcoin and Ethereum ETFs have seen net outflows of funds. However, compared to the latter, investors are still clearly more interested in the Bitcoin market.
Miners Trend Analysis
Miners are still important participants in the Bitcoin network and the main producers of new coins. They continuously provide hashing power for new blocks, and in return they will receive newly minted Bitcoins and transaction fees as rewards.
Undoubtedly, mining is a very risky industry, because miners can neither control the cost of energy they input nor the cost of Bitcoin output.
Despite volatile market conditions, miners continue to deploy new ASIC hardware, pushing the total hashrate of the entire network higher (14-day moving average) to 666.4EH/s, just 1% below its historical peak.
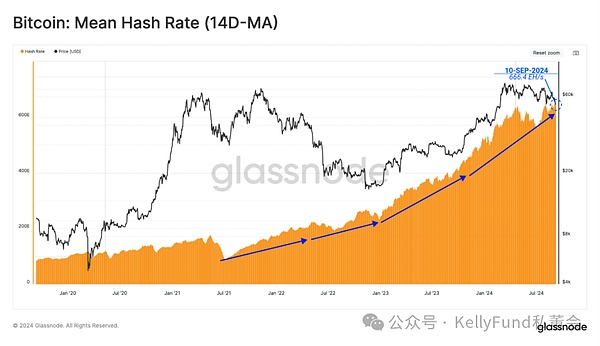
Figure 1: Average Bitcoin network hash rate
As we know, as the hash rate fluctuates, the Bitcoin protocol automatically adjusts the difficulty of mining blocks. Therefore, as the hash rate increases, the difficulty of successfully mining new blocks will also increase accordingly.
Currently, the average hashrate required to mine a new block is 338,000 exahashes. This is the second highest record in Bitcoin’s history, highlighting the increasingly fierce competition in the mining field.
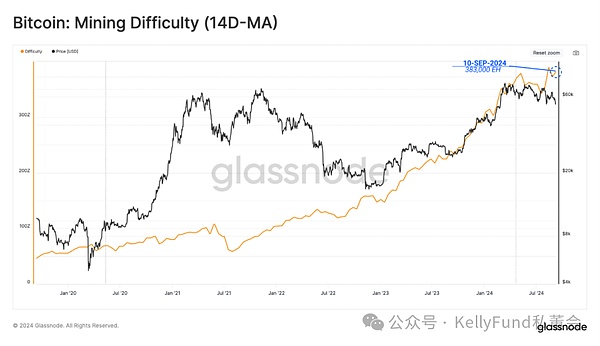
Figure 2: Mining difficulty (14-day moving average)
However, since the price of the cryptocurrency hit a record high in March, miners have seen a significant drop in revenue. Much of this can be attributed to falling fees, both due to a drop in overall market liquidity and a drop in transaction fees for both Runes and Inscriptions.
At present, the spot price of Bitcoin is still above $55,000. Therefore, the block subsidy-related miners’ income is still relatively high, but it is still about 22% lower than the previous peak.
Block subsidy revenue: $824 million
Transaction fee income: $20 million
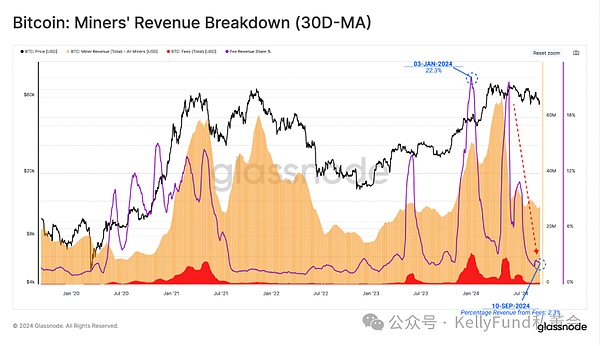
Figure 3: Miners’ earnings breakdown (30-day moving average)
But as miners' income declines, we believe that they will gradually begin to face financial pressure. We can see whether the facts support our inference by studying their Mined-Supply percentage within 30 days.
Since the mining industry is capital-intensive and highly competitive, most of the bitcoins mined by miners are used by them to pay for the high hardware costs. But it is worth noting that they will "retain" a portion of the bitcoins they have mined recently, instead of selling them all as before.
This is interesting because miners tend to trade pro-cyclically - they are sellers during declines, and when the price of the currency rises, they will turn into long-term holders. But recently, the hash rate has been rising, which means that the production cost of Bitcoin is getting higher and higher, which may affect the profitability of the miners in the near future.
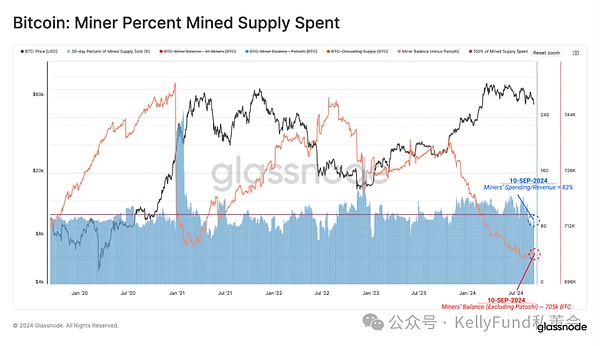
Figure 4: Mined-Supply percentage of the Miners group
On-chain settlement slows down
The size of the on-chain settlement volume can also reflect whether the current market is healthy. Looking at the entity-adjusted transaction volume alone, the total volume of transactions settled on the entire network is about US$6.2 billion per day.
This indicator has recently dropped to the annual average, indicating that both network utilization and throughput have dropped significantly. Generally speaking, this phenomenon has obvious negative implications.
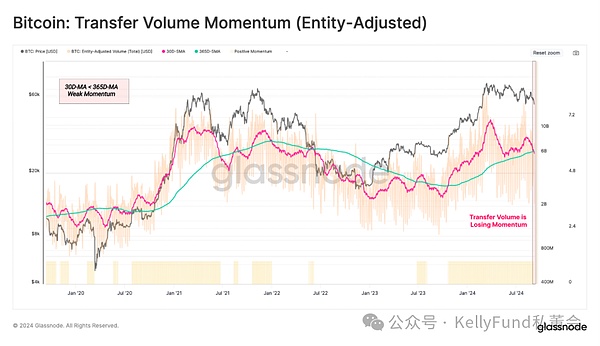
Figure 5: Bitcoin asset transfer volume momentum
Declining willingness to trade
Despite the ever-changing market landscape, CEXs remain a core hub for speculative activity and price fluctuations. Therefore, by evaluating the on-chain trading volume of these CEXs, we can get a glimpse into the current trading willingness of investors.
Cross-analyzing the 30-day/365-day inflow and outflow momentum of CEX assets, we can see that in the recent period, the average monthly trading volume is far below the annual average line. This highlights that investor demand is constantly decreasing, and price speculation activities are also decreasing accordingly within the current price range.
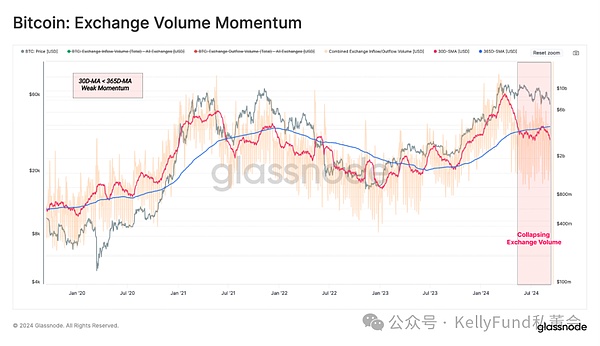
Figure 6: Bitcoin Volume Momentum
Next, we will look at spot volume on exchanges. Here, we focus on the 90-day MinMax scalar, which normalizes the fluctuations within +1/-1 standard deviation of the volume extremes over a specific time period.
This indicator also reveals to us the fact that spot trading volume continues to decline, which confirms our point of view from another perspective.
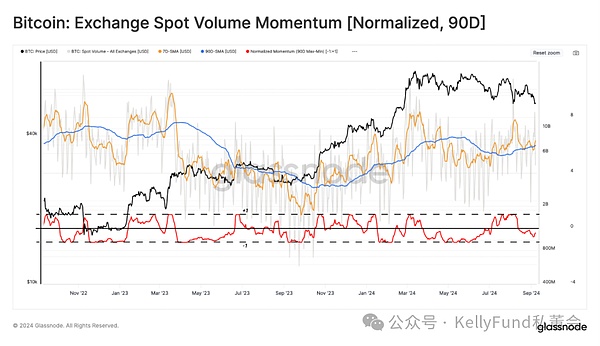
Figure 7: Bitcoin spot volume momentum (90-day normalized)
In addition, we introduce the CVD indicator to estimate the current net balance between buying and selling pressure in the spot market. We noticed that investors’ selling pressure has been increasing over the past 90 days, which has also led to a drop in prices.
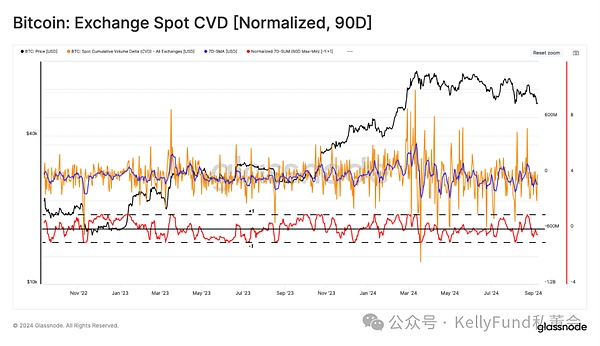
Figure 8: Spot CVD Index (90-day normalized)
Finally, we assess Bitcoin’s price momentum. We can see that this indicator has been somewhat lingering, with both positive and negative values in August. This is in stark contrast to the previous two indicators, both of which were negative during the same period.
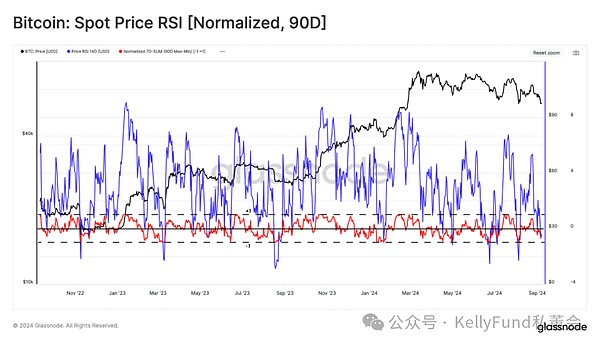
Figure 9: Spot RSI indicator (90-day normalized)
Combining the three indicators of volume, CVD and MinMax, we can generate an investment sentiment heat map with a characteristic value between 1 and -1. Next, we put it in the following numerical framework for consideration:
A value of 1 indicates high risk
A value of 0 indicates medium risk
A value of -1 indicates low risk
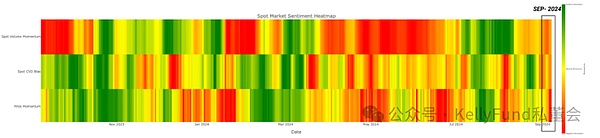
Figure 10: Investment Sentiment Heat Map
ETF Situation Analysis
After the Bitcoin ETF was launched in January, the Ethereum ETF followed in August. These two events have a milestone impact on the digital asset industry. Together, they provide a shortcut for the traditional financial market in the United States to access these two mainstream digital assets.
On the Bitcoin ETF side, the capital flow of the US dollar has been weakening since August 2024. Currently, US$107 million is flowing out of the market every week.
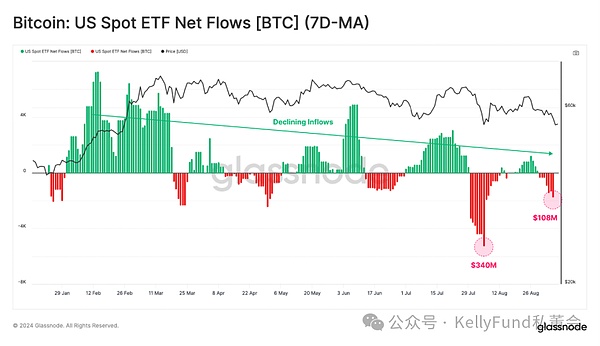
Figure 11: US spot Bitcoin ETF asset flows (7-day moving average)
The recent performance of Ethereum ETF is also stagnant, with net outflows, mainly caused by redemptions of Grayscale ETHE products, while asset inflows from other channels are not enough to offset the redemption outflows.
Total outflows from Ethereum ETFs were -$13.1 million, highlighting the huge disparity between the current market sizes of Bitcoin and Ethereum.
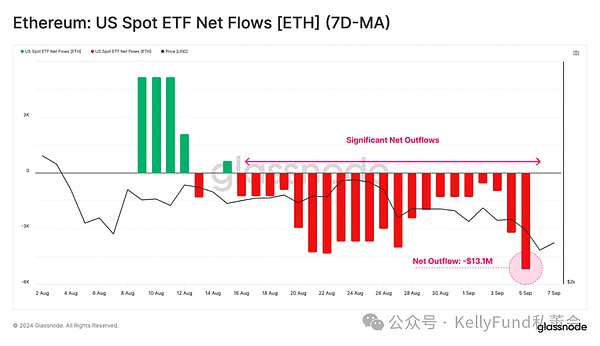
Figure 12: US spot Ethereum ETF asset flows (7-day moving average)
To approximate the impact of ETFs on the Bitcoin and Ethereum markets, we normalized the net flow deviation of their ETFs by spot trading volume. The ratio allows us to directly compare the relative weight of the ETFs in the two markets.
As shown in the figure below, the relative impact of ETFs on the Ethereum market is roughly equivalent to ±1% of spot trading volume, while the Bitcoin ETF is ±8%. This shows that the market interest in Bitcoin ETFs is still much greater than that of Ethereum ETFs.
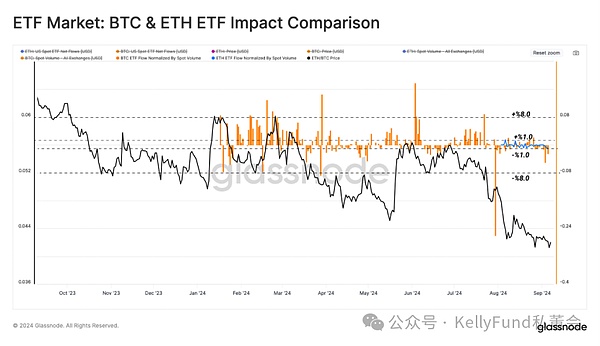
Figure 13: Bitcoin/Ethereum ETF Market Comparison
Summarize
Miners are still showing great confidence in the Bitcoin market, with the hash rate only slightly below its all-time high despite a significant drop in revenue.
However, since this group tends to trade procyclically — sellers during declines and holders during rallies — they may turn to further sell Bitcoin if prices fall further.
At the same time, transactions in the market continued to decrease, and trading volume shrank across the board, indicating that investors were not interested. Institutional, this trend was also obvious, and both Bitcoin and Ethereum ETFs experienced net outflows of assets.


