Summary
As Bitcoin's price soared to $100,000, long-term holders have distributed over 507,000 bitcoins, down from the 934,000 bitcoins distributed at the March 2024 ATH, but still significant. Long-term holders are realizing large profits, setting a new single-day profit record of $2.02 billion. In analyzing the distribution entities, the majority of the selling pressure comes from bitcoins held for 6 months to 1 year.Intensive Distribution by Long-Term Holders
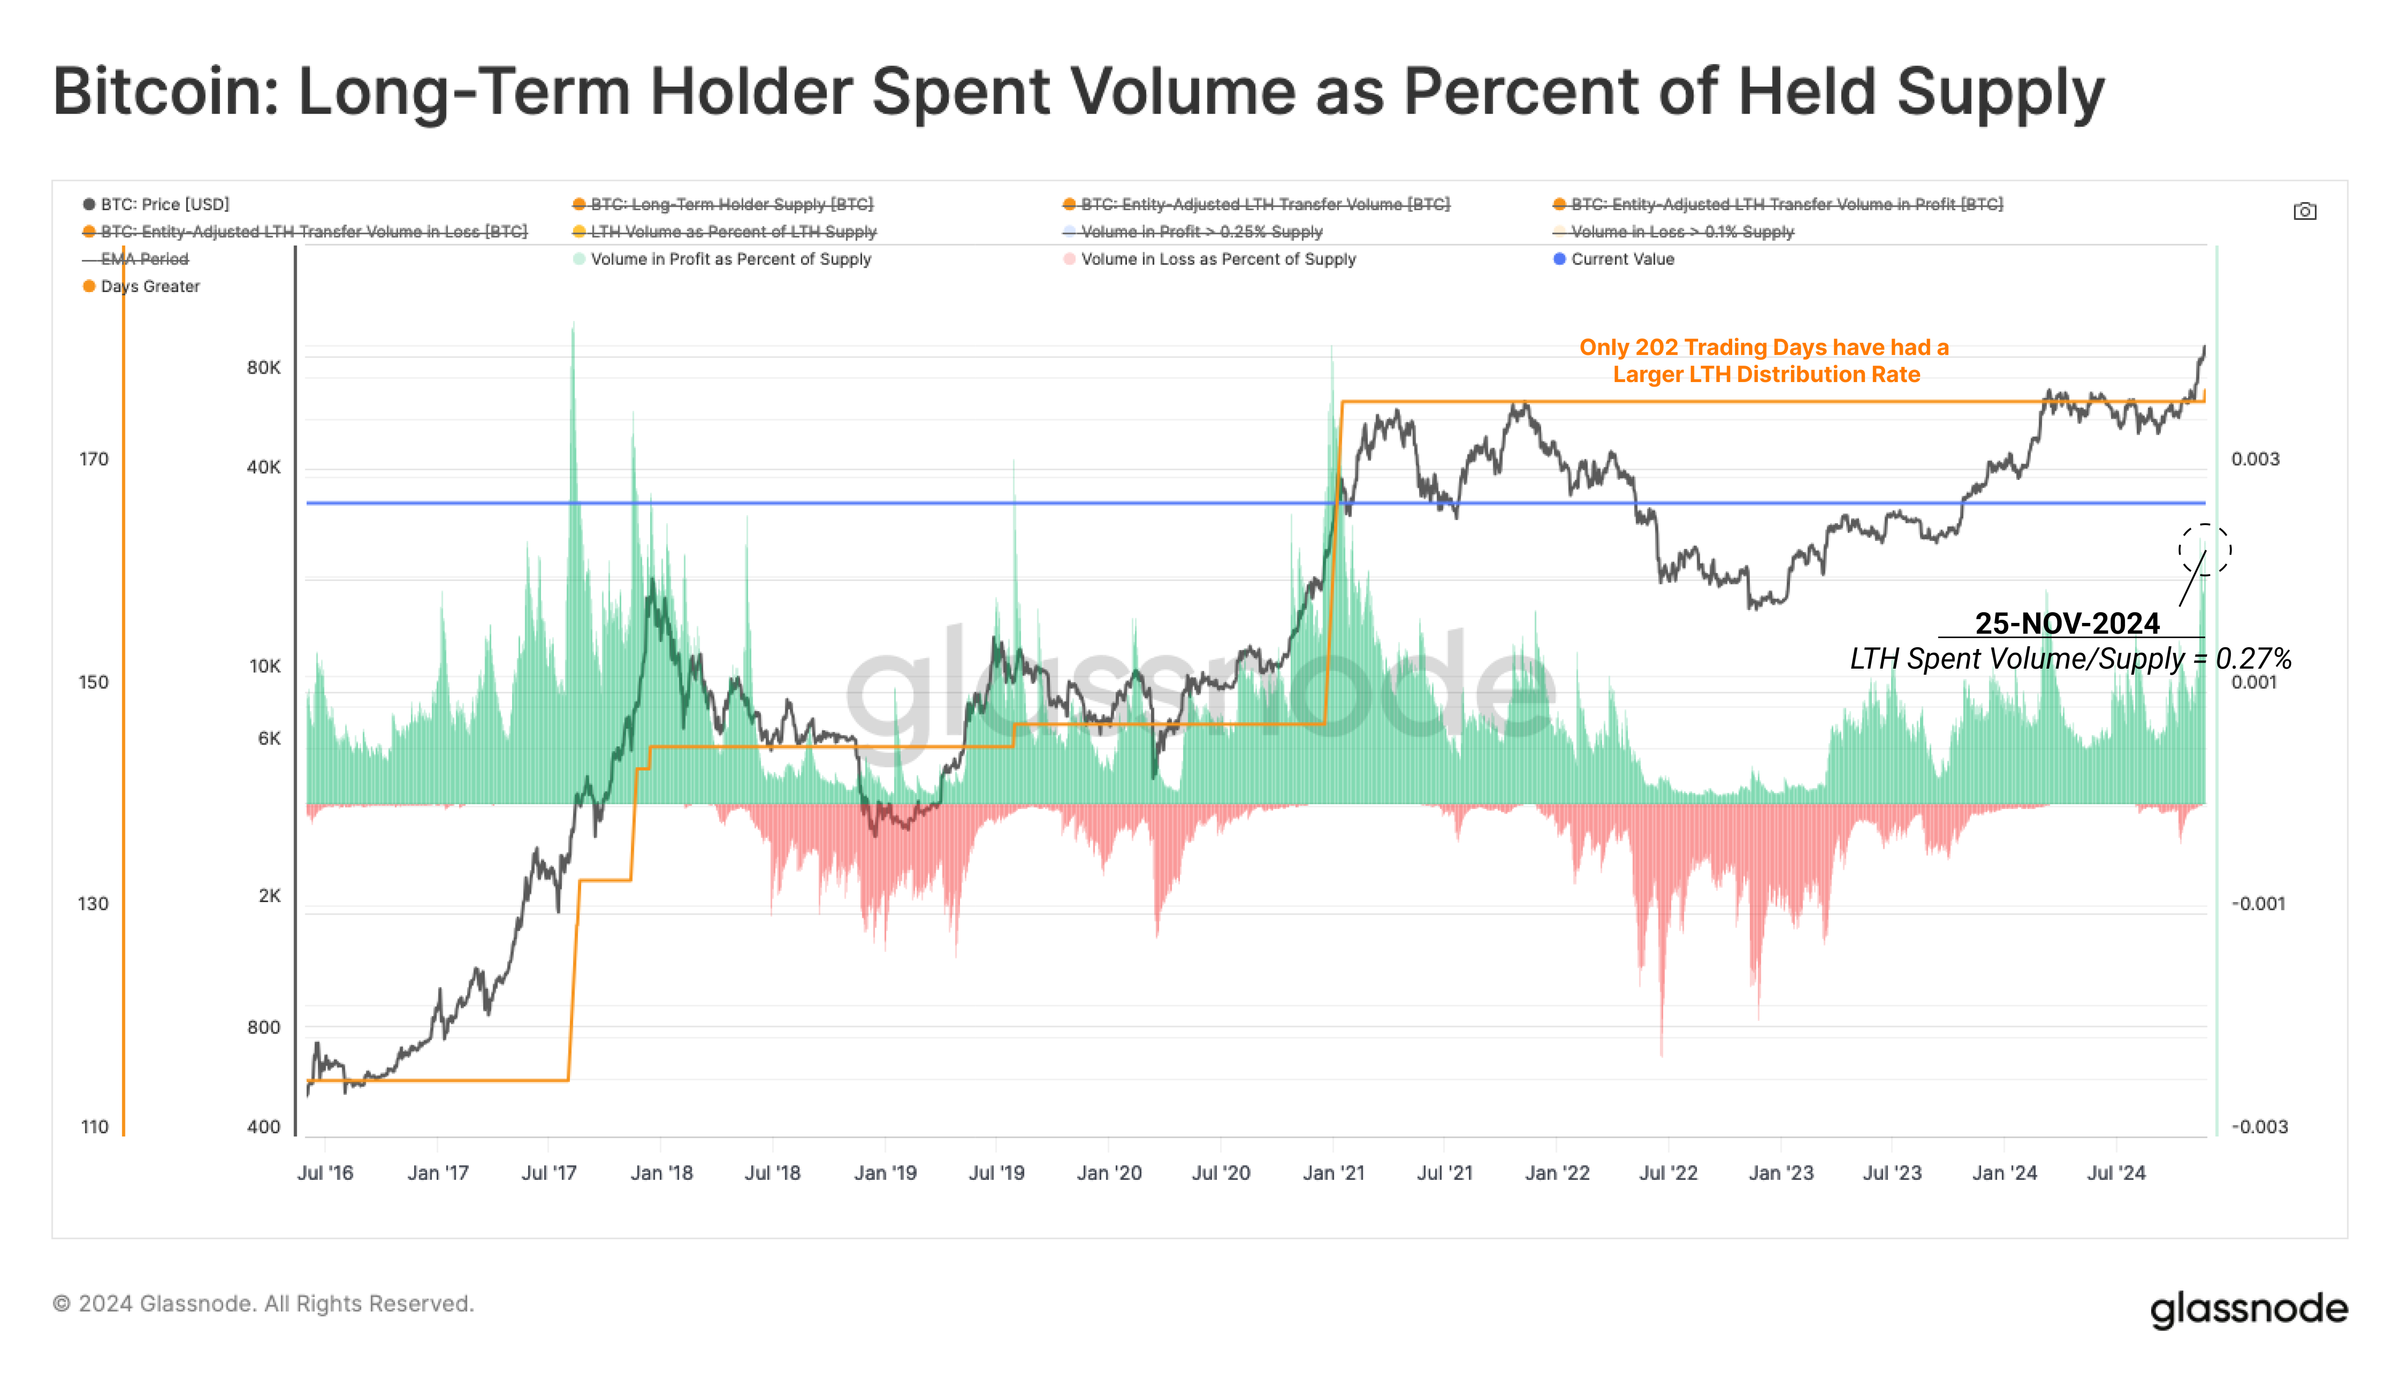
After Bitcoin's price has set new highs, the current price is approaching the much-anticipated $100,000 level. As in previous cycles, the long-term holder group is using the influx of capital and increased demand to massively restart the distribution of their Bitcoin supply. Since the long-term holder supply peaked in September, this group has distributed 507,000 bitcoins. This scale, although lower than the 934,000 bitcoins distributed during the March 2024 ATH period, is still significant.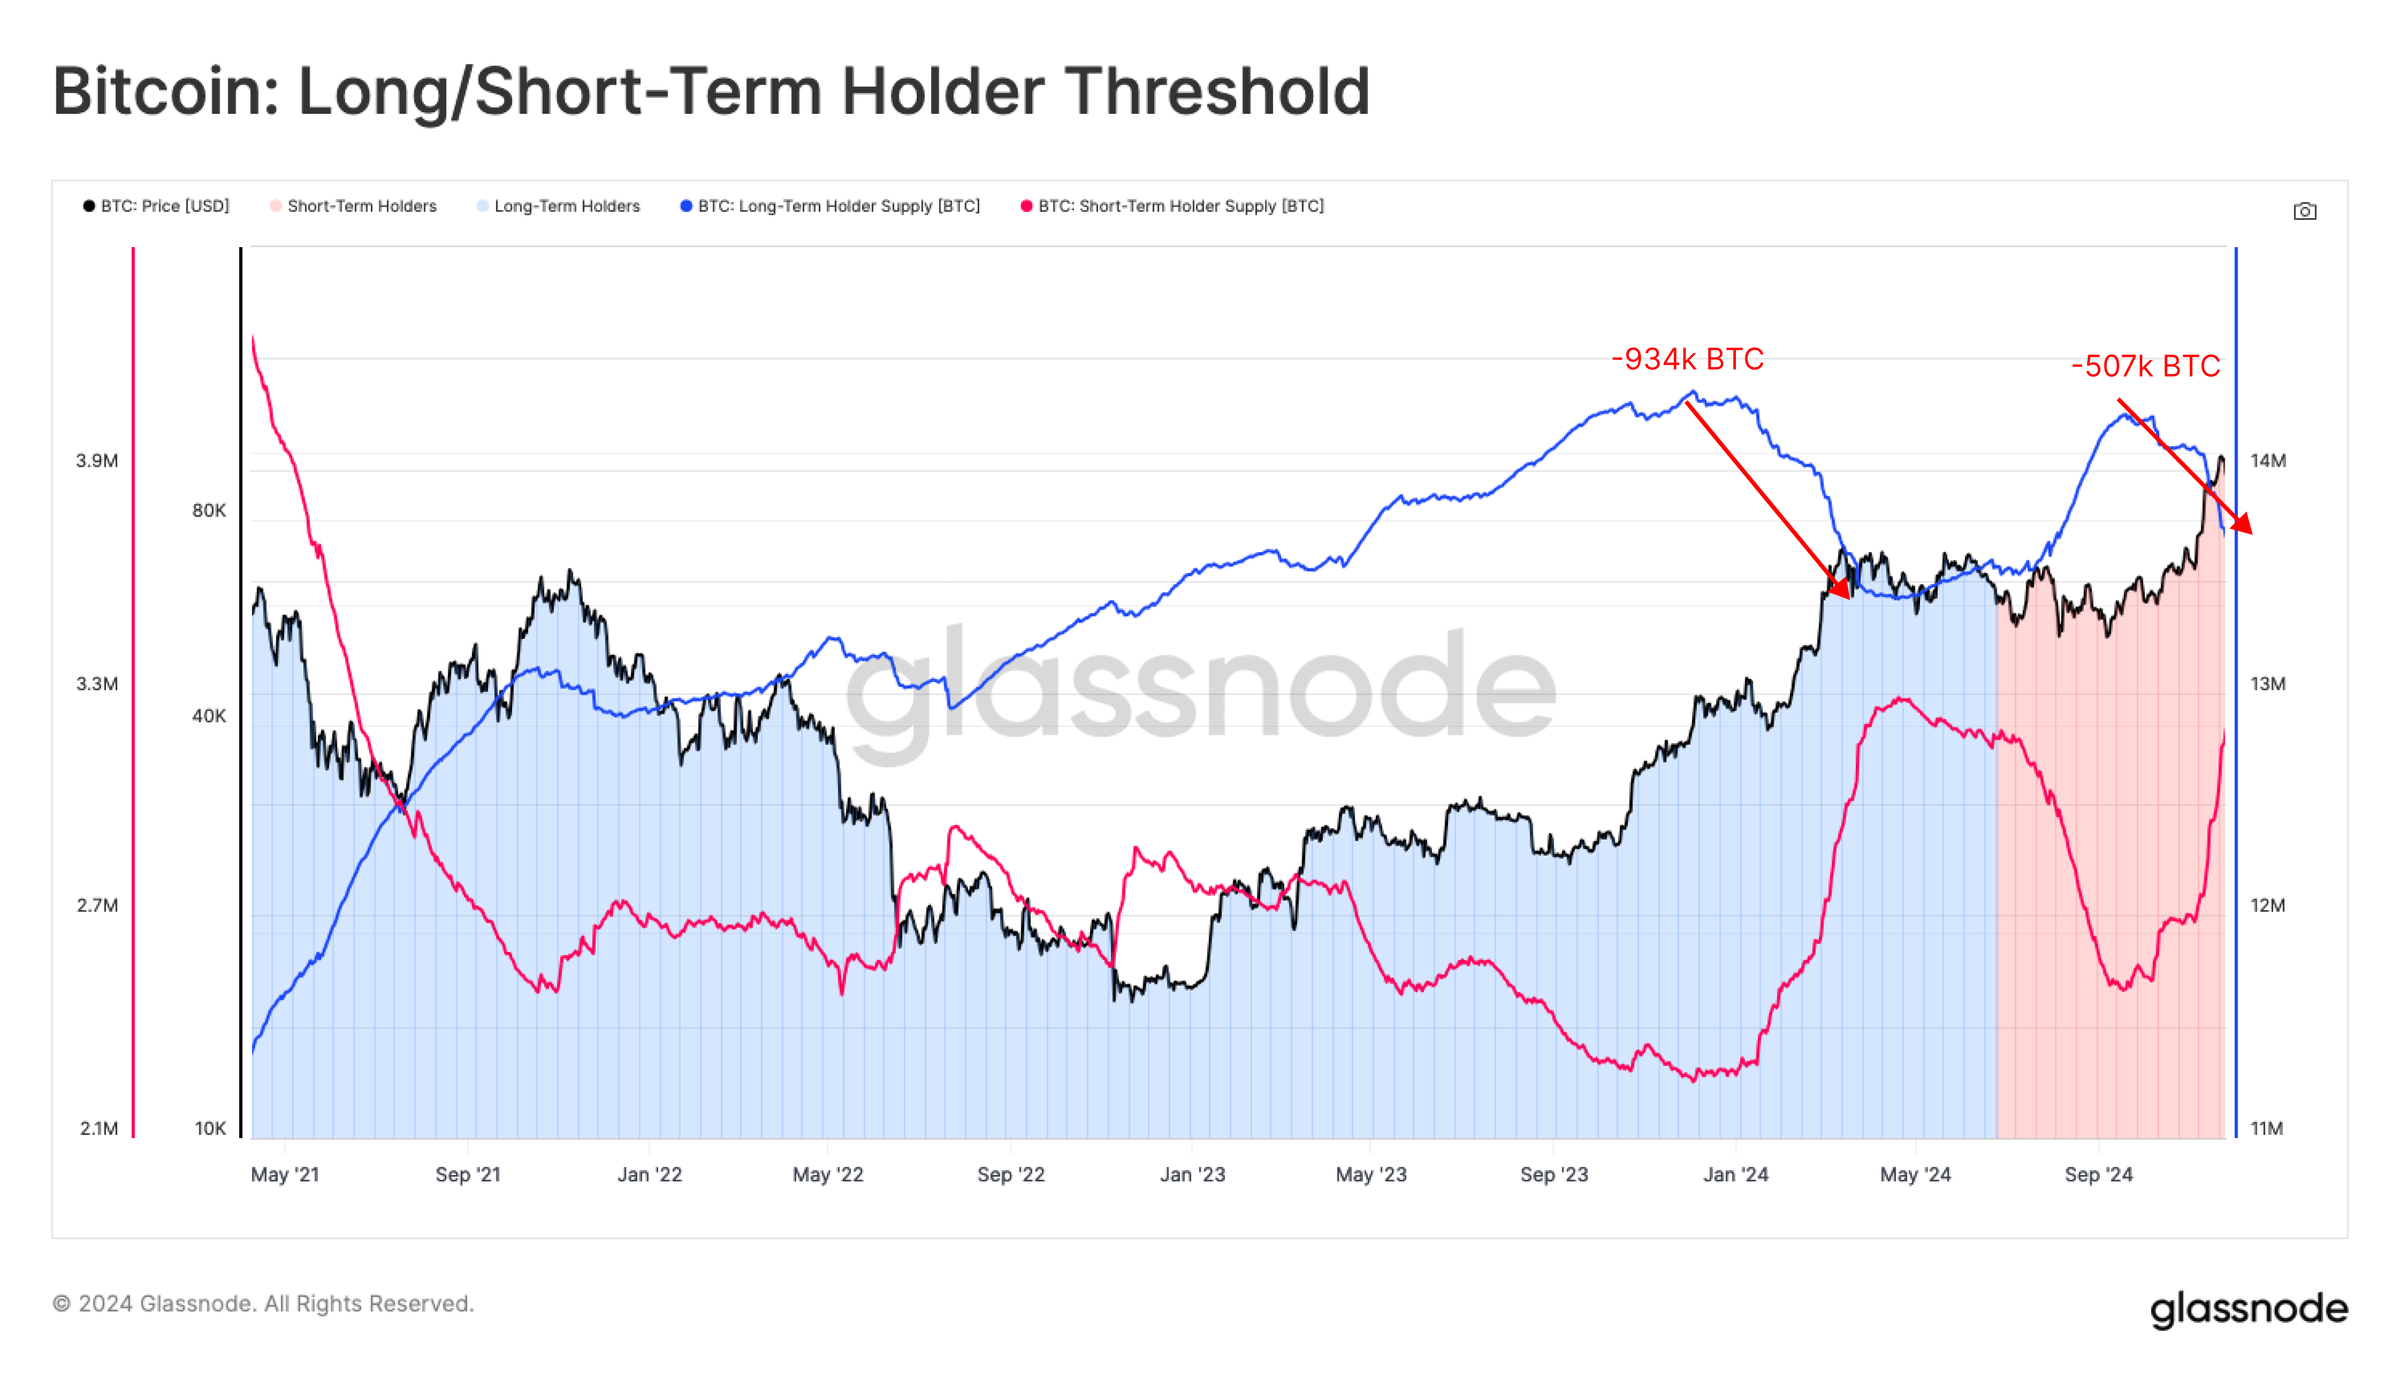 By analyzing the percentage of the total supply that long-term holders have moved from their profitable positions, a similar conclusion can be drawn. Currently, the average daily distribution volume accounts for 0.27% of the long-term holder supply, a level exceeded on only 177 trading days in history.
Notably, compared to the March 2024 ATH, the current long-term holder distribution rate is relatively higher, indicating that this distribution activity is more aggressive.
By analyzing the percentage of the total supply that long-term holders have moved from their profitable positions, a similar conclusion can be drawn. Currently, the average daily distribution volume accounts for 0.27% of the long-term holder supply, a level exceeded on only 177 trading days in history.
Notably, compared to the March 2024 ATH, the current long-term holder distribution rate is relatively higher, indicating that this distribution activity is more aggressive.
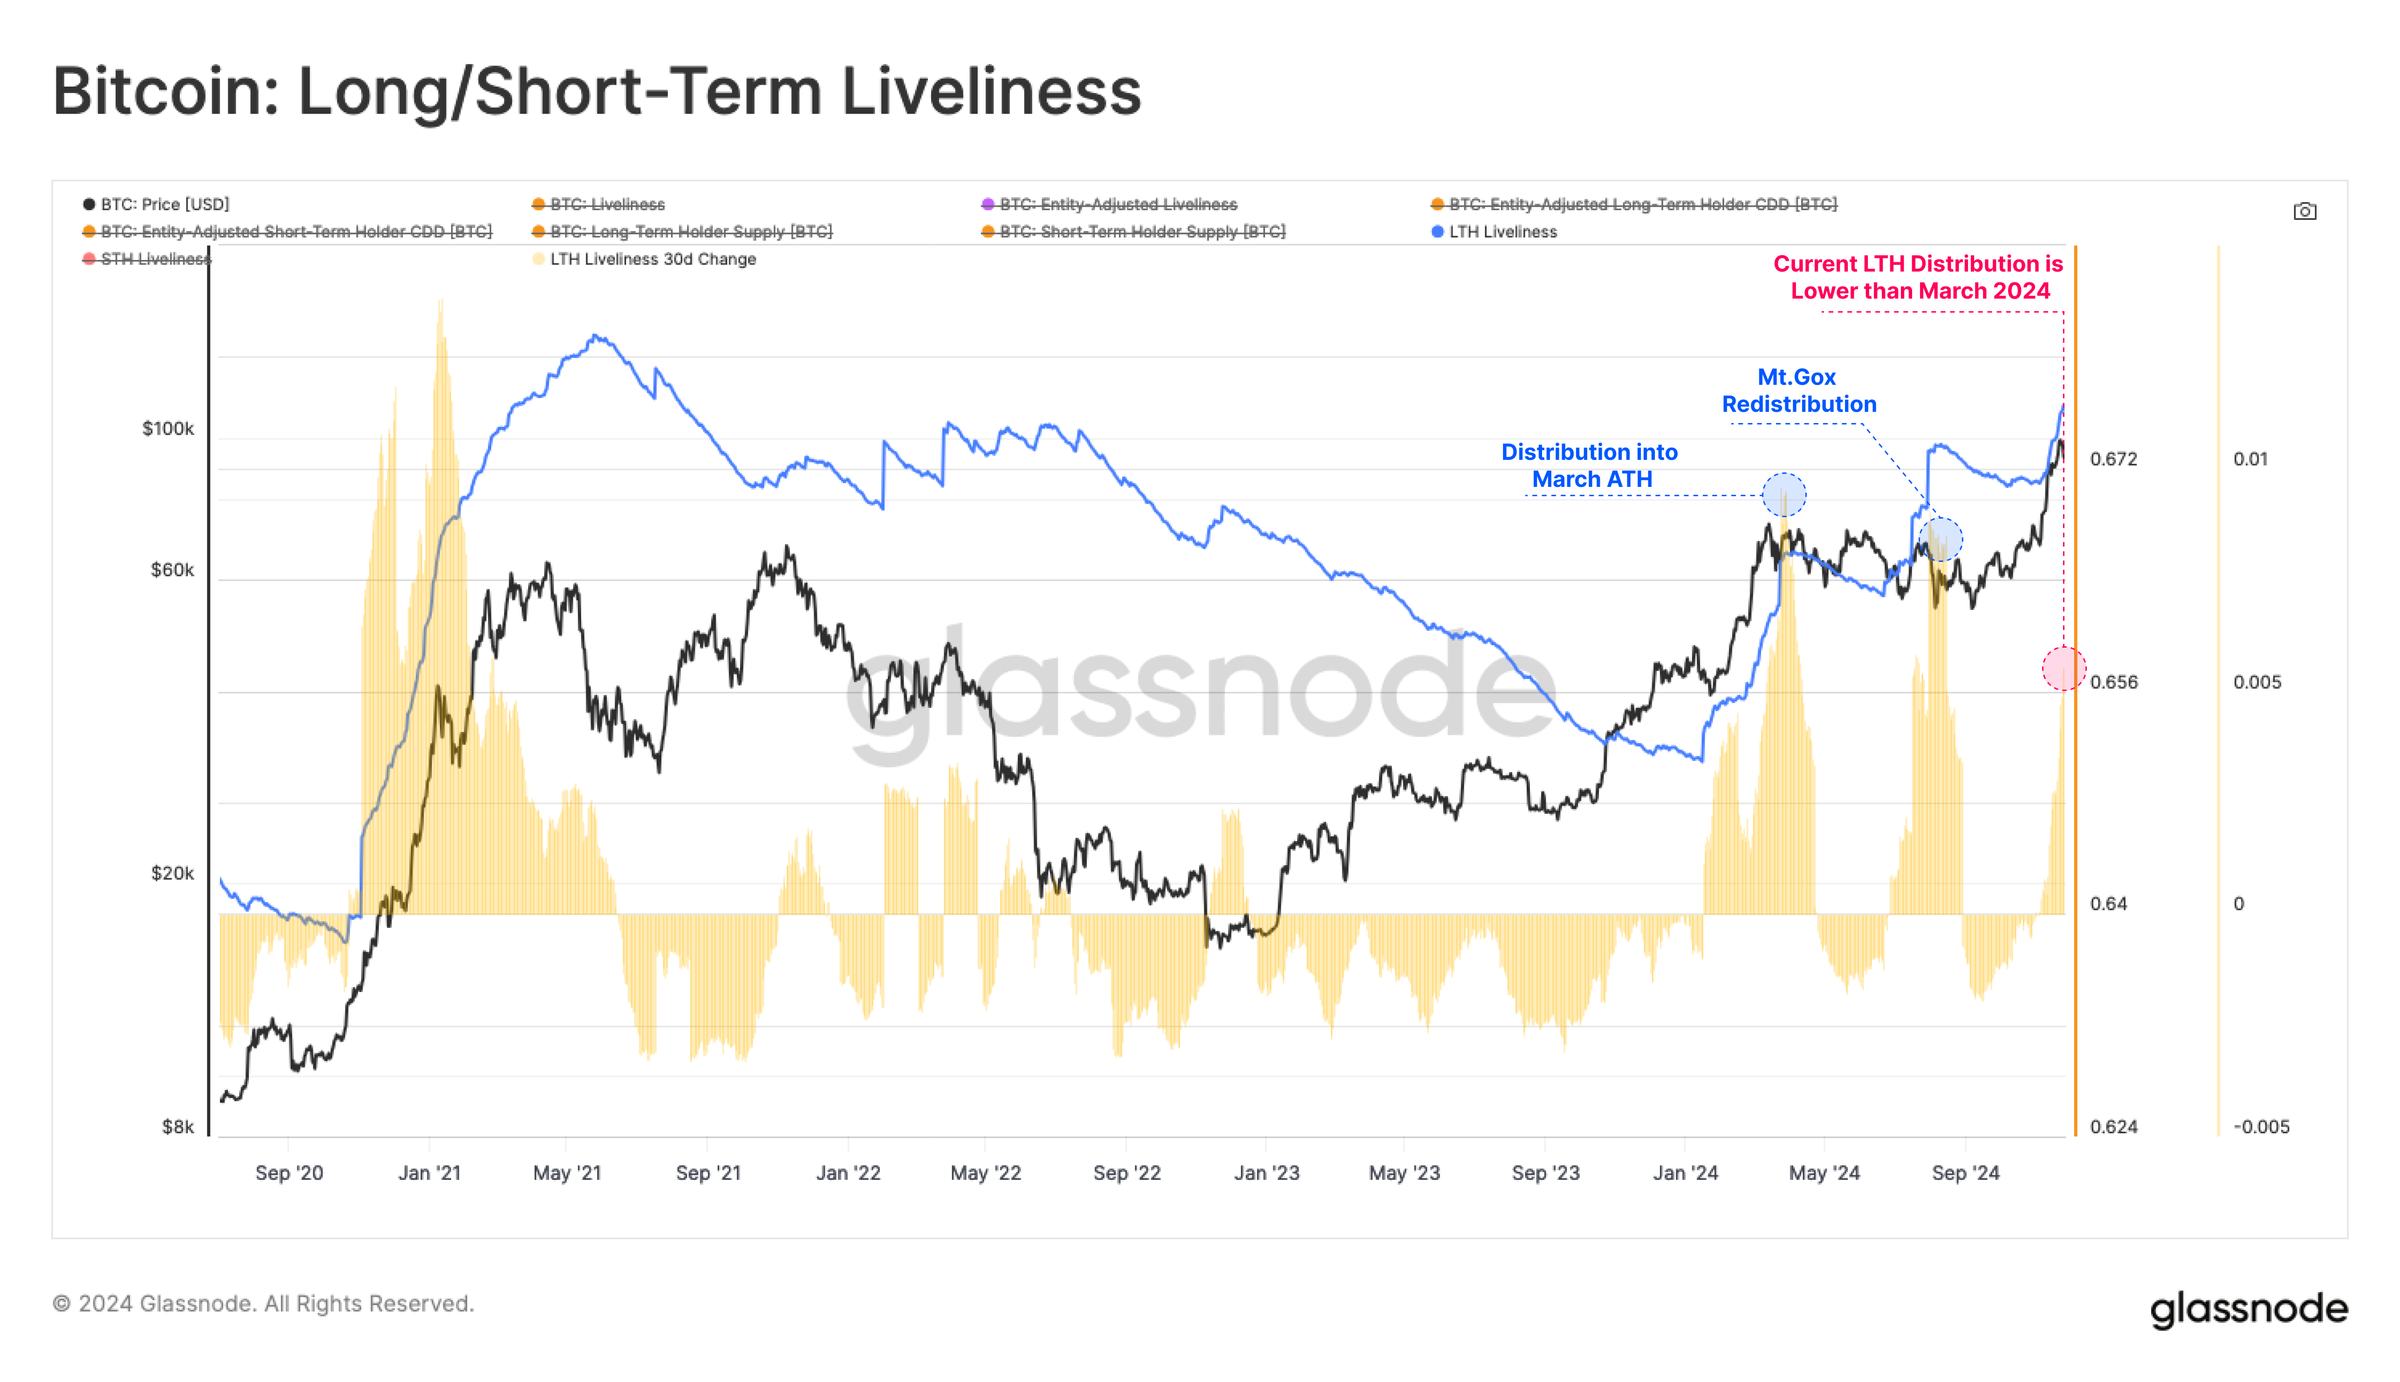
 Through the "Liveliness" metric of long-term holders, we can assess the balance between Coin Day Creation and Coin Day Destruction. Generally, an increase in Liveliness indicates an increase in spending activity, while a decrease indicates that holding behavior dominates.
Although the current supply distribution rate exceeds the March peak, the Coin Day Destruction is still lower than the March peak. This suggests that the long-term holders currently trading are more likely to have recently acquired their coins (e.g., an average age of 6 months rather than 5 years).
Through the "Liveliness" metric of long-term holders, we can assess the balance between Coin Day Creation and Coin Day Destruction. Generally, an increase in Liveliness indicates an increase in spending activity, while a decrease indicates that holding behavior dominates.
Although the current supply distribution rate exceeds the March peak, the Coin Day Destruction is still lower than the March peak. This suggests that the long-term holders currently trading are more likely to have recently acquired their coins (e.g., an average age of 6 months rather than 5 years).
Locking in Profits
Long-term holders play a crucial role in the price discovery process, as they are an important source of reintroducing dormant supply into circulation. As the bull market progresses, it becomes increasingly important to assess the profitability of this group, as price increases will encourage their activity. Currently, the single-day realized profits of long-term holders have reached a new high of $2.02 billion, surpassing the record set in March. Absorbing this supply overhang requires strong demand-side, and the market may need to experience a period of re-accumulation to fully digest it.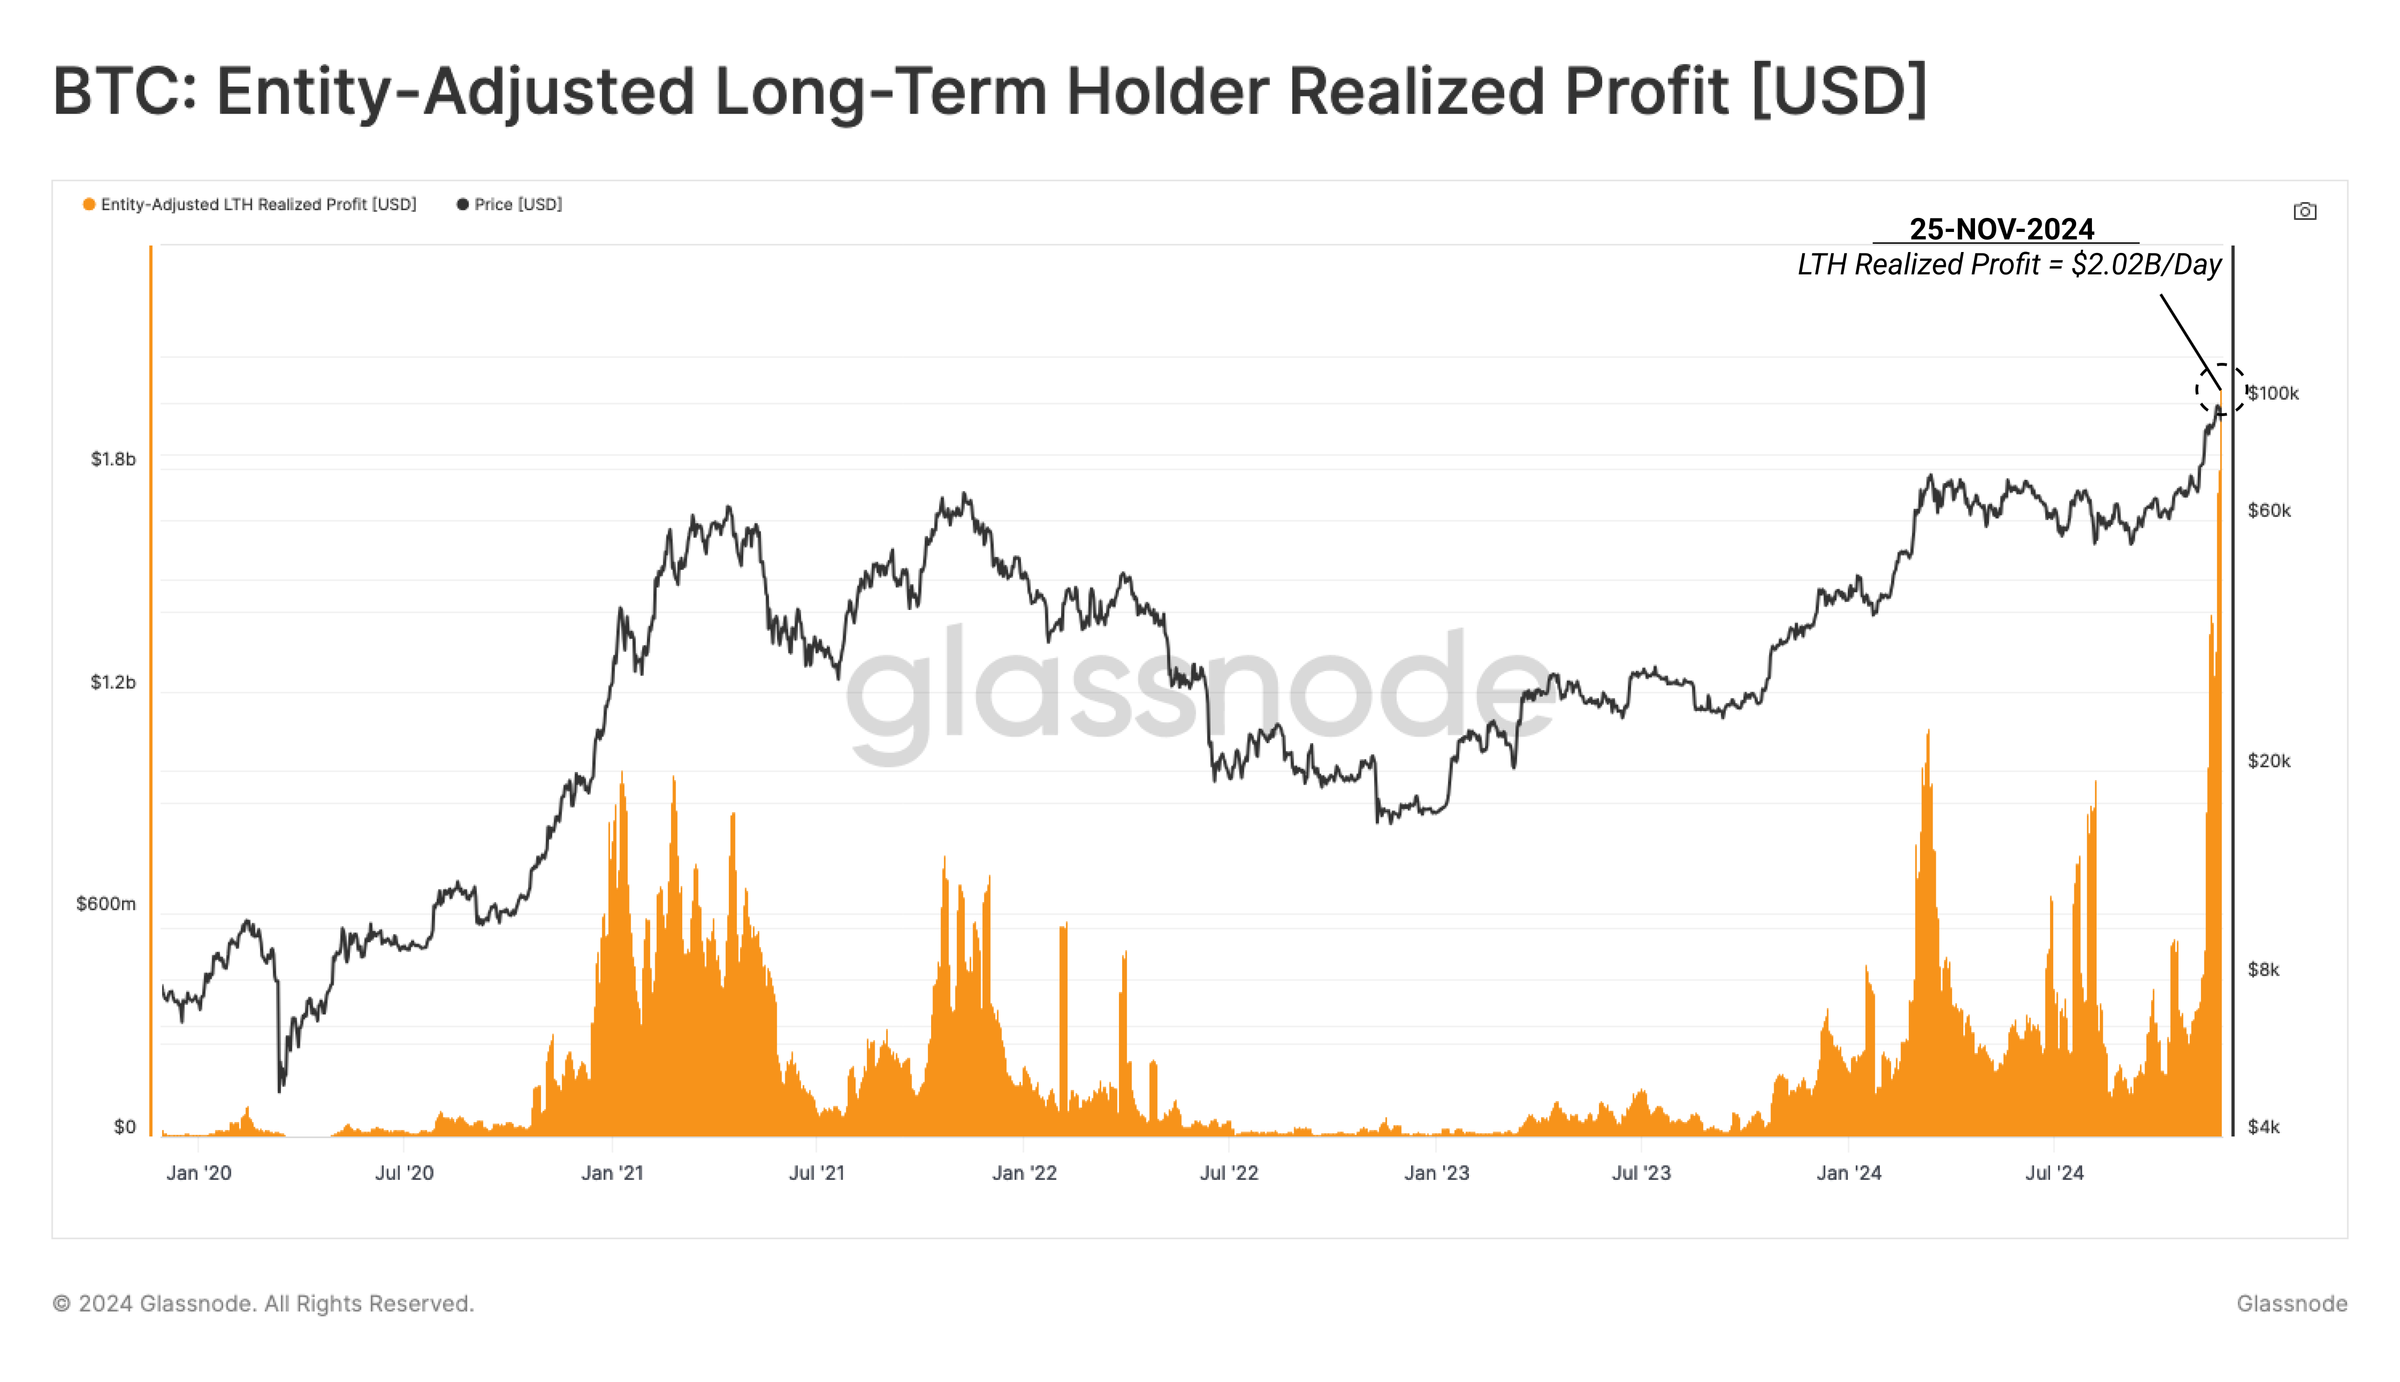 When assessing the balance between long-term holder profits and losses, we can see that the ratio of the two has accelerated rapidly in November. This is because in the current price discovery phase, long-term holders have almost no supply in a loss position.
From a historical perspective, as long as there is a large and stable influx of new demand, prices typically remain in a frenzy for several months.
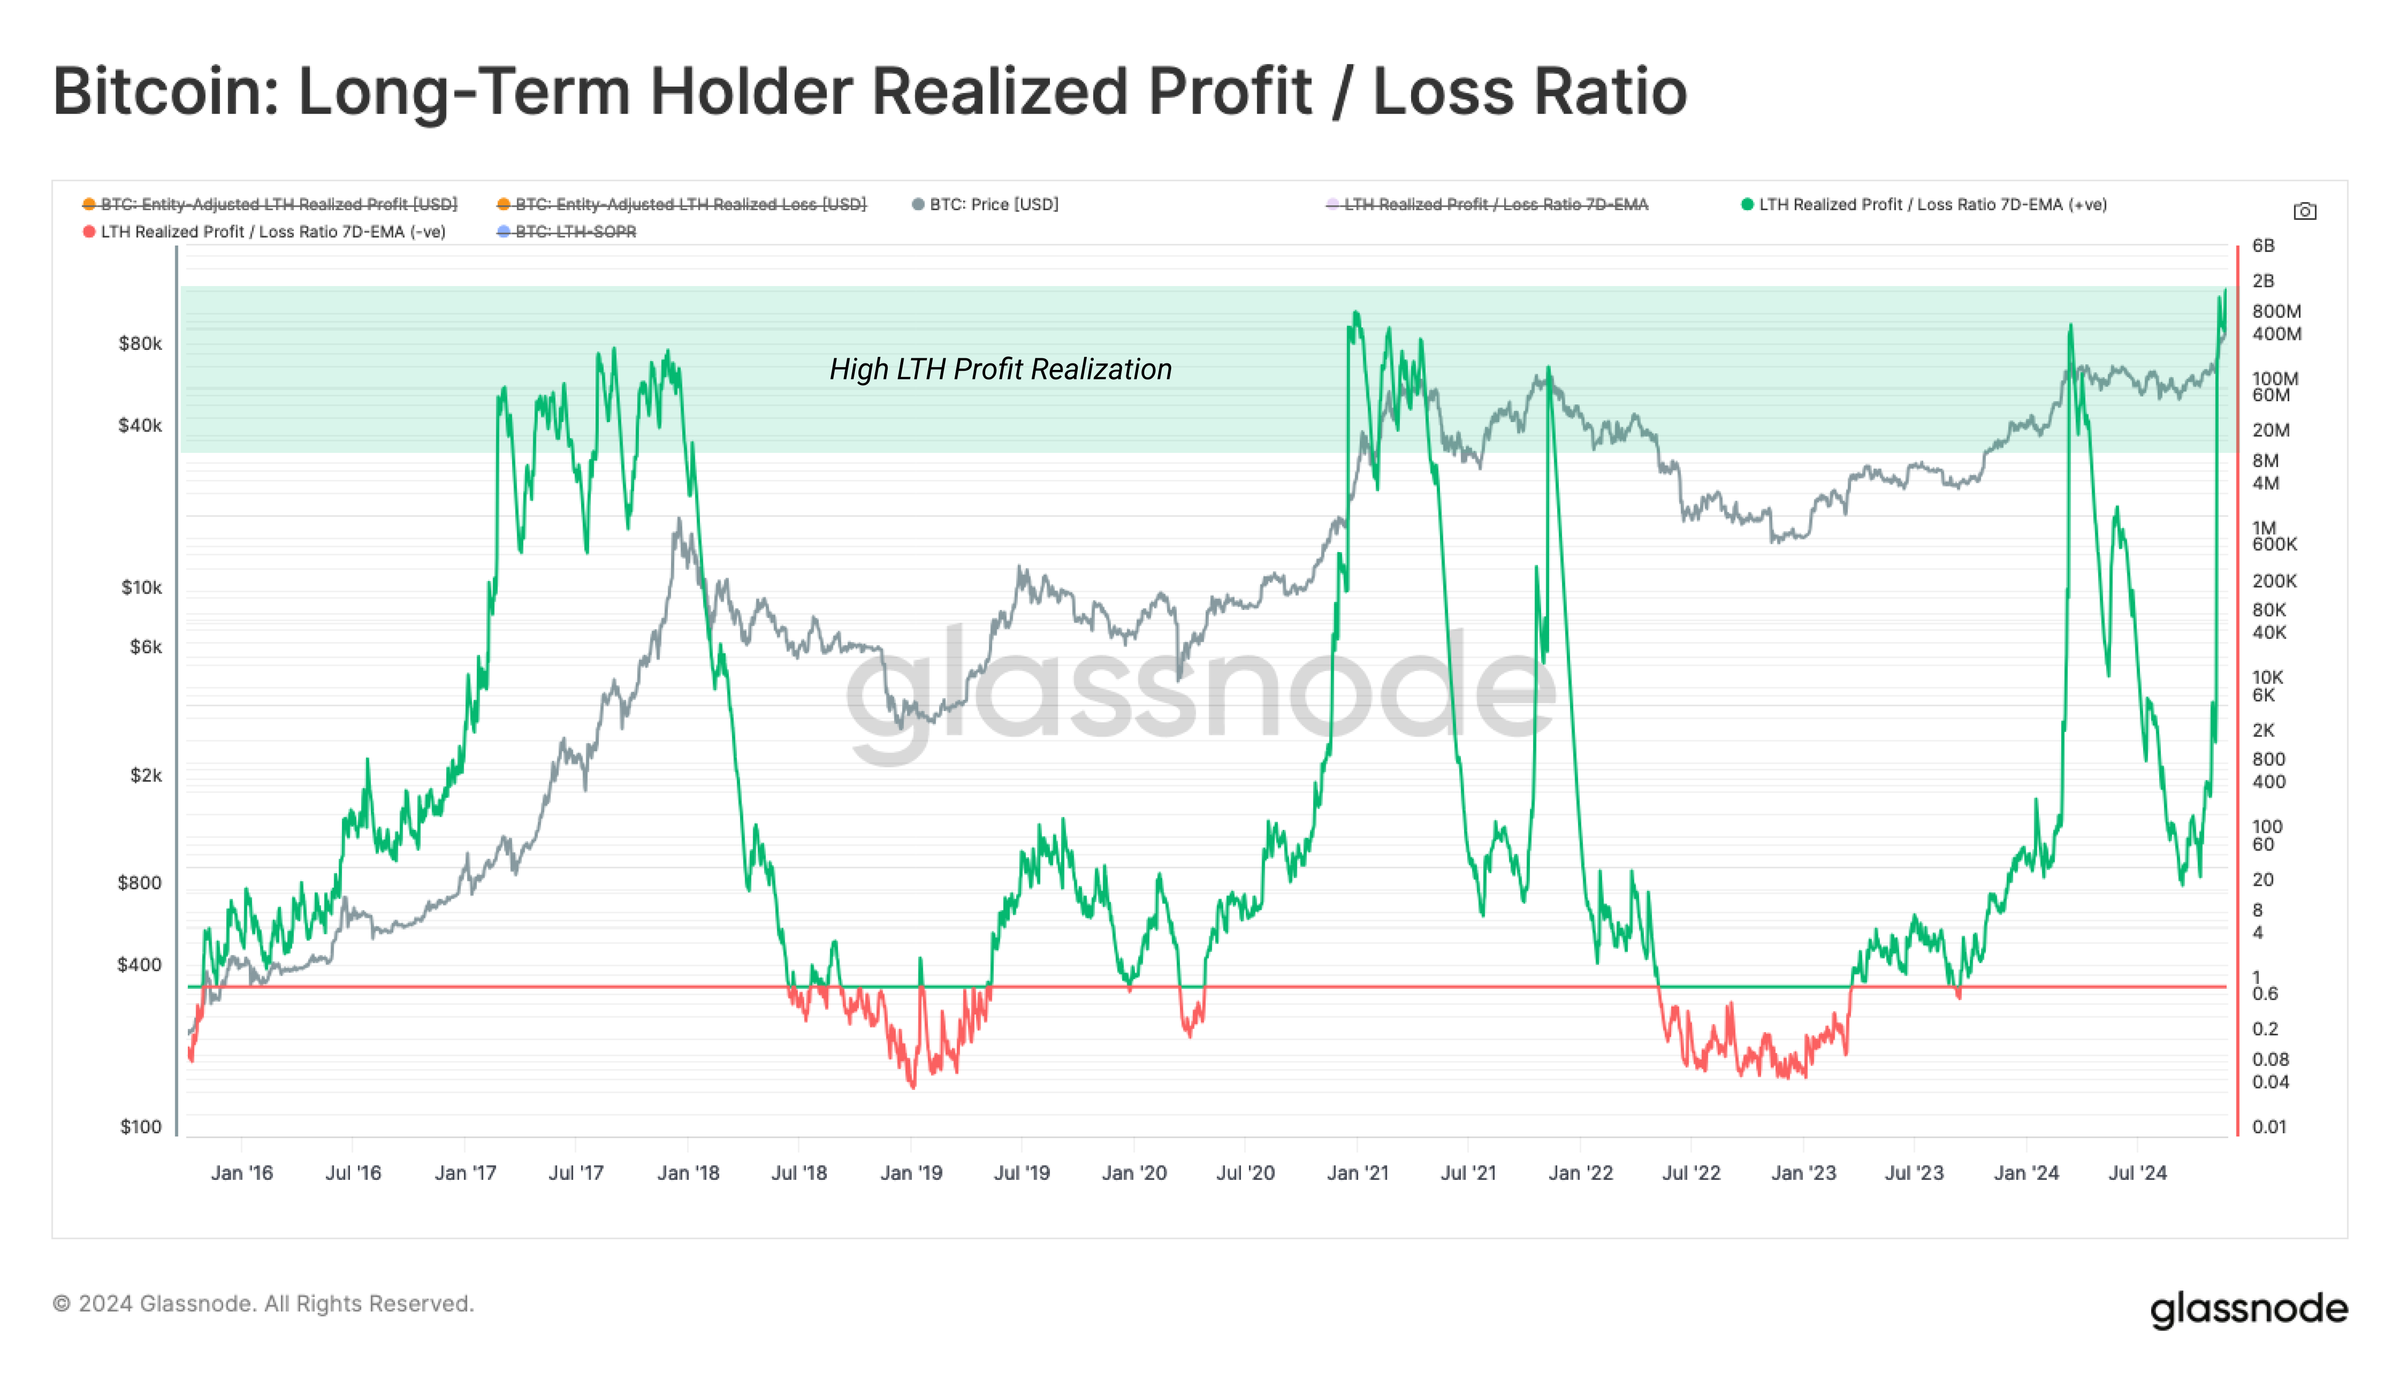
When assessing the balance between long-term holder profits and losses, we can see that the ratio of the two has accelerated rapidly in November. This is because in the current price discovery phase, long-term holders have almost no supply in a loss position.
From a historical perspective, as long as there is a large and stable influx of new demand, prices typically remain in a frenzy for several months.
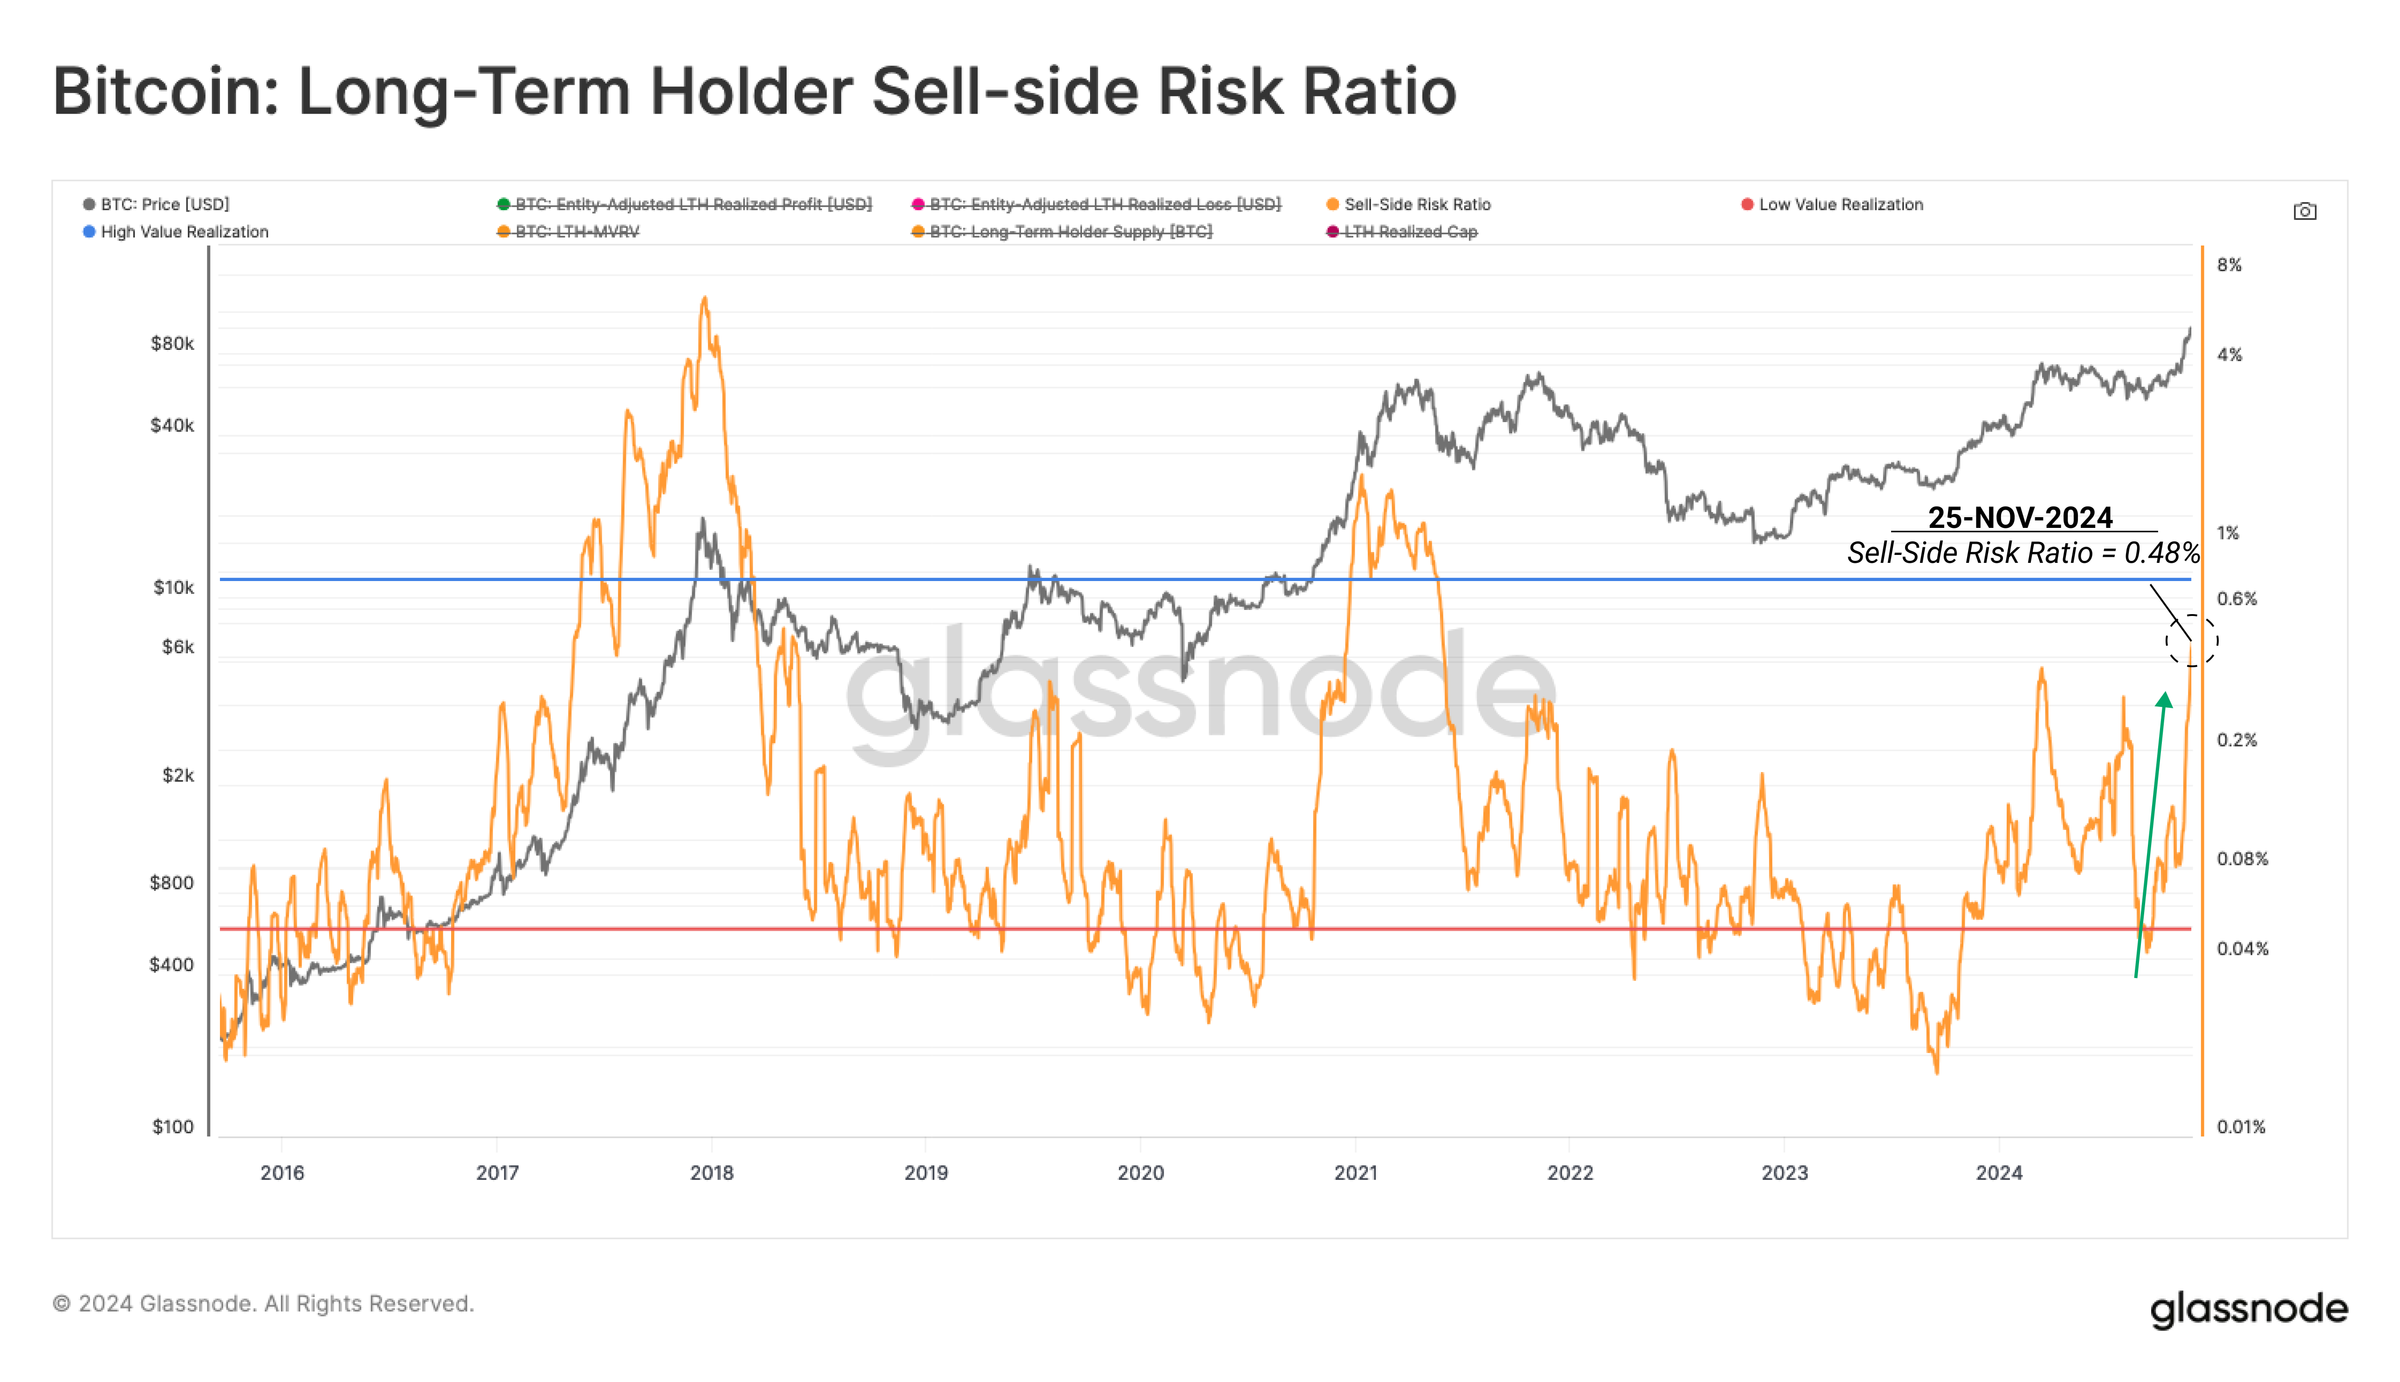
 The Sell-Side Risk Ratio is used to assess the total profits and losses realized by investors relative to the asset's market value. This indicator can be interpreted as follows:
- High values indicate that investors have realized large profits or losses relative to their cost basis, which typically means the market needs to find a new balance, often accompanied by high-volatility price movements.
- Low values indicate that most coins are trading at prices close to the cost basis, suggesting the market has reached a certain degree of balance, which is usually reflected in a low-volatility environment.
Currently, the Sell-Side Risk Ratio is approaching the high-value range, suggesting significant profiting behavior within the current price range. However, the current reading is still far below the peak values of previous cycles. This indicates that the previous bull markets were able to absorb sufficient demand under similar distribution pressures.
The Sell-Side Risk Ratio is used to assess the total profits and losses realized by investors relative to the asset's market value. This indicator can be interpreted as follows:
- High values indicate that investors have realized large profits or losses relative to their cost basis, which typically means the market needs to find a new balance, often accompanied by high-volatility price movements.
- Low values indicate that most coins are trading at prices close to the cost basis, suggesting the market has reached a certain degree of balance, which is usually reflected in a low-volatility environment.
Currently, the Sell-Side Risk Ratio is approaching the high-value range, suggesting significant profiting behavior within the current price range. However, the current reading is still far below the peak values of previous cycles. This indicates that the previous bull markets were able to absorb sufficient demand under similar distribution pressures.
Composition of Distribution Behavior
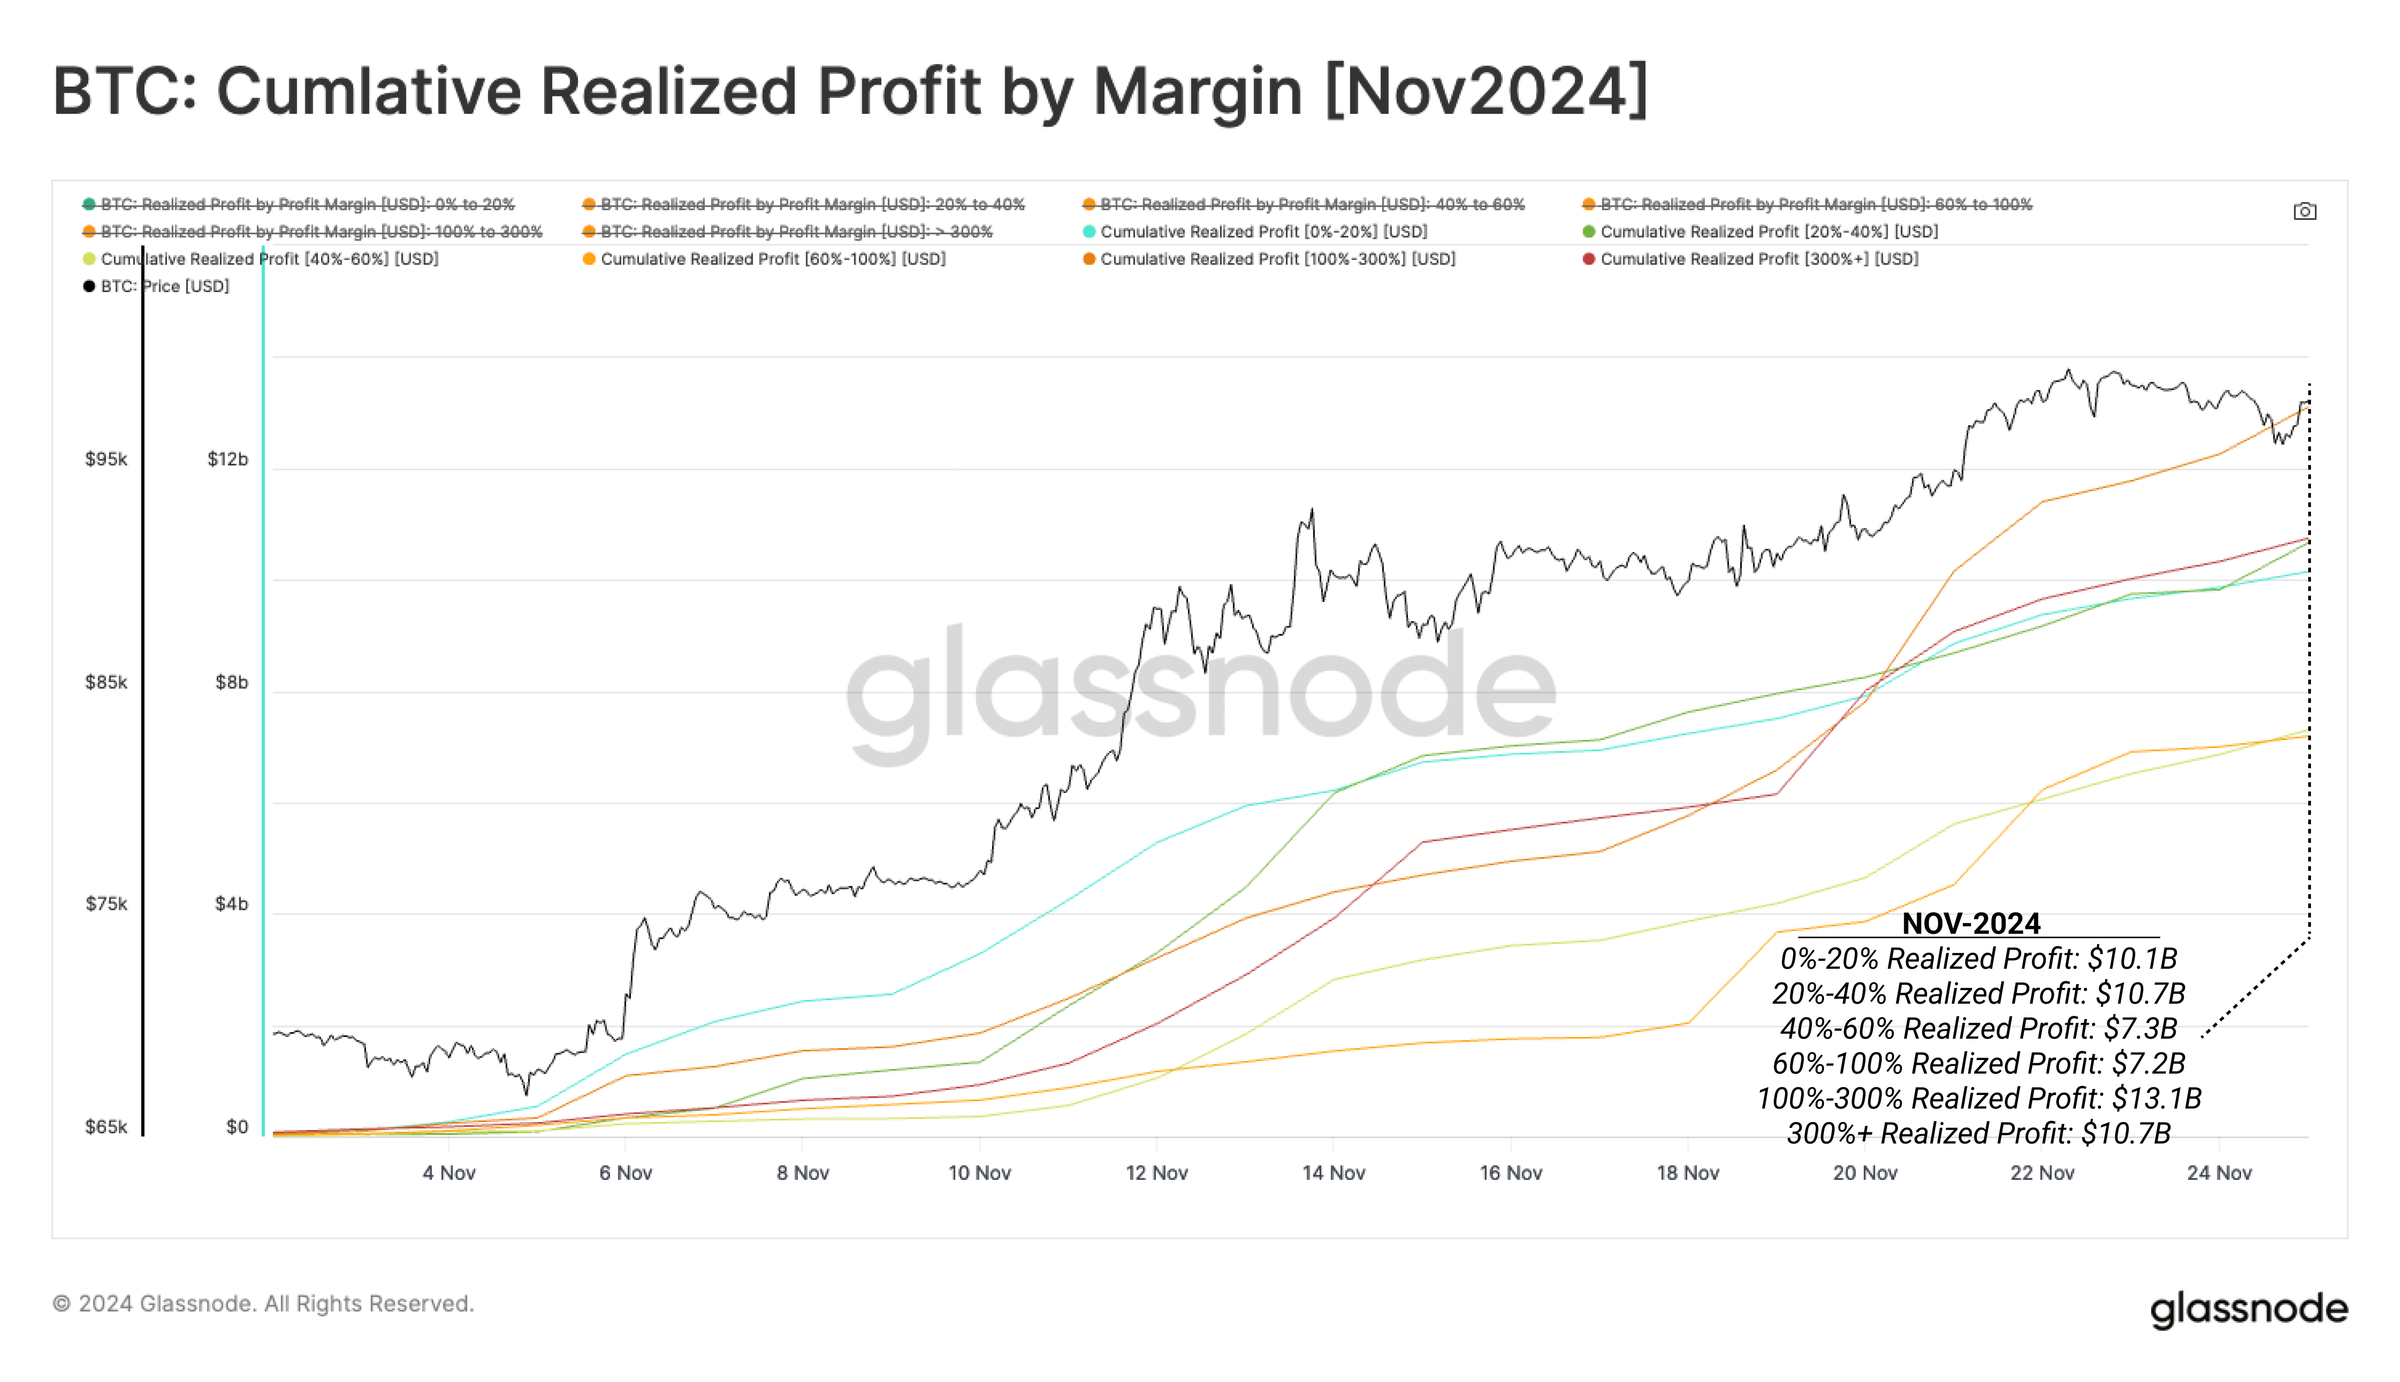
After confirming the significant increase in long-term holder profiting behavior, we can further explore the composition of the distributed supply through more detailed analysis. By analyzing the realized profit data segmented by holding period, we can assess which subgroup contributes the most to the selling pressure. From November 2024, we calculated the cumulative profits for each time period: - 6 months to 1 year: $12.6 billion - 1 year to 2 years: $7.2 billion - 2 years to 3 years: $4.8 billion - 3 years to 5 years: $6.3 billion - Over 5 years: $4.8 billion Bitcoins held for 6 months to 1 year contribute the most to the current selling pressure, accounting for 35.3%. This result suggests that the majority of the selloff comes from recently acquired bitcoins, while long-term investors are more cautious, likely waiting for higher prices. It could be argued that these sales volumes describe a "swing trading" style of investor behavior, who bought in after the ETF launch and plan to profit and exit in the next market cycle.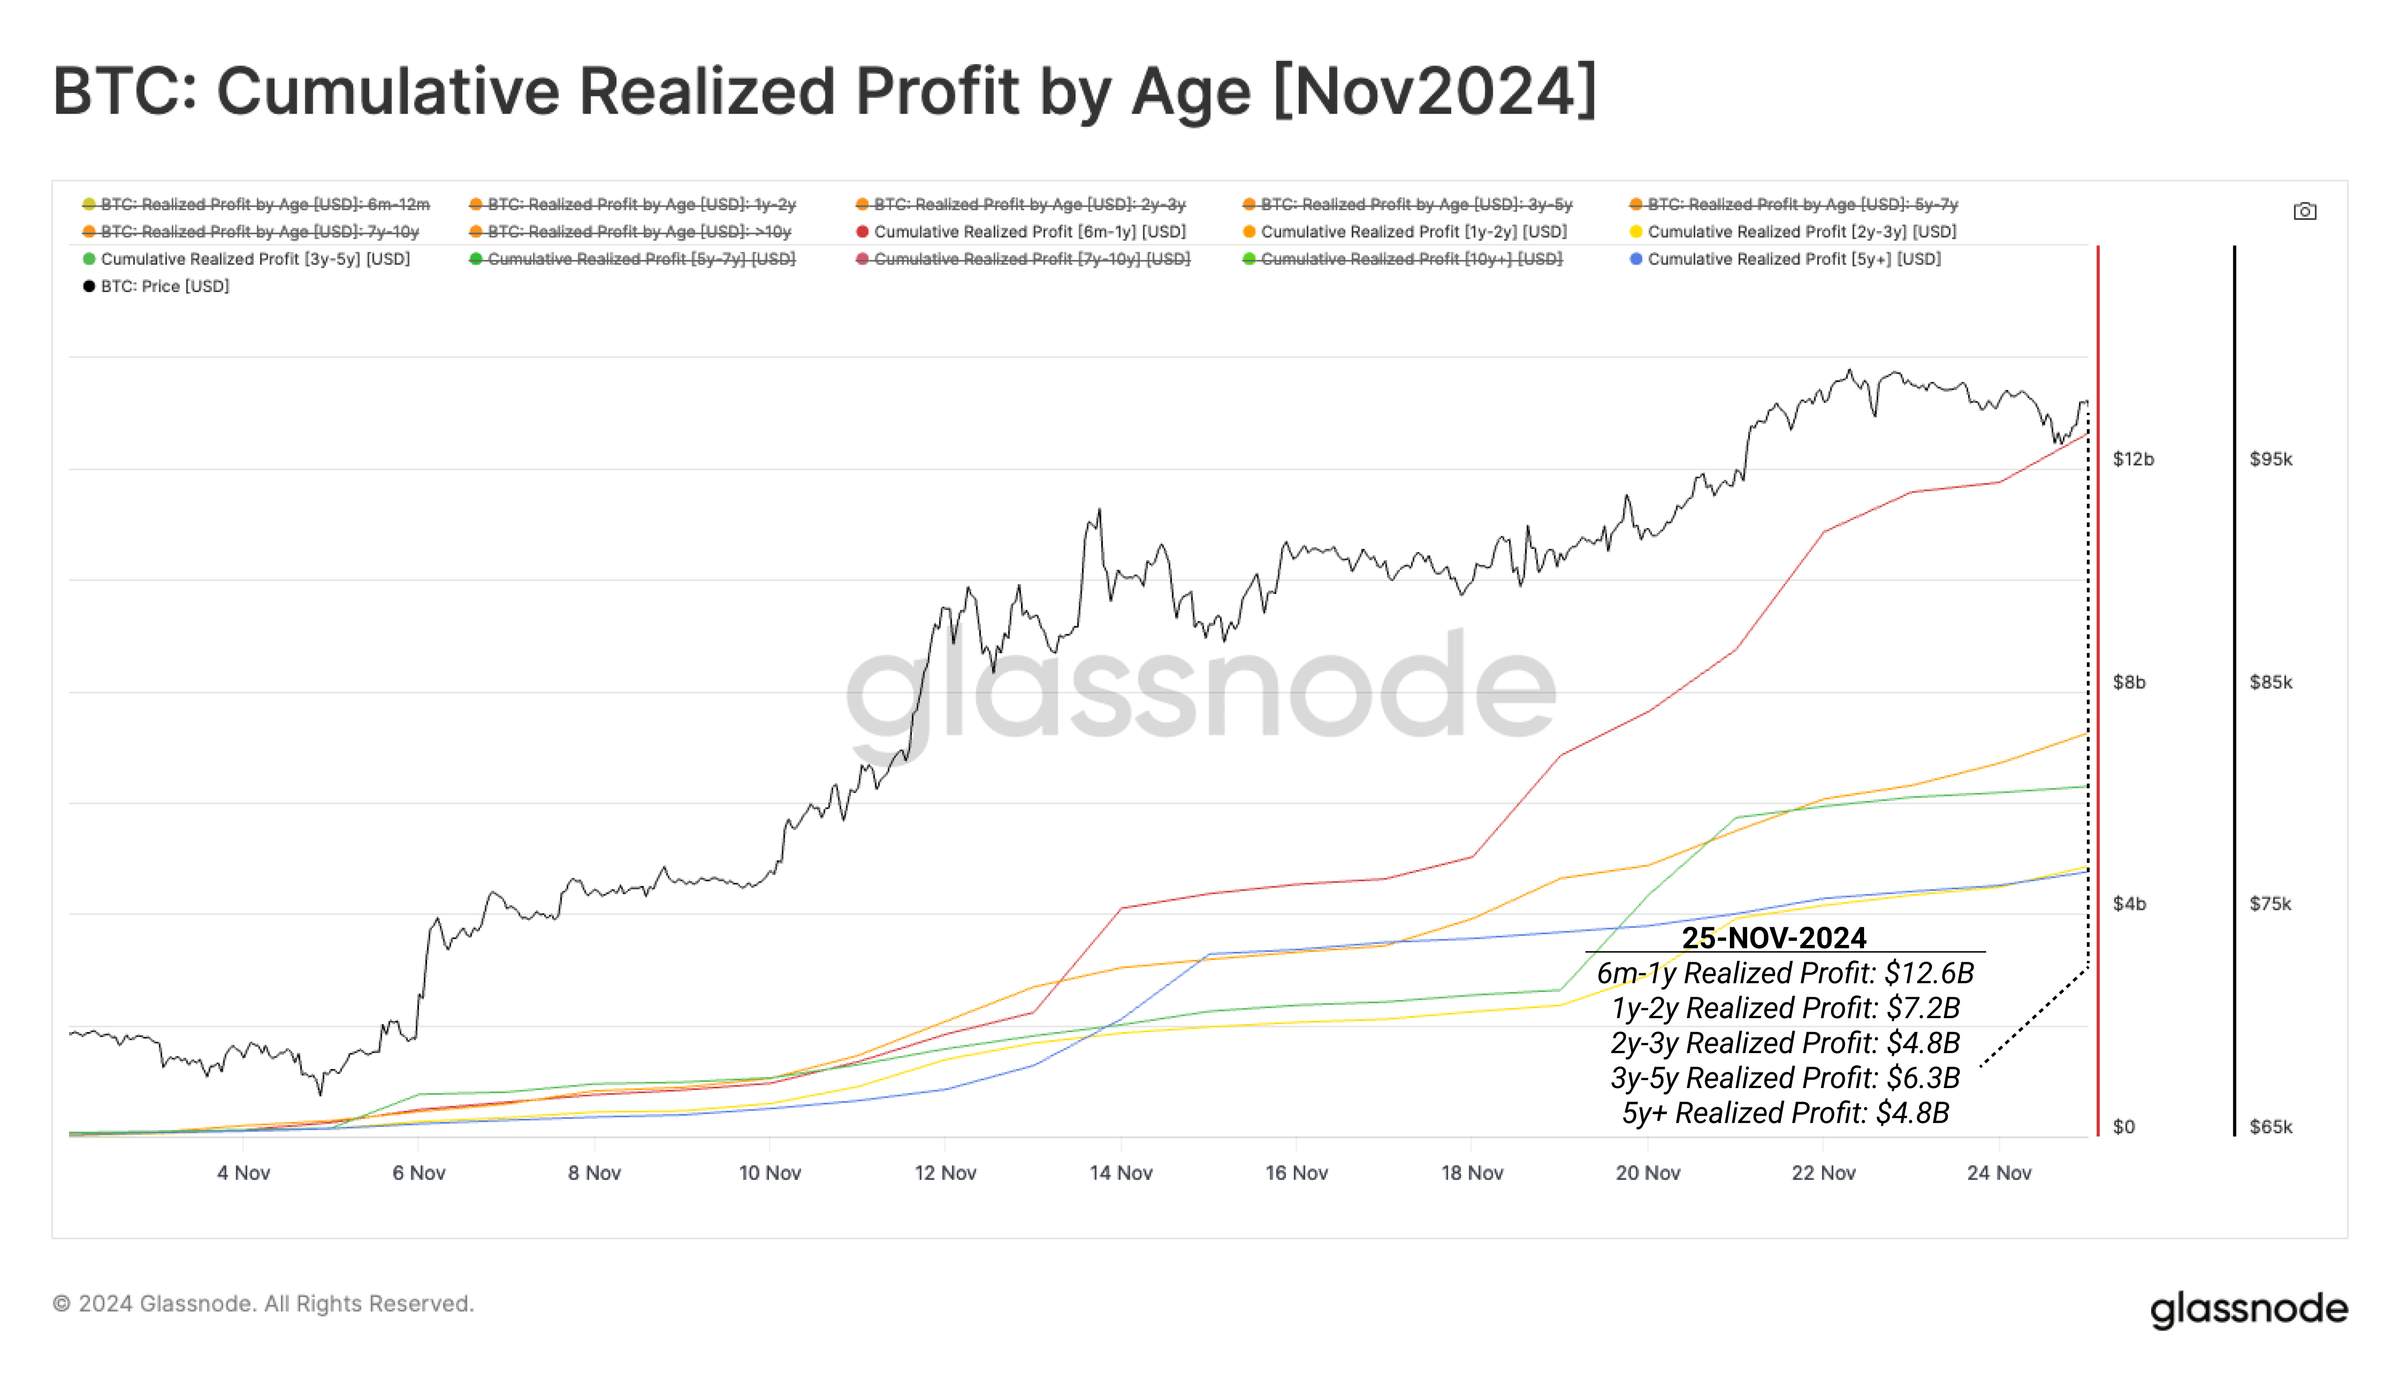 The same method can also be used to analyze the realized profit sizes of all investors, segmented by profit percentage:
- 0%-20%: $10.1 billion
- 20%-40%: $10.7 billion
- 40%-60%: $7.3 billion
- 60%-100%: $7.2 billion
- 100%-300%: $13.1 billion
- 300%+: $10.7 billion
Notably, the profit distribution across these groups is relatively even. This can be seen as a manifestation of a "staged profit-taking" strategy, where lower-cost basis investors realize similar dollar profits by selling fewer coins.
The same method can also be used to analyze the realized profit sizes of all investors, segmented by profit percentage:
- 0%-20%: $10.1 billion
- 20%-40%: $10.7 billion
- 40%-60%: $7.3 billion
- 60%-100%: $7.2 billion
- 100%-300%: $13.1 billion
- 300%+: $10.7 billion
Notably, the profit distribution across these groups is relatively even. This can be seen as a manifestation of a "staged profit-taking" strategy, where lower-cost basis investors realize similar dollar profits by selling fewer coins.
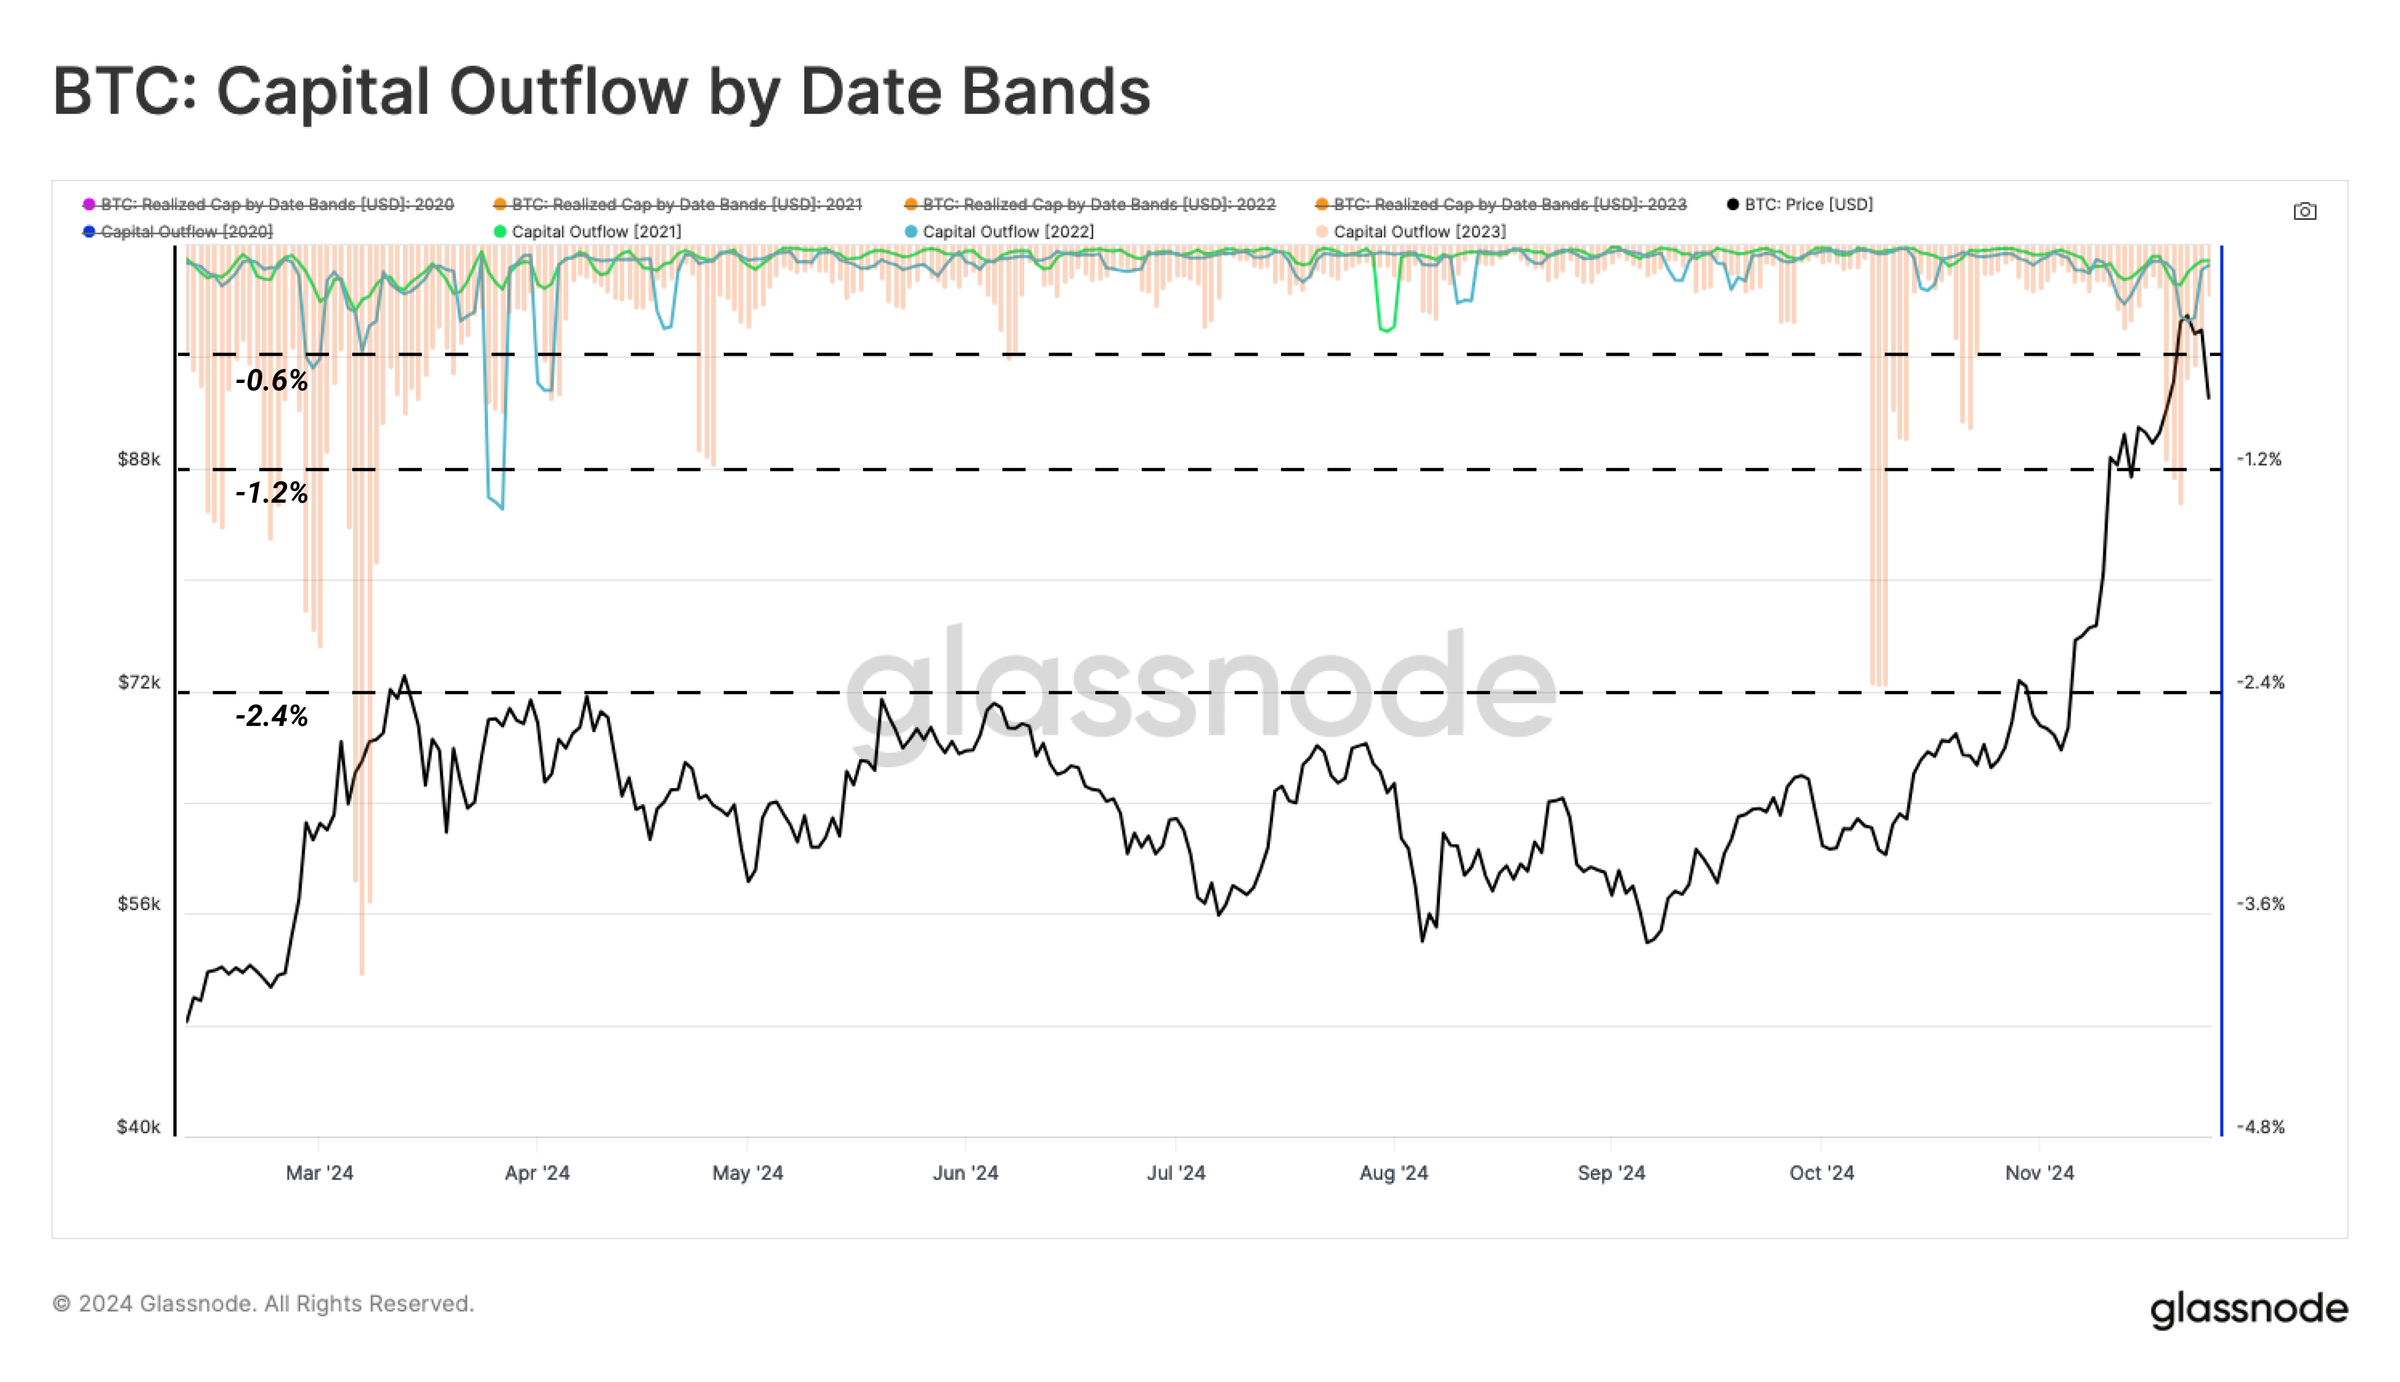
 Specifically observing the coins obtained in 2021, 2022, and 2023, we find that the spending behavior during the March peak covered the coins acquired in those years. However, in the current rebound, the spending is mainly concentrated on the coins obtained in 2023, while the coins from 2021 and 2022 have just started to increase the selling pressure. This result is again consistent with the potential explanation of a "swing trading" style profit-taking strategy.
Sustainability Assessment
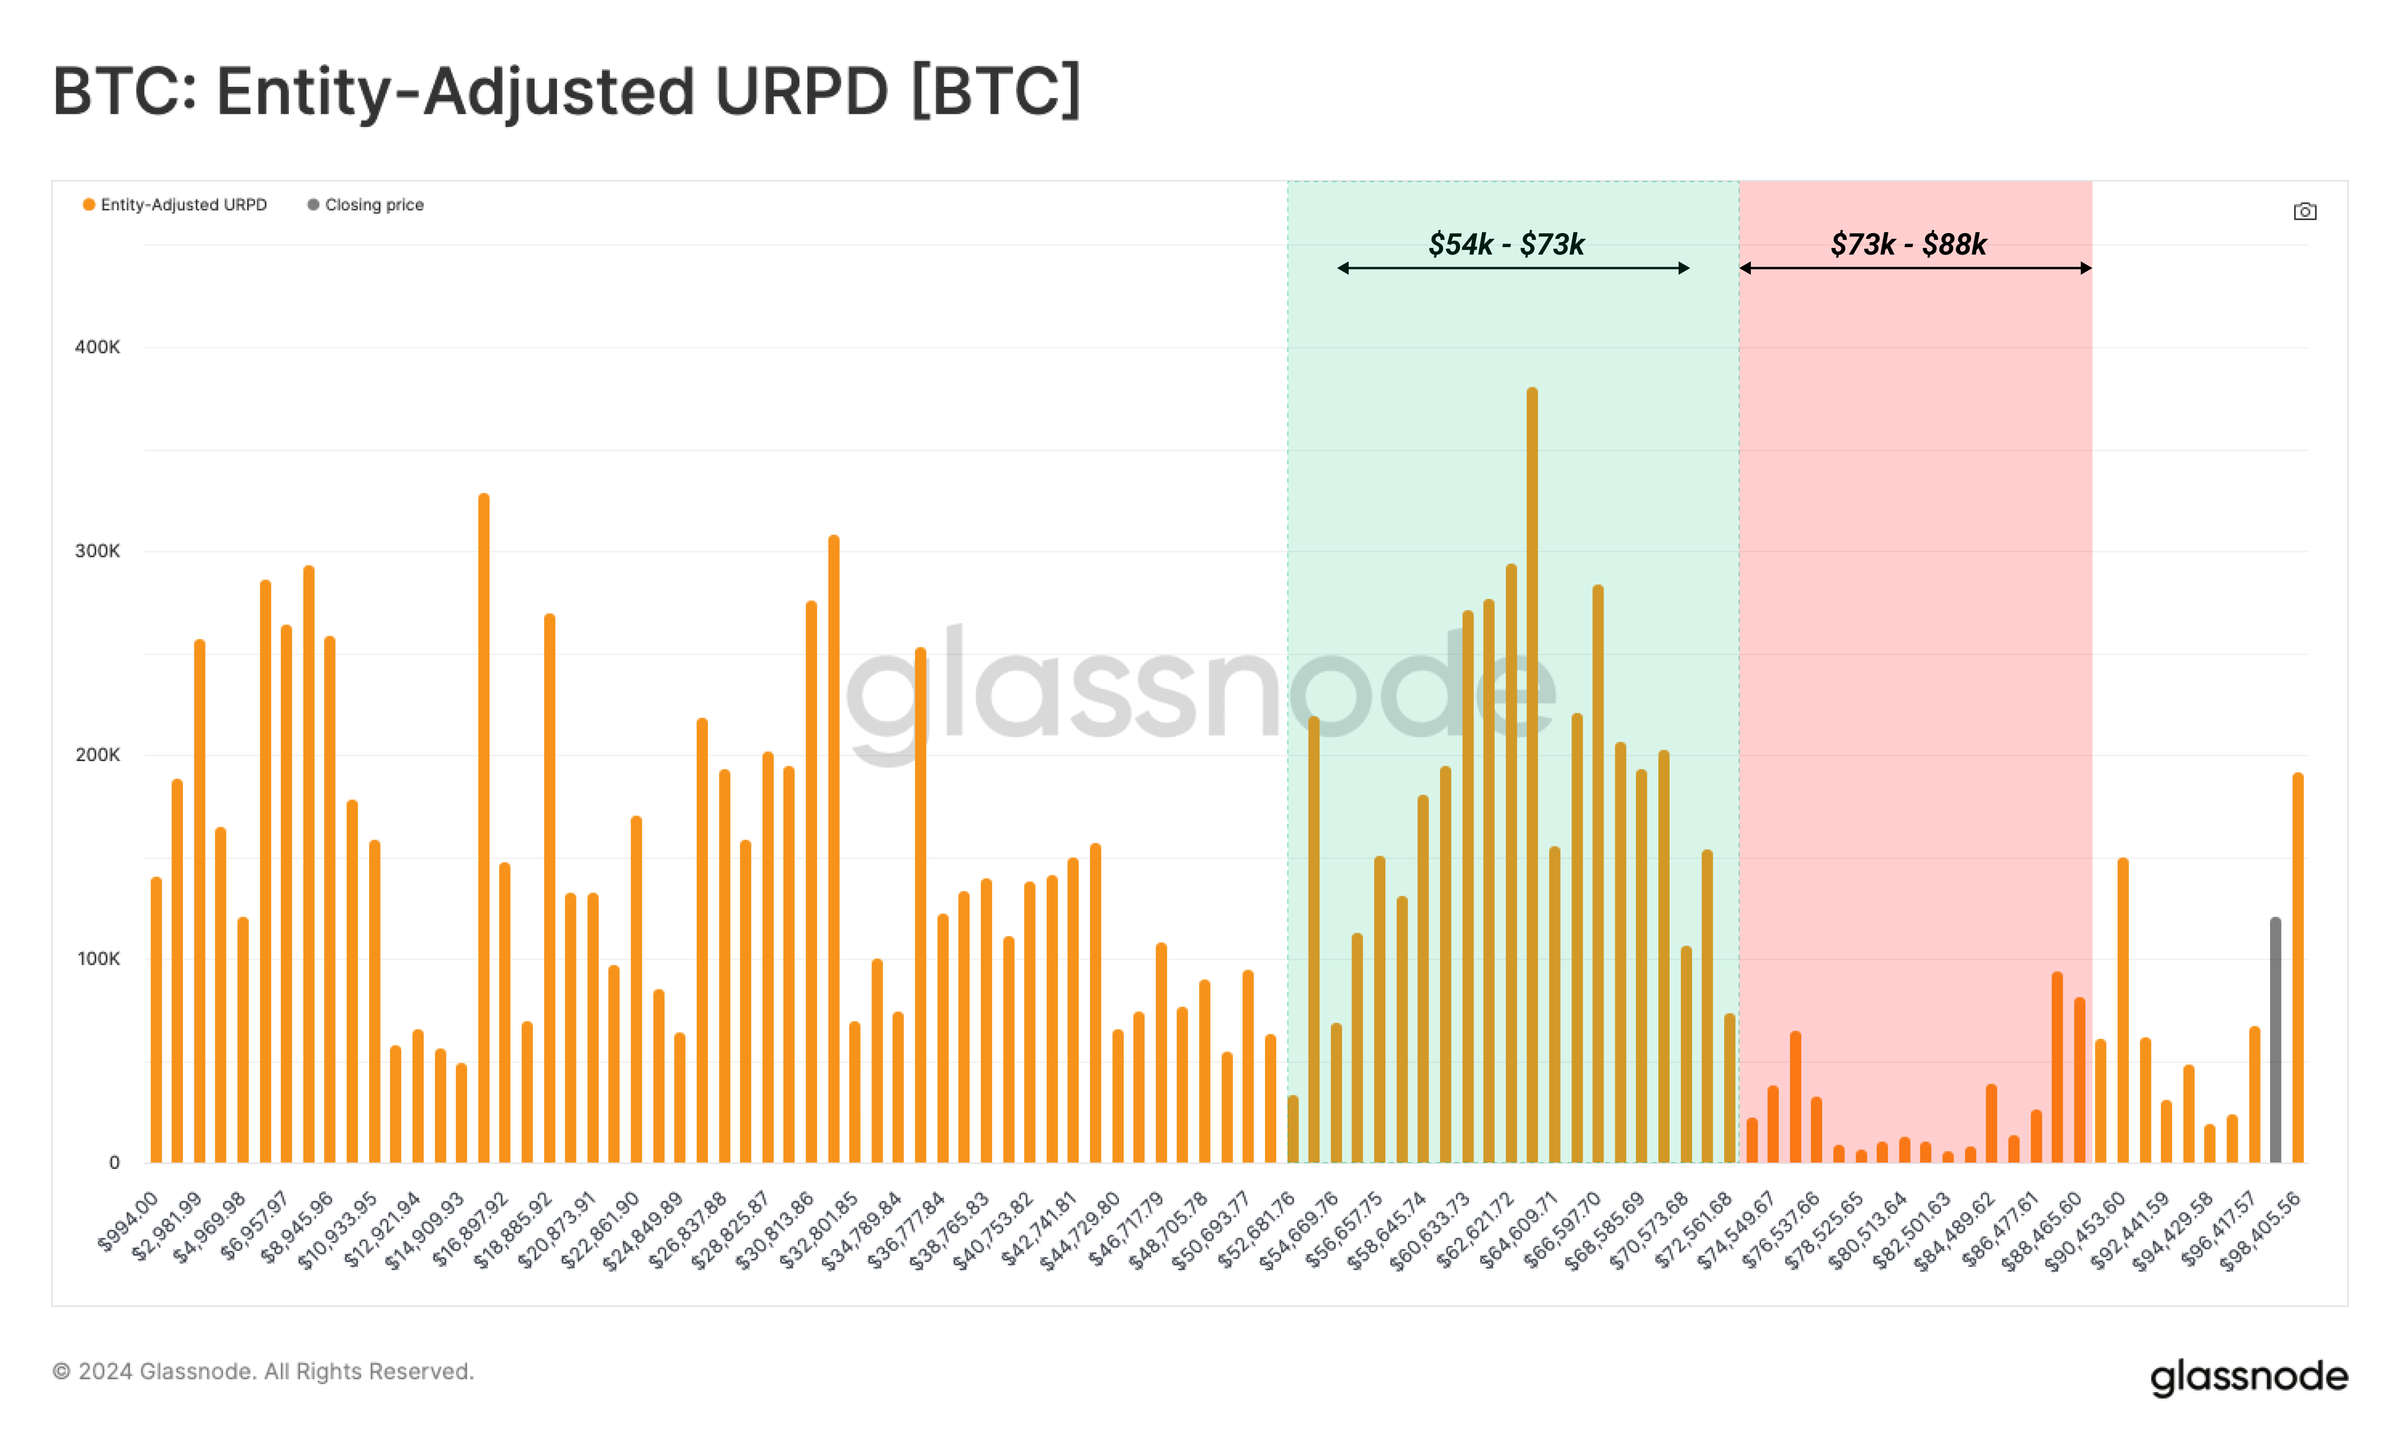
To assess the sustainability of this uptrend, we can compare the current Unrealized Profit Distribution (URPD) structure with the distribution during the March 2024 ATH period. During the March 2024 peak, with the price appreciation in the months following the ETF launch, the supply frequently shifted between several supply clusters in the $40,000 to $73,000 range. The subsequent seven months of volatile price action made this area one of the most significant supply clusters in history. As the supply was re-accumulated, this area became the starting point for the current rebound.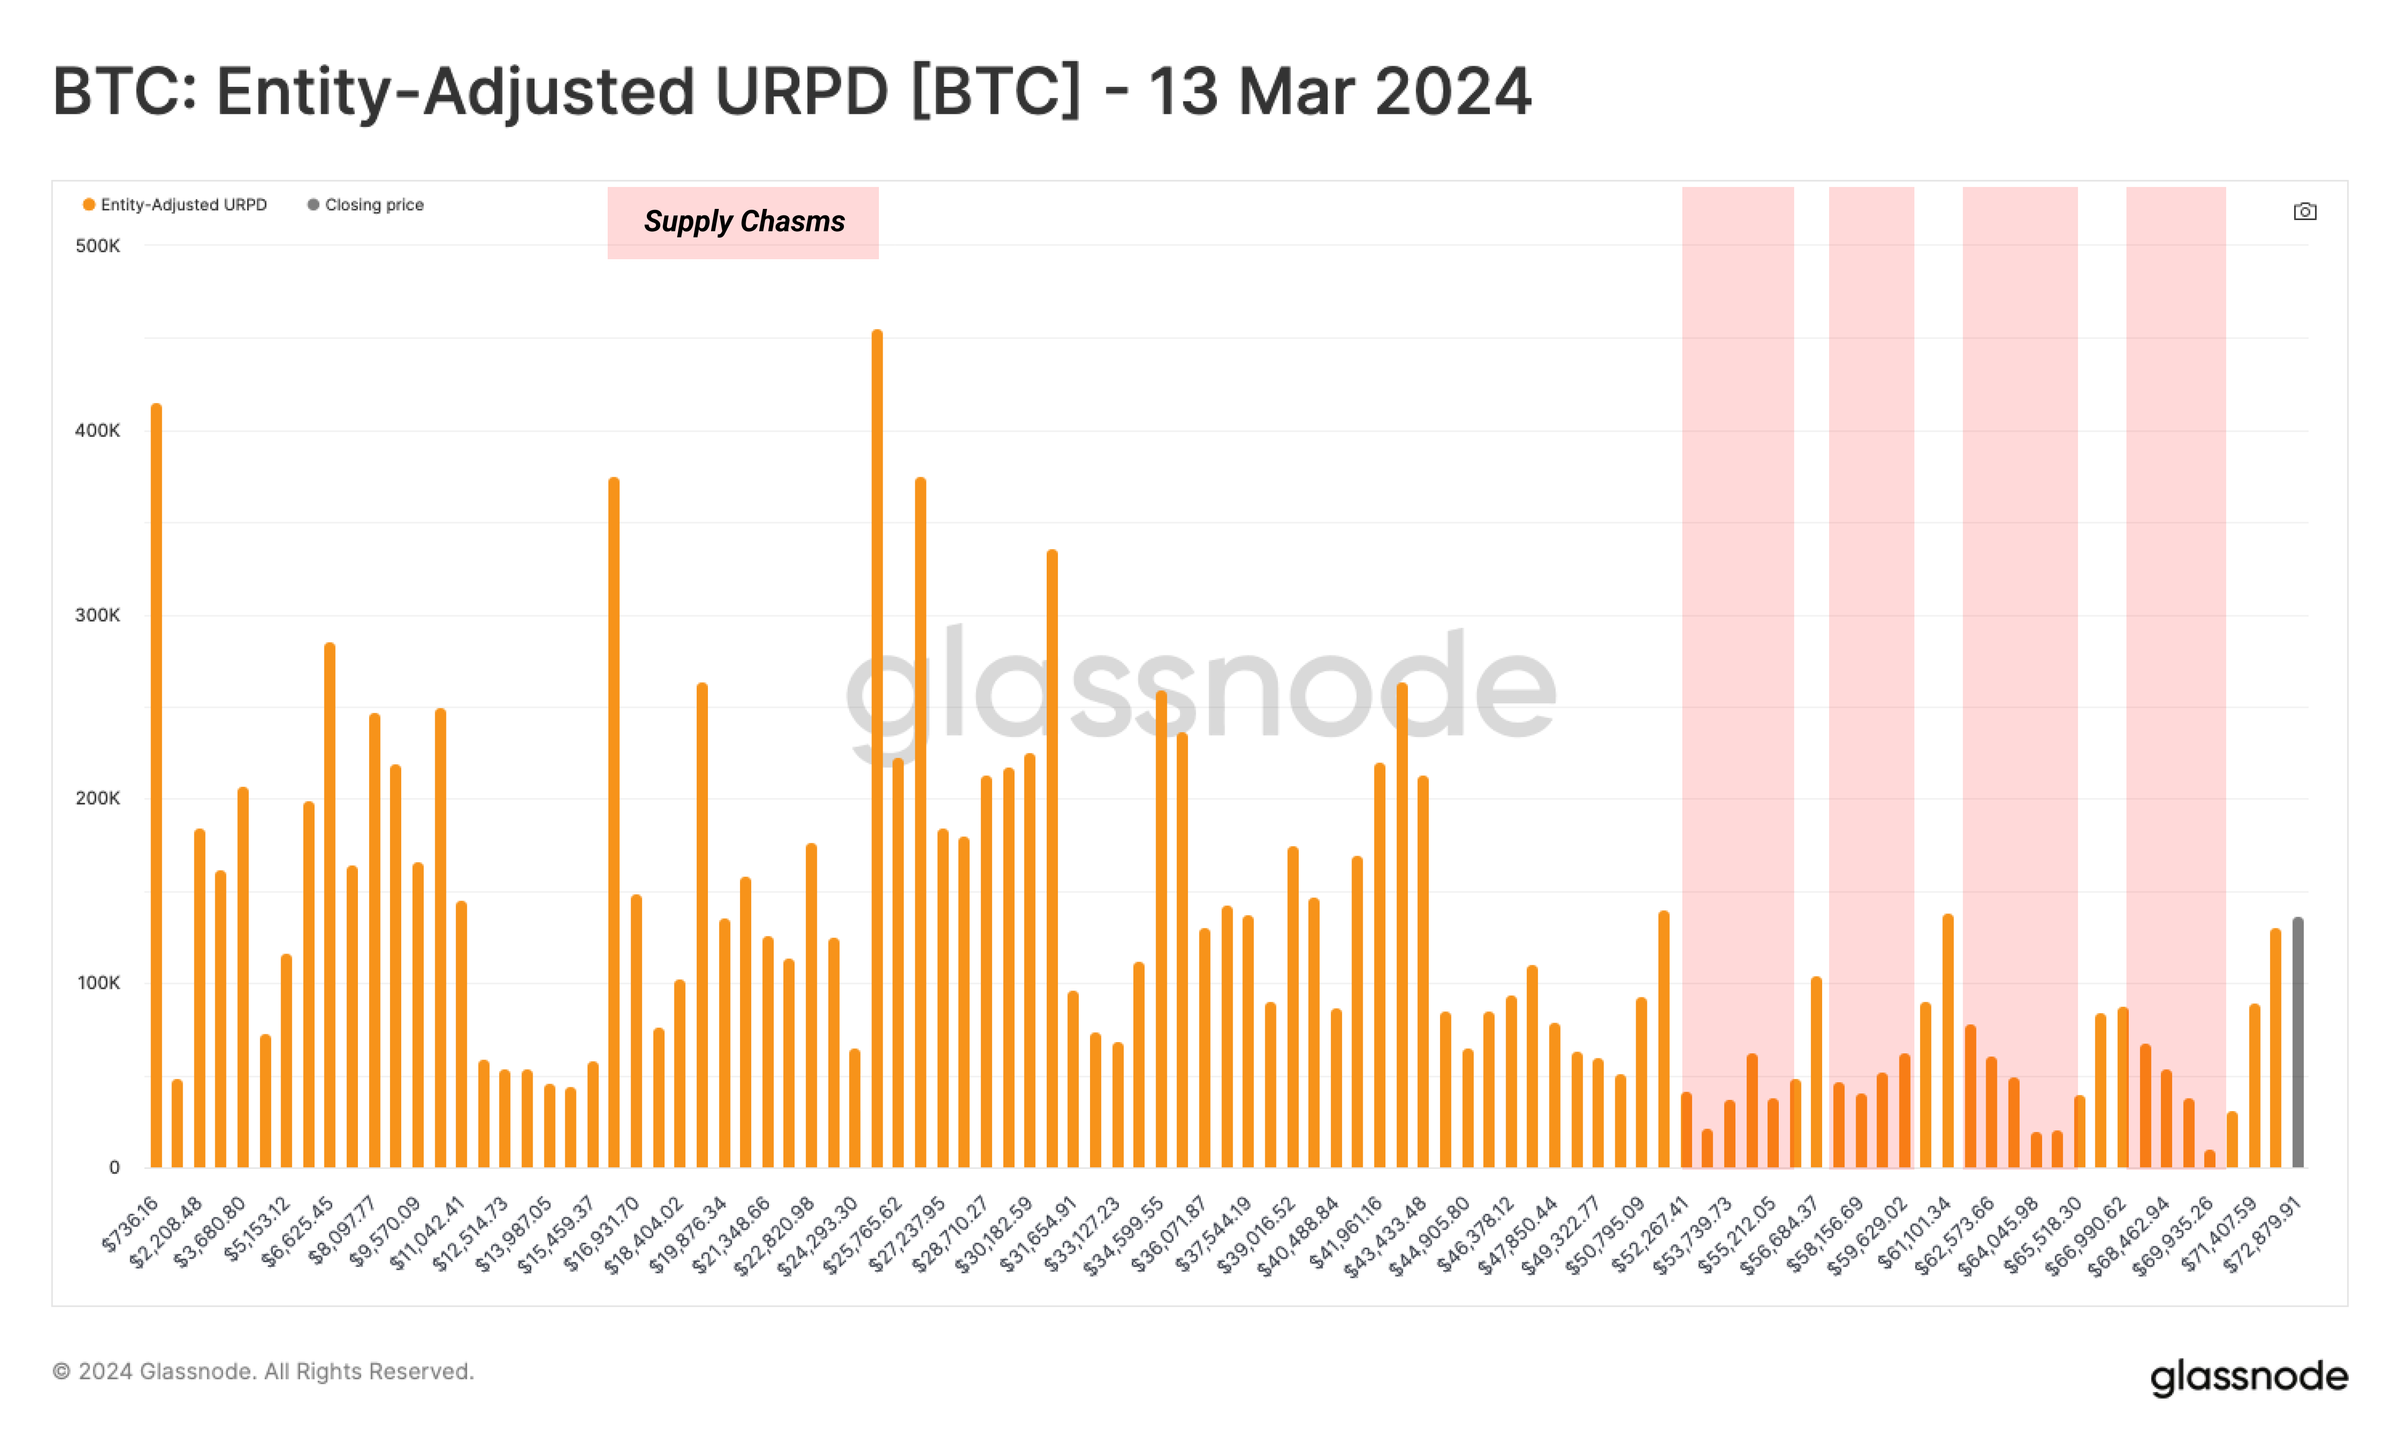 Fast forward to today, the market rebound is so fast that very few coins are traded between $76,000 and $88,000. We can draw two key conclusions from this:
1. Price discovery is a process that requires rebounds, pullbacks, and consolidation to confirm a new price range.
2. There is a certain "gap" below $88,000, and if the market adjusts and falls back before attempting to break through $100,000 again, this area may become the focus of attention.
In the current price discovery stage, changes in the distribution of supply can provide insights into the hot spots of supply and demand.
Summary and Conclusion
Supported by the soaring prices, long-term holders are massively distributing Bitcoin, locking in profits of up to $2.02 billion. This behavior has led to an oversupply, and the market needs to absorb these sell-offs to support continued price increases.
When analyzing the distribution subjects, most of the selling pressure comes from Bitcoin held for 6 months to 1 year. This indicates that longer-term holders may still be waiting for higher prices before selling.
Disclaimer: This article does not provide any investment advice. All data is for reference and educational purposes only, and any investment decisions are made at your own risk.