

Current Market Landscape: Multidimensional Risks of Breaching the $2,000 Psychological Level
1. Convergence of Three Technical Crises
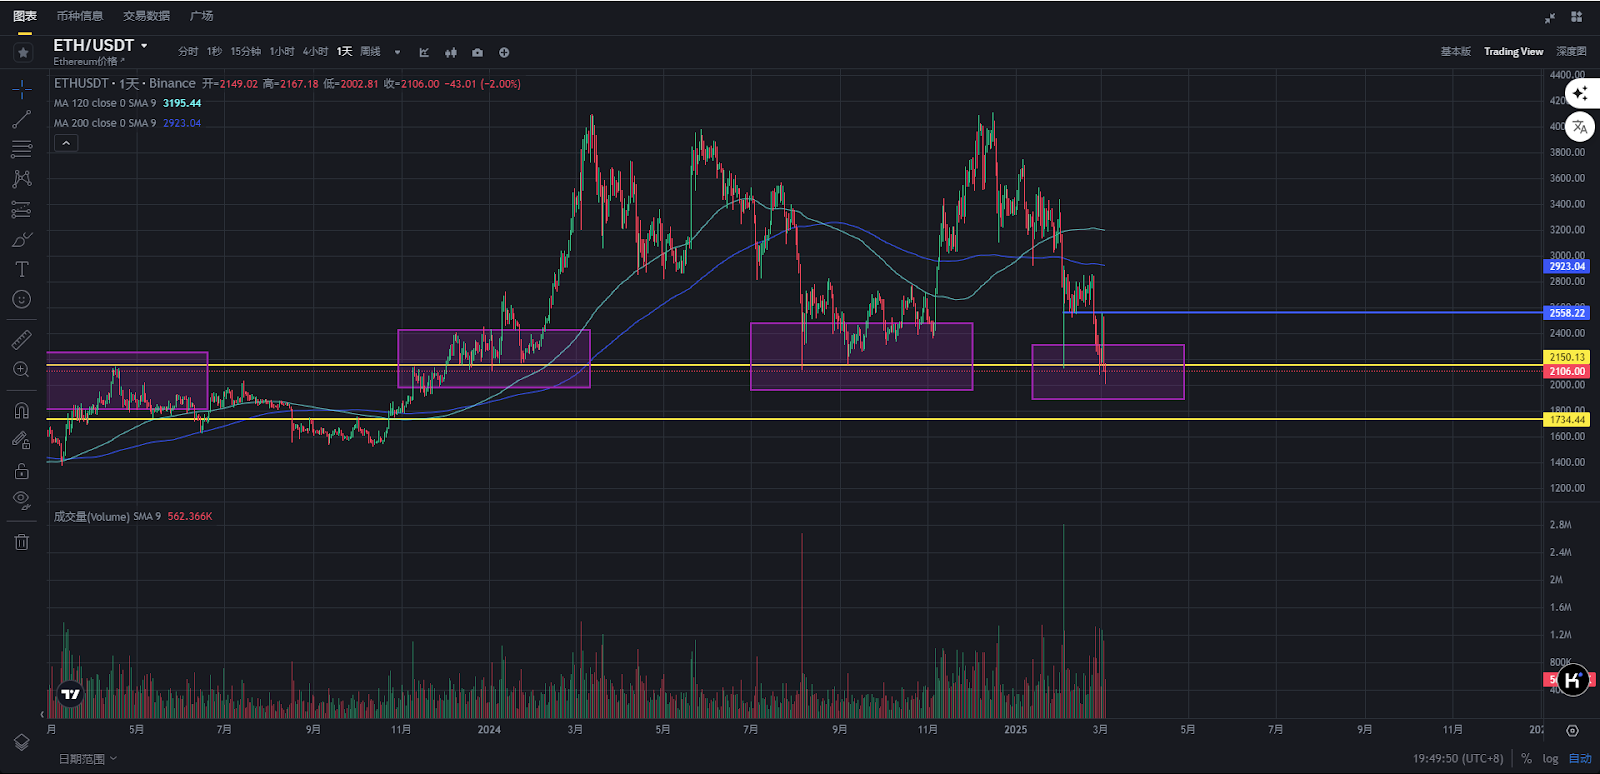
As of the editorial deadline, Ethereum is priced at $2,100. Ethereum's current price has broken below all short-term moving average supports, including the 100-hour moving average at $2,250. The daily chart shows the downward channel pattern has been completely destroyed, forming a bearish engulfing pattern. Key indicators show a bearish dominance:
- MACD: Remains in the bearish zone, with the momentum bars expanding, and no divergence signals have appeared.
- RSI: Has fallen below 30 on the hourly timeframe, and touched 42 on the daily timeframe, not yet in the oversold territory, leaving room for further downside.
- Trading Volume: Has expanded alongside the price decline, indicating the emergence of panic selling.
2. Institutional Outflows Exacerbate Pressure
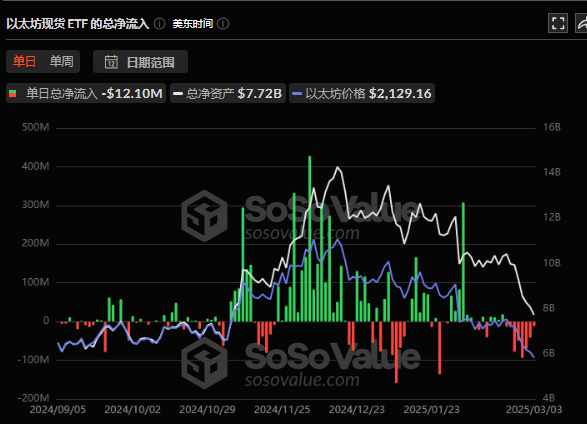 According to Sosovalue data, the U.S. Ethereum spot ETF has seen net outflows exceeding $369 million for 8 consecutive days, with BlackRock and other major institutions selling over $16 million in a single day. This contrasts sharply with the continuous inflows of ETF capital in February 2025, reflecting a rapid decline in institutional risk appetite.
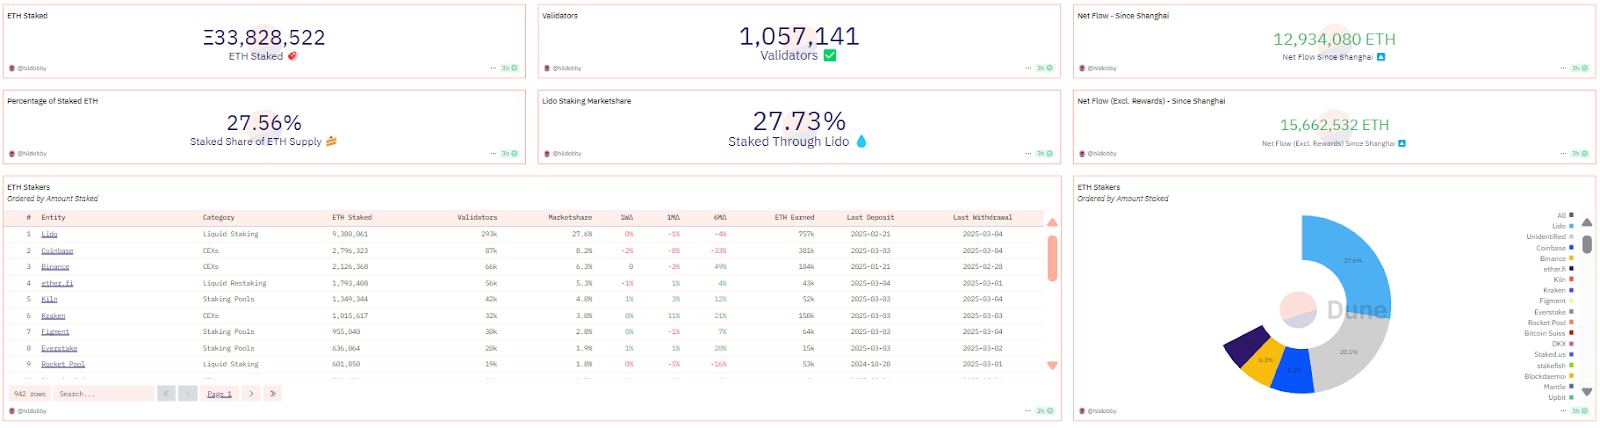
On-chain data also verifies this: Dune data shows the current total ETH staked is 33,828,522, with the staking rate dropping to 27.56% (a 4% decrease from the previous month), and whale address holdings have decreased by 12%.
3. Market Sentiment Trapped in a Vicious Cycle
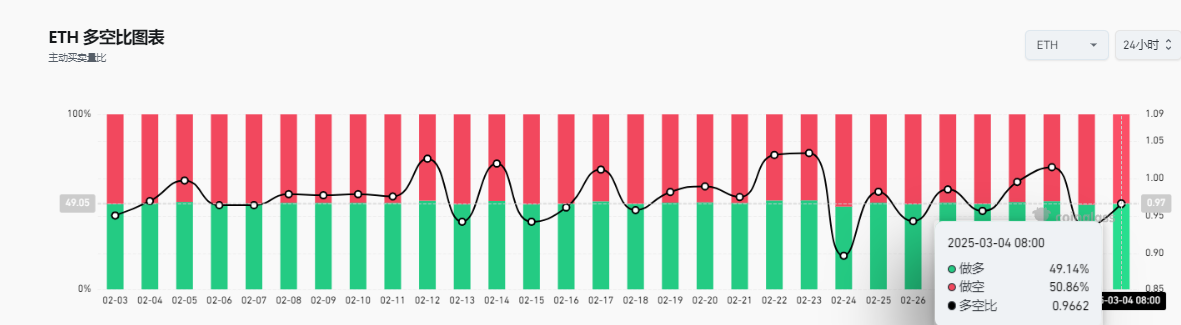
The derivatives market's long-short ratio has dropped to 0.966 (bearish dominance).
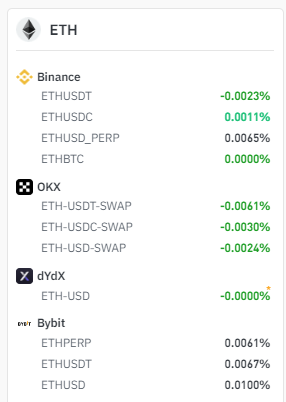
Perpetual contract funding rates have turned negative on multiple exchanges.
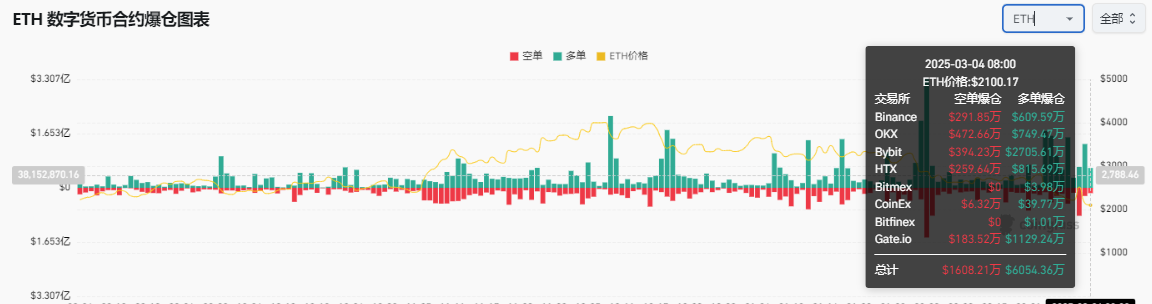
The 24-hour liquidation volume reached $200 million, with long positions accounting for over 83%. The social media sentiment index (Crypto Fear & Greed Index) has dropped to 23 (Extreme Fear).
II. Core Variable Analysis: Four Forces Determining the Short-Term Fate of ETH
1. Collapse and Reconstruction of the Technical Support System
Key Defense Line: $2,000 is not only a psychological round number, but also the 50% Fibonacci retracement of the 2024 bull market. A breach of this level will trigger a triple technical breakdown:
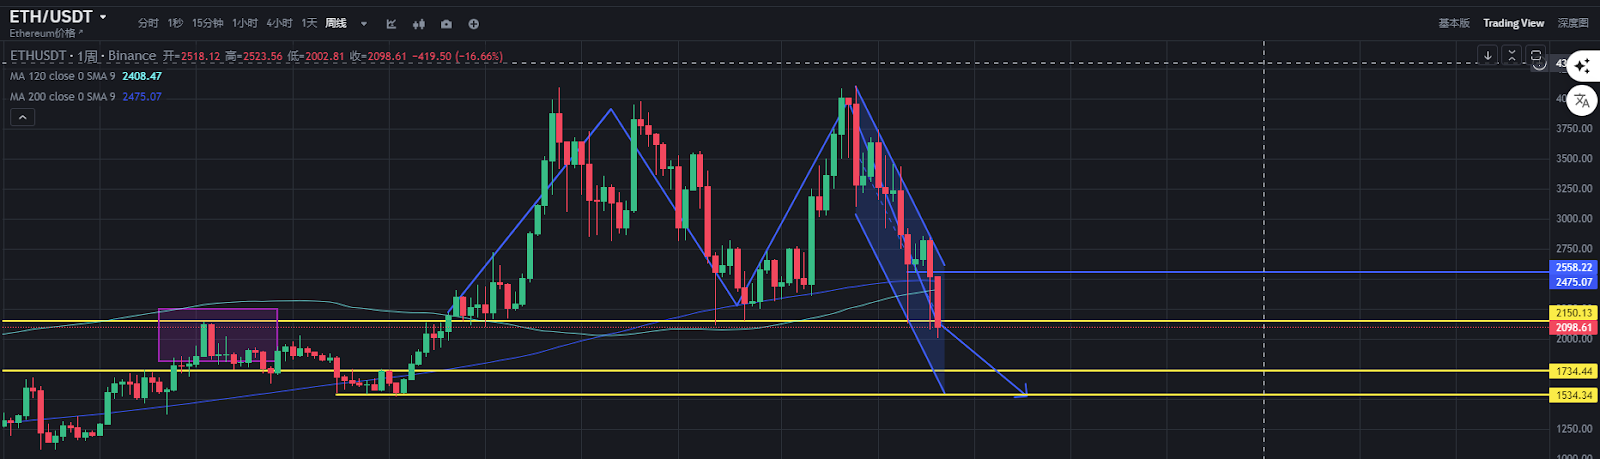
The weekly head-and-shoulders top pattern's neckline ($2,123) has been confirmed to be broken.
The monthly uptrend line (connecting the $1,100 in 2023 and $1,800 in 2024) has been breached, forming a descending triangle consolidation pattern, with a measured move target of $1,740-$1,750.
Counterattack Opportunity: If a Double Bottom can be formed above $2,000, a breakthrough of $2,275 (50% Fibonacci retracement) and consolidation above $2,350 (100-day moving average) would be required to reverse the short-term trend.
2. Tug-of-War between Macroeconomic Policies and Capital Flows
Bearish Factors:
The U.S. SEC has delayed the approval of Ethereum ETF options and ETF staking, increasing regulatory uncertainty.
Trump's crypto reserve plan faces legislative hurdles, leading to a market letdown and capital outflows.
Potential Bullish Factors:
The successful Ethereum Pectra upgrade,
Phase 1 (March 2025): Introducing key improvements such as account abstraction, doubling Layer-2 capacity, and increasing staking limits.
Phase 2 (Late 2025 or Early 2026): Implementing more advanced optimizations like PeerDAS and Verkle trees.
This upgrade is Ethereum's most significant update since the Dencun upgrade in 2024 and will significantly improve user experience and network performance.
3. Structural Contradictions in the Ecosystem Fundamentals
DeFi TVL Contraction: The total locked value has declined to $64 billion (a 35% drop from the peak), with liquidation risks spilling over to ETH staking derivatives.
Intensified Layer-2 Competition: Multiple Layer-2 ecosystem TVLs have continued to decline, revealing the effects of ecosystem fragmentation.
Persistent Low Gas Fees: Ethereum Gas has dropped to 0.92 Gwei.
4. Self-Fulfilling Cycle of Long-Short Leverage
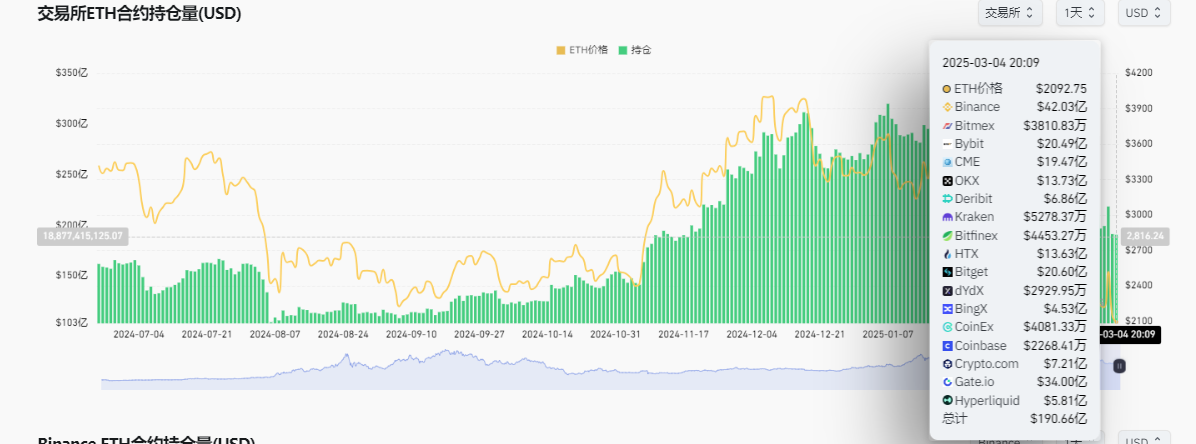
The current open interest in futures contracts has reached $19 billion, exceeding the previous high of Ethereum at $2,000. Around $1.2 billion in options contracts (31% of the monthly total) are concentrated near the $2,000 level, and a breach of this price would trigger a Gamma squeeze, exacerbating volatility.
III. Future Trajectory Projection: Paths and Key Nodes in Three Scenarios
Scenario 1: Extreme Bearish (Probability 60%)
Trigger Conditions: 3 consecutive daily closes below $1,990, and ETF weekly net outflows exceeding $500 million.
Path Unfolding:
Week 1: Rapid descent to $1,880 (November 2023 low), with liquidation volume potentially exceeding $100 million.
Week 2: Rebound to $2,050 but faced with resistance, forming a descending continuation pattern.
End of Month 1: Testing $1,740 (1.272 Fibonacci extension), with the extreme case reaching $1,640 (2023 bull market starting point).
Bottom Confirmation Signals:
Daily trading volume shrinking to 50% of the monthly average.
Perpetual contract funding rates dropping below -0.1% and maintaining for 24 hours.
Scenario 2: Neutral Consolidation (Probability 40%)
Trigger Conditions: $2,000-$2,200 range forming a price accumulation, and ETF outflows slowing to below $10 million per day.
Path Unfolding:
Week 1: Oscillating within the $1,980-$2,150 range, with volatility declining to 40%.
Week 2: Attempting to break above $2,300 on the EIP-4844 upgrade news, but facing short-seller attacks and retreating.
End of Month 1: Forming a symmetrical triangle consolidation, awaiting clarity on macroeconomic policies.
Catalysts for Trend Reversal:
March FOMC interest rate decision (March 20)
Ethereum core developer meeting (March 15)
IV. Bottom Assessment: Support Level Verification under a Multidimensional Model
1. On-Chain Cost Model
NUPL Indicator: The current value is -0.18, approaching the historical bottom range (-0.25 to -0.15), suggesting $1,750-$1,850 as strong support.
MVRV Ratio: 0.89 (below 1 indicates general holder losses), historical data shows this indicator bottoming and rebounding in the $1,720-$1,800 price range.
2. Technical Pattern Measurement
- Head-and-Shoulders Top Pattern Measured Move: $2,123 - ($4,092 - $2,123) = $1,740
- Descending Channel Lower Trendline Extension: Approximately $50 per week, reaching $1,680 by the end of the month.
3. Options Market Dynamics
$1,750 strike price has $430 million in put option open interest (27% of the monthly total), indicating market maker hedging support at this level.
Comprehensive Conclusion: Ethereum's interim bottom is most likely in the $1,720-$1,800 range, with the extreme black swan scenario potentially reaching $1,500, but this level would trigger a large-scale entry of value investment capital.
巨鲸持有 Block 引发 DeFi 市场剧烈波动
据报道,一只持有大量 Block 的 whale 在 DeFi 市场进行了大规模抛售操作,导致 Block 价格出现了双底。这一事件引发了 DeFi 市场的剧烈波动,gas 费用也随之大幅上涨。
分析人士表示,此次事件可能会对 TRON、Amp 等其他 DeFi 项目产生连锁反应。投资者需要密切关注 ETH、HT、AR 等主流 DeFi 代币的价格走势。
AMP 价格大涨,RON 和 ONG 表现亮眼
近期 DeFi 市场出现了一些亮点。其中,AMP 价格出现大涨,涨幅超过 20%。与此同时,RON 和 ONG 也表现不错,价格均有所上升。
业内人士表示,这些代币的表现反映了投资者对 DeFi 市场的信心有所恢复。预计未来 DeFi 市场仍将保持活跃。


