Author: Bitcoin Magazine Pro Team
Translated by: BitpushNews
After breaking through $100,000 and setting a new historical high, Bitcoin has entered a continuous downward trend. This price correction naturally raised market doubts about whether Bitcoin still follows the 2017 cycle pattern. This article will analyze the correlation between the current Bitcoin price trend and historical bull market cycles through data analysis, and explore potential future development paths for BTC.
Will It Replicate the 2017 Trend?
Since the bear market cycle low point in 2022, Bitcoin's price trajectory has shown a surprising similarity to the 2015-2017 cycle (which ultimately reached $20,000 in December 2017).
However, Bitcoin's recent downward trend marks the first significant deviation from the 2017 cycle—if strictly following the 2017 pattern, the past month should have been a period of new highs for Bitcoin, but the actual market has shown a sideways consolidation and downward trend, suggesting that the correlation between the two cycles may be weakening.

Figure 1: Current cycle trend trajectory recently deviates from historical patterns
Despite the recent trend divergence, the historical correlation between the current Bitcoin cycle and the 2017 cycle remains exceptionally high. Earlier this year, the correlation between the current cycle and the 2015-2017 cycle was about 92%. The recent price deviation has slightly reduced the correlation to 91%, which is still considered extremely high in financial markets.
Investor Behavior Analysis
The MVRV ratio (Market Value to Realized Value ratio) is a key indicator for observing investor behavior, used to measure the relationship between Bitcoin's current market price and the average cost price of all BTC holders on the chain.
When the MVRV ratio rises sharply, it indicates that investors' unrealized gains have significantly expanded, which often signals the formation of a market top; when the ratio falls back to the realized price, it means that Bitcoin's price is close to the average holding cost of investors, typically marking the market's bottom-building phase.

Figure 2: MVRV ratio still maintains a similar fluctuation pattern to the 2017 cycle
Latest MVRV Ratio Dynamics
The recent decline in the MVRV ratio reflects Bitcoin's pullback from its historical high, but its overall structure still shows similarity to the 2017 cycle—with multiple deep corrections after early bull market highs, maintaining a correlation of around 80%.
Data Lag Effect
One possible reason for the current trend divergence is the impact of data lag. For example, Bitcoin's price trend is highly correlated with global liquidity (total money supply of major economies), but historical data shows that liquidity changes typically take about two months to be reflected in Bitcoin's price.

Figure 3: Global M2 money supply has a lagged transmission effect on Bitcoin price
Lag Effect Verification
If the current Bitcoin price trend is processed with a 30-day lag compared to the 2017 cycle, the correlation rises to 93%, the highest recorded correlation between these two cycles. This lagged trend pattern suggests that Bitcoin may soon return to the 2017 trajectory, implying that a strong upward market may be imminent.
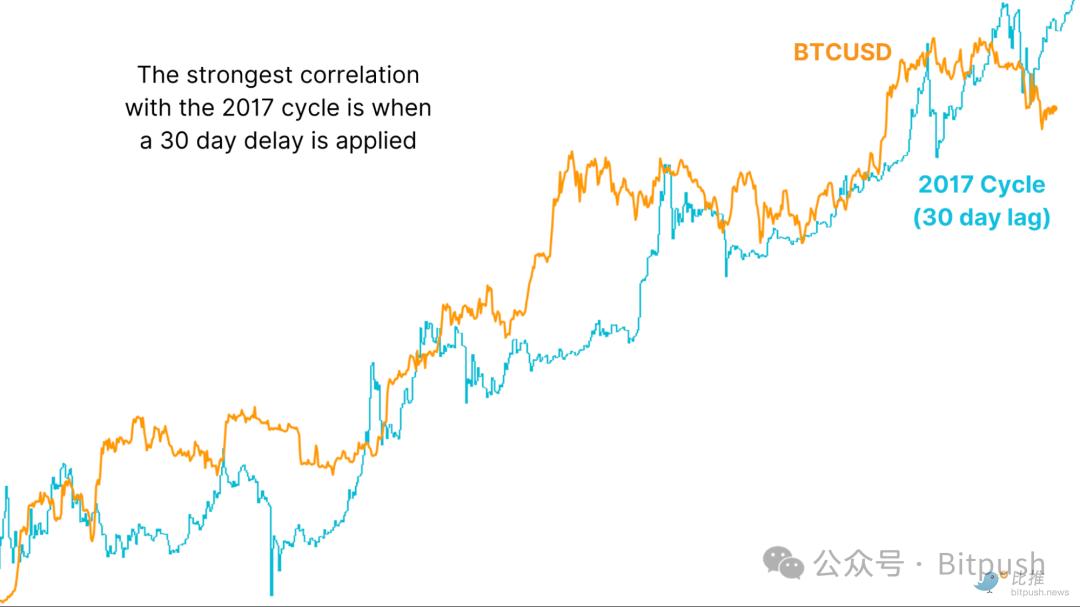
Figure 4: Price trend still highly consistent with 2017 data after 30-day lag processing
Core Conclusion
History does not simply repeat, but often rhymes. The current Bitcoin cycle may find it difficult to replicate the exponential surge of 2017, but the deep psychological market mechanisms still show a surprising similarity. If Bitcoin re-establishes contact with the lagged 2017 cycle, historical patterns suggest that Bitcoin may soon recover from the current adjustment and usher in a breakthrough upward movement.