

This article is machine translated
Show original
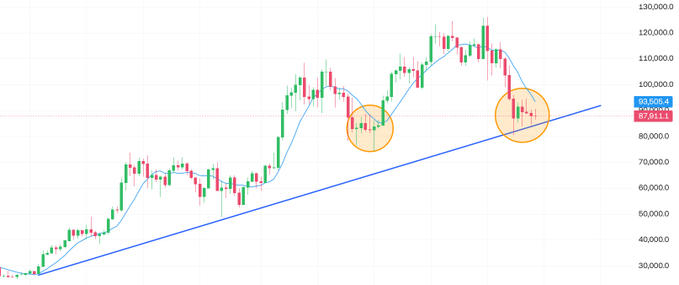
Looking at this week's chart, I'm very confident; this is a typical sign of weakening bearish momentum!
This correction has most likely reached its bottom, with the bottom around 80,000 already formed. The only question is how long the bottoming process will last!
I believe the structure of the bull-bear cycle has changed, and the future trend will be a long-term, slow bull market. The current decline is not a bear market but a major structural adjustment.
Reason 1: Based on the low of 15,000 in 2022 and the high of 126,000 in 2025, the increase is about 111,000. The 38.2% retracement level is around 83,500. This round of decline was quickly recovered after a brief drop, indicating that the bulls intervened strongly and the key Fibonacci level was not broken.
Reason 2: The moving average provides dynamic support in the 85,000-90,000 range, which coincides with the mid-2025 pullback zone. The 9-week MA closed at 93,504 USD. Although the price briefly fell below this level, it rebounded quickly, similar to the V-shaped recovery after multiple 30%+ pullbacks in 2021.
Reason 3: While trading volume increased during the decline, it wasn't extreme. The latest candlestick is a small bearish candle with a long lower shadow, accompanied by a rebound in the RSI (estimated from the chart) from the oversold zone, clearly indicating that selling pressure has exhausted. The area around 86000 is a turning point between bullish and bearish trends, and combined with the recent slowdown in capital outflows, the bottom has likely been found.
The rebound target after the Lunar New Year (1-2 months, January-February 2026) is 95,000-110,000. The bulls will break through the MA resistance (93,500 USD), with a gain of 10%-25%, benefiting from the seasonal effect of the new year and the recovery of ETFs. Be wary of volatility; if it breaks below 85,000 USD, a short-term wait-and-see approach is recommended, but the probability is low (<20%).
A strong breakout is expected in the medium term (3-4 months, March-June 2026), targeting 140,000-160,000. A MACD golden cross confirms the bullish trend after stabilizing above 110,000. Historically, a parabolic rise is common in the year following a halving, such as the surge from 30,000 to 69,000 in 2021. The 160,000 USD level represents the 161.8% Fibonacci extension (calculated from the bottom), indicating strong upward momentum, but monitoring inflation/interest rate dynamics is necessary.
I believe the overall trend will remain bullish, with high volatility tilting upwards. The above analysis is based on the premise that BTC will not effectively fall below 80,000 again; if it does, then it's all over!

比特币子棋(重生版)
@cloakmk
12-27
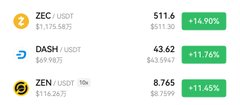
匿名币是我一直强调的板块,如今又强势开启了。
ZEC在330U附近时我提到它开启了二段,后续果然不断震荡走高!
这是一个值得押注的板块,ZEC显然是龙头,DASH总是联动,ZEN是他们当中市值最低也最容易被操控的一个,容易暴涨暴跌!
因此,既然再次启动高度就不可能只有这么点,我刚加仓了一点…… x.com/cloakmk/status…
Okay, I believe you.
Just do it
From Twitter
Disclaimer: The content above is only the author's opinion which does not represent any position of Followin, and is not intended as, and shall not be understood or construed as, investment advice from Followin.
Like
Add to Favorites
Comments
Share


